Deck 7: Alternative Methods of Valuation of Environmental Goods and Services
ملء الشاشة (f)
سؤال
سؤال
سؤال
سؤال
سؤال
سؤال
سؤال
سؤال
سؤال
سؤال
سؤال
سؤال
سؤال
سؤال
سؤال
سؤال
Figure 7A
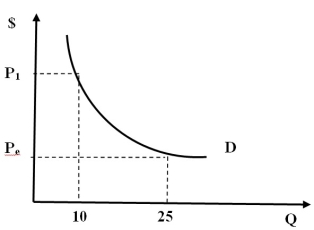
-Refer to Figure 7A. Which of the following statements can apply to Figure 7A?
A) The figure represents a demand curve.
B) The figure represents an environmental supply curve.
C) The figure represents consumers' willingness to pay.
D) Both a and c.
E) Both band c.
-Refer to Figure 7A. Which of the following statements can apply to Figure 7A?
A) The figure represents a demand curve.
B) The figure represents an environmental supply curve.
C) The figure represents consumers' willingness to pay.
D) Both a and c.
E) Both band c.
سؤال
Figure 7A
-Refer to Figure 7A. Which of the following statements can apply to Figure 7A?
A) If Pe is assumed to be the market equilibrium price, all those consumers whose WTP is
represented by P1 will be expected to decide to purchase this good or service.
B) P1 represents what consumers' are willing to pay for the 10th unit of a given good or
service, Q.
C) Pe represents what consumers' are willing to pay for the 25th unit of a given good or
service, Q.
D) All can apply.
E) None apply.
سؤال
Figure 7B
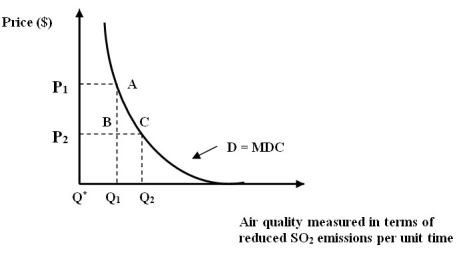
-Refer to Figure 7B. The marginal damage cost curve implies that …
A) Beyond Q2, society's WTP for the next incremental increase in environmental
improvement is extremely high.
B) Beyond Q2, society's WTP for the next incremental increase in environmental
improvement is extremely low.
C) At Q1, society's WTP is optimized.
D) At Q2, society's WTP is optimized.
E) None of the above.
سؤال
سؤال
Figure 7C
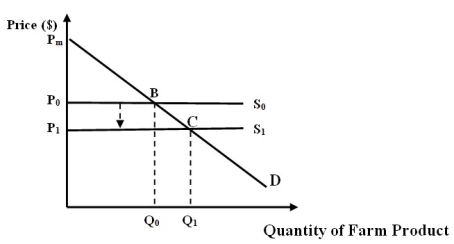
-Refer to Figure 7C. Assume that the farm product is grapes for wine-making. Which of the following reason(s) can result in a shift of the supply curve as illustrated in the figure?
A) Grape farms have improved access to water.
B) New, stricter environmental regulations improve air quality.
C) New, lax environmental regulations reduce air quality.
D) Both a and b
E) Both a and c
سؤال
Figure 7C
-Refer to Figure 7C. Assume that the farm product is grapes for wine-making. Also assume that the market for grapes is defined by the demand curve, D, and the supply curve, S1. Which of the following areas represents consumer surplus for this market?
A) Triangle pmcp1.
B) Triangle pmbp0.
C) Area P1BCP0.
D) None of these areas.
سؤال
سؤال
Figure 7D
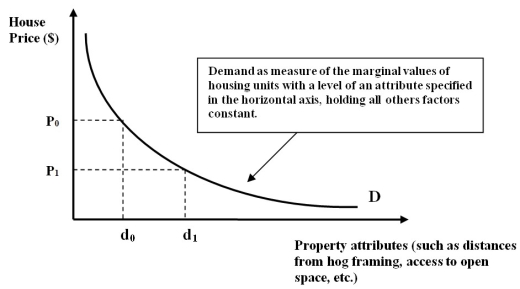
-Refer to Figure 7D. The hedonic demand function in the figure provides information on which of the following?
A) House price for all of the attributes listed.
B) Quantity information of all property attributes listed.
C) Quantity information of some of the property attributes.
D) Quantity information of only one of the property attributes listed.
E) None of the above.
سؤال
Figure 7D
-Refer to Figure 7D. Given the hedonic demand function in the figure, if distance from a scenic park is the attribute on the x-axis, then a house with very close proximity to the park will likely
be priced…
A) Closer to P1 than to P0.
B) Closer to P0 than to P0.
C) Exactly at P1.
D) Exactly at P0.
E) There would be no house built near wildlife areas.
سؤال
Figure 7E
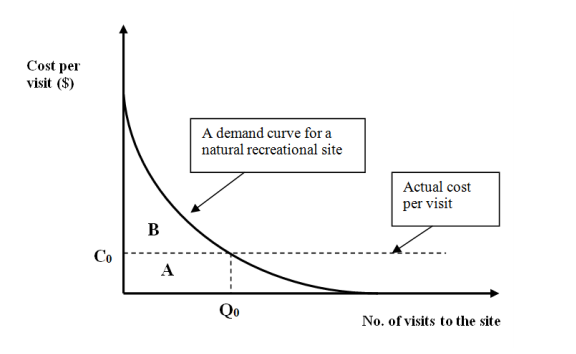
-Refer to Figure 7E. Assume that the function in the figure measures WTP for visits to a national park. If the actual cost per visit is set above C0, then it must be that consumer surplus
is…
A) Equal to producer surplus.
B) Greater than area B.
C) Equal to area A.
D) Equal to area B.
E) Smaller than area B.

فتح الحزمة
قم بالتسجيل لفتح البطاقات في هذه المجموعة!
Unlock Deck
Unlock Deck
1/25
العب
ملء الشاشة (f)
Deck 7: Alternative Methods of Valuation of Environmental Goods and Services
1
Willingness to pay (WTP) is a measure of consumers' willingness to pay for the
ith unit of output.
ith unit of output.
True
2
If the MDC depicts the amount society is willing to pay to avoid damage at the
margin, then the MDC is essentially the supply curve for environmental quality.
margin, then the MDC is essentially the supply curve for environmental quality.
False
3
WTP and WTA are equivalent only if consumers value gains and losses similarly.
True
4
The actual measurement of WTP requires information on the prices, which are
difficult to obtain for environmental assets.
difficult to obtain for environmental assets.
فتح الحزمة
افتح القفل للوصول البطاقات البالغ عددها 25 في هذه المجموعة.
فتح الحزمة
k this deck
5
Consumers' surplus is the difference between what consumers are willing to
accept and what they will to pay.
accept and what they will to pay.
فتح الحزمة
افتح القفل للوصول البطاقات البالغ عددها 25 في هذه المجموعة.
فتح الحزمة
k this deck
6
The opportunity cost approach uses shadow prices, which are values of similar
goods in the public market.
goods in the public market.
فتح الحزمة
افتح القفل للوصول البطاقات البالغ عددها 25 في هذه المجموعة.
فتح الحزمة
k this deck
7
If a specific forest ecosystem service can be substituted with a physical structure
or technology, then the cost of this substitute to replace the forest ecosystem
service is viewed as the economic value of the forest's service.
or technology, then the cost of this substitute to replace the forest ecosystem
service is viewed as the economic value of the forest's service.
فتح الحزمة
افتح القفل للوصول البطاقات البالغ عددها 25 في هذه المجموعة.
فتح الحزمة
k this deck
8
Environmental features are always found to increase land and house values.
فتح الحزمة
افتح القفل للوصول البطاقات البالغ عددها 25 في هذه المجموعة.
فتح الحزمة
k this deck
9
If John is willing to pay extra land taxes to keep a cell phone tower away from his
home, then he is implicitly revealing his WTP for avoiding the nuisances/dangers
associated with a cell phone tower.
home, then he is implicitly revealing his WTP for avoiding the nuisances/dangers
associated with a cell phone tower.
فتح الحزمة
افتح القفل للوصول البطاقات البالغ عددها 25 في هذه المجموعة.
فتح الحزمة
k this deck
10
A hedonic wage function can be used to reveal how much compensation, on average, a
high-voltage powerline worker requires to accept more environmental risk of working
with powerlines.
high-voltage powerline worker requires to accept more environmental risk of working
with powerlines.
فتح الحزمة
افتح القفل للوصول البطاقات البالغ عددها 25 في هذه المجموعة.
فتح الحزمة
k this deck
11
An annual present value amount represents the value of X extra years of living
(life) to an individual.
(life) to an individual.
فتح الحزمة
افتح القفل للوصول البطاقات البالغ عددها 25 في هذه المجموعة.
فتح الحزمة
k this deck
12
In the United States, the estimates for defensive environmental expenditure range
between 25 to 50 percent of total GDP.
between 25 to 50 percent of total GDP.
فتح الحزمة
افتح القفل للوصول البطاقات البالغ عددها 25 في هذه المجموعة.
فتح الحزمة
k this deck
13
The limitation of these stated preference methods is that they can only measure
use values.
use values.
فتح الحزمة
افتح القفل للوصول البطاقات البالغ عددها 25 في هذه المجموعة.
فتح الحزمة
k this deck
14
Stated preference valuation methods differ from revealed preference valuation
methods in that the WTP is elicited by asking people to directly state their choices by using survey methods.
methods in that the WTP is elicited by asking people to directly state their choices by using survey methods.
فتح الحزمة
افتح القفل للوصول البطاقات البالغ عددها 25 في هذه المجموعة.
فتح الحزمة
k this deck
15
One cannot carry out a contingent valuation survey unless the study participants
are familiar with the exact nature of the environmental goods or services to be
valued.
are familiar with the exact nature of the environmental goods or services to be
valued.
فتح الحزمة
افتح القفل للوصول البطاقات البالغ عددها 25 في هذه المجموعة.
فتح الحزمة
k this deck
16
Figure 7A
-Refer to Figure 7A. Which of the following statements can apply to Figure 7A?
A) The figure represents a demand curve.
B) The figure represents an environmental supply curve.
C) The figure represents consumers' willingness to pay.
D) Both a and c.
E) Both band c.
-Refer to Figure 7A. Which of the following statements can apply to Figure 7A?
A) The figure represents a demand curve.
B) The figure represents an environmental supply curve.
C) The figure represents consumers' willingness to pay.
D) Both a and c.
E) Both band c.
فتح الحزمة
افتح القفل للوصول البطاقات البالغ عددها 25 في هذه المجموعة.
فتح الحزمة
k this deck
17
Figure 7A
-Refer to Figure 7A. Which of the following statements can apply to Figure 7A?
A) If Pe is assumed to be the market equilibrium price, all those consumers whose WTP is
represented by P1 will be expected to decide to purchase this good or service.
B) P1 represents what consumers' are willing to pay for the 10th unit of a given good or
service, Q.
C) Pe represents what consumers' are willing to pay for the 25th unit of a given good or
service, Q.
D) All can apply.
E) None apply.
فتح الحزمة
افتح القفل للوصول البطاقات البالغ عددها 25 في هذه المجموعة.
فتح الحزمة
k this deck
18
Figure 7B
-Refer to Figure 7B. The marginal damage cost curve implies that …
A) Beyond Q2, society's WTP for the next incremental increase in environmental
improvement is extremely high.
B) Beyond Q2, society's WTP for the next incremental increase in environmental
improvement is extremely low.
C) At Q1, society's WTP is optimized.
D) At Q2, society's WTP is optimized.
E) None of the above.
فتح الحزمة
افتح القفل للوصول البطاقات البالغ عددها 25 في هذه المجموعة.
فتح الحزمة
k this deck
19
Since economic valuation of benefit is based on the concept of WTP, this implies that…
A) The benefits from improved environmental quality are equal to the value of the
environment.
B) The benefits from improved environmental quality are greater than the value of the
environment.
C) The benefits from improved environmental quality are the preferences of people for an
environmental good.
D) The benefits from improved environmental quality are greater than the preferences of
people for an environmental good.
فتح الحزمة
افتح القفل للوصول البطاقات البالغ عددها 25 في هذه المجموعة.
فتح الحزمة
k this deck
20
Figure 7C
-Refer to Figure 7C. Assume that the farm product is grapes for wine-making. Which of the following reason(s) can result in a shift of the supply curve as illustrated in the figure?
A) Grape farms have improved access to water.
B) New, stricter environmental regulations improve air quality.
C) New, lax environmental regulations reduce air quality.
D) Both a and b
E) Both a and c
فتح الحزمة
افتح القفل للوصول البطاقات البالغ عددها 25 في هذه المجموعة.
فتح الحزمة
k this deck
21
Figure 7C
-Refer to Figure 7C. Assume that the farm product is grapes for wine-making. Also assume that the market for grapes is defined by the demand curve, D, and the supply curve, S1. Which of the following areas represents consumer surplus for this market?
A) Triangle pmcp1.
B) Triangle pmbp0.
C) Area P1BCP0.
D) None of these areas.
فتح الحزمة
افتح القفل للوصول البطاقات البالغ عددها 25 في هذه المجموعة.
فتح الحزمة
k this deck
22
Which of the following is not a limitation of the market pricing approach to evaluating environmental goods and services?
A) One needs to use opportunity cost.
B) Only a few ecosystem services are traded in markets.
C) There are price distortions.
D) Markets for these goods are imperfect.
E) Demand and supply curves are not always well-defined.
A) One needs to use opportunity cost.
B) Only a few ecosystem services are traded in markets.
C) There are price distortions.
D) Markets for these goods are imperfect.
E) Demand and supply curves are not always well-defined.
فتح الحزمة
افتح القفل للوصول البطاقات البالغ عددها 25 في هذه المجموعة.
فتح الحزمة
k this deck
23
Figure 7D
-Refer to Figure 7D. The hedonic demand function in the figure provides information on which of the following?
A) House price for all of the attributes listed.
B) Quantity information of all property attributes listed.
C) Quantity information of some of the property attributes.
D) Quantity information of only one of the property attributes listed.
E) None of the above.
فتح الحزمة
افتح القفل للوصول البطاقات البالغ عددها 25 في هذه المجموعة.
فتح الحزمة
k this deck
24
Figure 7D
-Refer to Figure 7D. Given the hedonic demand function in the figure, if distance from a scenic park is the attribute on the x-axis, then a house with very close proximity to the park will likely
be priced…
A) Closer to P1 than to P0.
B) Closer to P0 than to P0.
C) Exactly at P1.
D) Exactly at P0.
E) There would be no house built near wildlife areas.
فتح الحزمة
افتح القفل للوصول البطاقات البالغ عددها 25 في هذه المجموعة.
فتح الحزمة
k this deck
25
Figure 7E
-Refer to Figure 7E. Assume that the function in the figure measures WTP for visits to a national park. If the actual cost per visit is set above C0, then it must be that consumer surplus
is…
A) Equal to producer surplus.
B) Greater than area B.
C) Equal to area A.
D) Equal to area B.
E) Smaller than area B.
فتح الحزمة
افتح القفل للوصول البطاقات البالغ عددها 25 في هذه المجموعة.
فتح الحزمة
k this deck
فتح الحزمة
افتح القفل للوصول البطاقات البالغ عددها 25 في هذه المجموعة.


