Deck 31: Dealing With Multiple Data Sets or With Multiple Variables
ملء الشاشة (f)
سؤال
Consider the following histograms for the scores on the same test by two different classes. 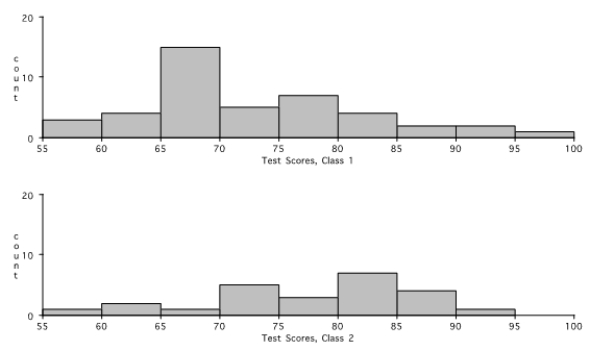
What can you tell about the classes and their performances from the histograms?
What can you tell about the classes and their performances from the histograms?
سؤال
Consider the following box plots for the scores on the same test by two different classes. 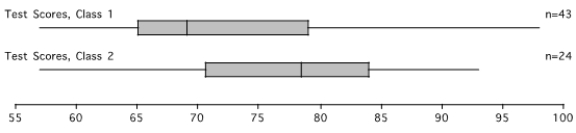
What can you tell about the classes and their performances from the box plots?
What can you tell about the classes and their performances from the box plots?
سؤال
Below are the histograms for the test scores for two tests (for the same class). 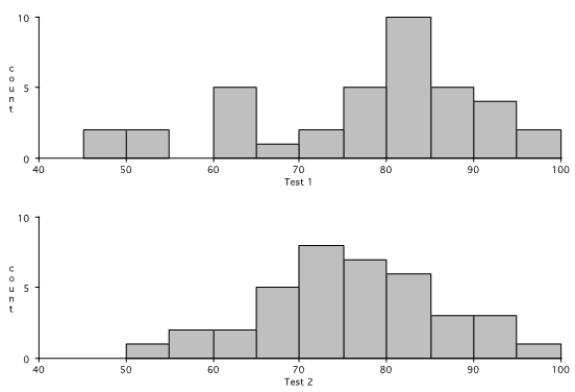
What can you tell about the performances on the two tests from the histograms?
What can you tell about the performances on the two tests from the histograms?
سؤال
Below are the box plots for the test scores for two tests (for the same class). 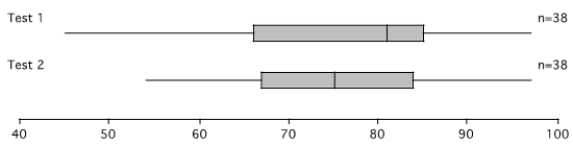
What can you tell about the performances on the two tests from the box plots?
What can you tell about the performances on the two tests from the box plots?
سؤال
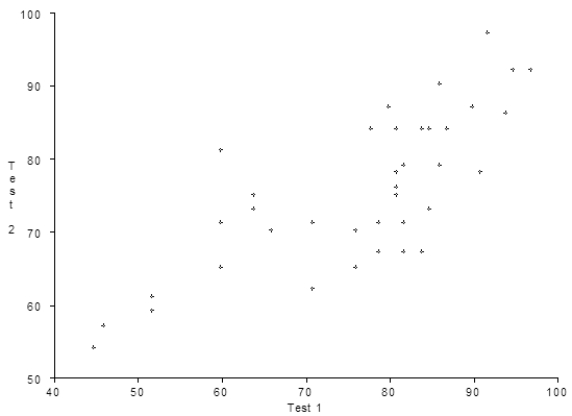
Below is a scatter plot of the test scores for two unrelated tests by the same students.
A) Are the two variables positively associated or negatively associated? Explain.
B) What might be a reason for that association?
C) Does the Test 1 score cause the Test 2 score?
A) Are the two variables positively associated or negatively associated? Explain.
B) What might be a reason for that association?
C) Does the Test 1 score cause the Test 2 score?
سؤال
سؤال
سؤال

فتح الحزمة
قم بالتسجيل لفتح البطاقات في هذه المجموعة!
Unlock Deck
Unlock Deck
1/8
العب
ملء الشاشة (f)
Deck 31: Dealing With Multiple Data Sets or With Multiple Variables
1
Consider the following histograms for the scores on the same test by two different classes.
What can you tell about the classes and their performances from the histograms?
What can you tell about the classes and their performances from the histograms?
Class 2 has fewer members than Class 1. The mean and median for Class 2 should be larger than the mean and median for Class 1, although Class 1 had the highest scorer. Class 1's standard deviation should be greater than that for Class 2.
2
Consider the following box plots for the scores on the same test by two different classes.
What can you tell about the classes and their performances from the box plots?
What can you tell about the classes and their performances from the box plots?
The median for Class 2 is greater than the median for Class 1. The scores for Class 1 are more spread out than those for Class 2. Even though Class 1 had the highest scorer(s), it appears that Class 2 tended to perform better.
3
Below are the histograms for the test scores for two tests (for the same class).
What can you tell about the performances on the two tests from the histograms?
What can you tell about the performances on the two tests from the histograms?
The performance on Test 1 was better, even though there was one score lower than any Test 2 score. The scores were more spread out on Test 1, so its standard deviation should be higher.
4
Below are the box plots for the test scores for two tests (for the same class).
What can you tell about the performances on the two tests from the box plots?
What can you tell about the performances on the two tests from the box plots?
فتح الحزمة
افتح القفل للوصول البطاقات البالغ عددها 8 في هذه المجموعة.
فتح الحزمة
k this deck
5
Below is a scatter plot of the test scores for two unrelated tests by the same students.
A) Are the two variables positively associated or negatively associated? Explain.
B) What might be a reason for that association?
C) Does the Test 1 score cause the Test 2 score?
A) Are the two variables positively associated or negatively associated? Explain.
B) What might be a reason for that association?
C) Does the Test 1 score cause the Test 2 score?
فتح الحزمة
افتح القفل للوصول البطاقات البالغ عددها 8 في هذه المجموعة.
فتح الحزمة
k this deck
6
Sketch a scatter plot of two variables that are clearly negatively associated. Label your axes and give their scales.
فتح الحزمة
افتح القفل للوصول البطاقات البالغ عددها 8 في هذه المجموعة.
فتح الحزمة
k this deck
7
Predict whether the correlation coefficient for each of the following pairs of variables is close to +1, -1, or 0. Explain your answers.
A) the consumption of ice cream and the outside temperature
B) the age of an adult smoker and the number of cigarettes smoked each day
C) the height of an elementary school child and his/her age
D) the mean weight of a Grade 2 class and the number of children in the class
A) the consumption of ice cream and the outside temperature
B) the age of an adult smoker and the number of cigarettes smoked each day
C) the height of an elementary school child and his/her age
D) the mean weight of a Grade 2 class and the number of children in the class
فتح الحزمة
افتح القفل للوصول البطاقات البالغ عددها 8 في هذه المجموعة.
فتح الحزمة
k this deck
8
This rating chart of low-priced CD players is adapted from a Consumer Reports Buying Guide.
A) Make a scatter plot of these data. Choose your scales carefully.
B) Are the two variables positively correlated? Explain how you know.
C) An equation for the line of best fit is y = 0.22x + 49. Use the equation to estimate the cost of a CD with a rating of 100.
A) Make a scatter plot of these data. Choose your scales carefully.
B) Are the two variables positively correlated? Explain how you know.
C) An equation for the line of best fit is y = 0.22x + 49. Use the equation to estimate the cost of a CD with a rating of 100.
فتح الحزمة
افتح القفل للوصول البطاقات البالغ عددها 8 في هذه المجموعة.
فتح الحزمة
k this deck
فتح الحزمة
افتح القفل للوصول البطاقات البالغ عددها 8 في هذه المجموعة.


