Deck 2: Presenting Data, and Central Tendency and Dispersion
ملء الشاشة (f)
سؤال
سؤال
سؤال
The following table represents the number of individuals within a federal prison categorized by race. Which measures of central tendency can you compute? Compute/determine all that are possible.

سؤال
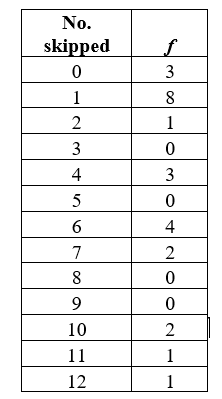
The following represents the results of a survey conducted with 25 high school students indicating the number of times (f) the individual student has skipped class within the past academic year. Which measures of central tendency can you compute? Compute/determine all that are possible. Also indicate whether the distribution is positively or negatively skewed.
سؤال
سؤال
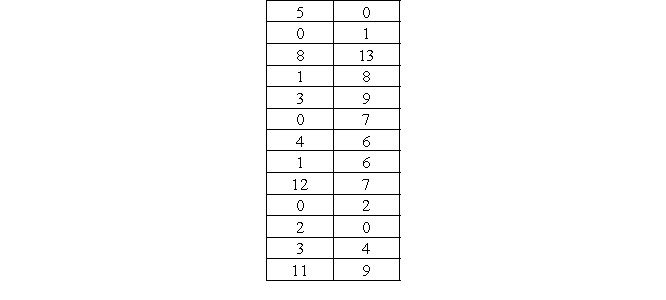
Calculate the mode, median, and mean for the following distribution of scores. Also indicate whether the distribution is positively or negatively skewed.

سؤال
سؤال
سؤال
سؤال
Let's go back to the distribution we utilized in problem 4 (how often students skipped class in the past 12 months). Compute the range, variance, and standard deviation 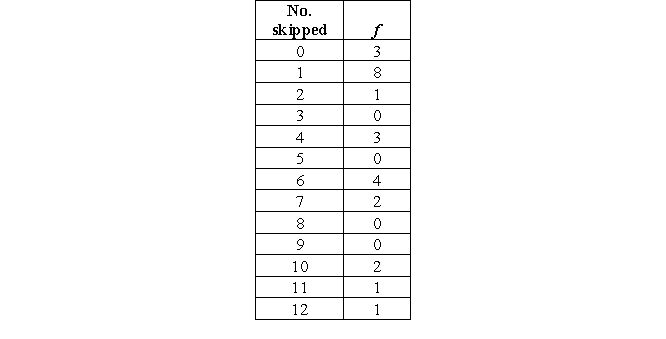 .
.
. سؤال
Let's take the distribution provided in problem 6. Compute the range, variance, and standard deviation.

سؤال
The following is a distribution representing the number of prior convictions of 26 inmates of a local county jail. Compute the range, variance, and standard deviation.
سؤال
سؤال
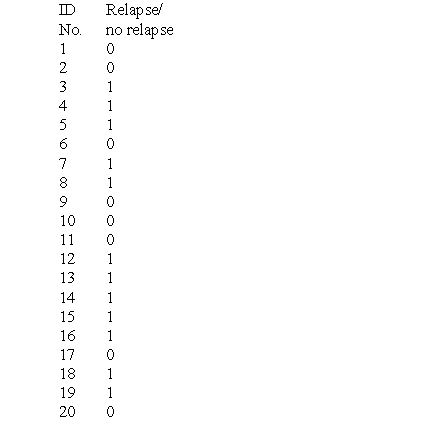
Consider the following dataset, which captures relapse/no-relapse of 20 individuals after treatment within a correctional facility. The data are coded in a way that 0 indicates no relapse and 1 indicates relapse.
a. Indicate how many individuals fall in category 0 and how many in category 1 (counts).
b. Compute the percentages of individuals who did not relapse after treatment in a corrections facility and that of individuals who did relapse.
a. Indicate how many individuals fall in category 0 and how many in category 1 (counts).
b. Compute the percentages of individuals who did not relapse after treatment in a corrections facility and that of individuals who did relapse.
سؤال
The ACME community treatment center is attempting to evaluate the types and amounts of resources and interventions they should provide to their clients. It is known that elderly clients (50+) typically require fewer resources, followed by the middle-aged clients. Finally, younger clients (<30) are more likely to recidivate, which indicates a greater need for more services.
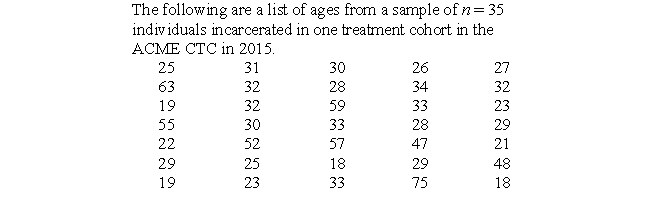
a. Create a grouped frequency distribution of the dataset. Group ages as you feel best suits the dataset. Be sure to include the frequency and the percentage for each grouping.
b. Based on your created frequency distribution, which group should the ACME CTC invest in? Why? Should any other groups be included? Why or why not?

فتح الحزمة
قم بالتسجيل لفتح البطاقات في هذه المجموعة!
Unlock Deck
Unlock Deck
1/15
العب
ملء الشاشة (f)
Deck 2: Presenting Data, and Central Tendency and Dispersion
1
Name the three measures of central tendency and indicate their purpose. Also, determine the level of measurement that is required for the individual measure.
Mode. The mode tells us which category or score occurs most frequently within a distribution. The mode can be determined with variables at the nominal, ordinal, interval, and ratio level.
Median. The median represents the midpoint of a distribution. It can be understood as the point that divides the distribution in two equal parts. The median can be determined with variables at the median, interval, and ratio level of measurement.
Mean. The mean represents the arithmetic average of a distribution. It can be calculated with continuous variables only.
2
In what circumstances would you chose the median over the mean? (Assume the calculation of either is possible.)
In cases where the distribution has outliers that the mean is highly sensitive to.
3
The following table represents the number of individuals within a federal prison categorized by race. Which measures of central tendency can you compute? Compute/determine all that are possible.
The table shows nominal-level data. Therefore, only the mode can be determined.
Mo = the category with the highest frequency = African American.
Mo = the category with the highest frequency = African American.
4
The following represents the results of a survey conducted with 25 high school students indicating the number of times (f) the individual student has skipped class within the past academic year. Which measures of central tendency can you compute? Compute/determine all that are possible. Also indicate whether the distribution is positively or negatively skewed.
فتح الحزمة
افتح القفل للوصول البطاقات البالغ عددها 15 في هذه المجموعة.
فتح الحزمة
k this deck
5
The following table displays how often graduate students at your school (random sample of 50) have used marijuana in their life. Which measures of central tendency can you compute? Compute/determine all that are possible.
فتح الحزمة
افتح القفل للوصول البطاقات البالغ عددها 15 في هذه المجموعة.
فتح الحزمة
k this deck
6
Calculate the mode, median, and mean for the following distribution of scores. Also indicate whether the distribution is positively or negatively skewed.
فتح الحزمة
افتح القفل للوصول البطاقات البالغ عددها 15 في هذه المجموعة.
فتح الحزمة
k this deck
7
Calculate the mode, median, and mean for the following distribution of scores. Also indicate whether the distribution is positively or negatively skewed.
فتح الحزمة
افتح القفل للوصول البطاقات البالغ عددها 15 في هذه المجموعة.
فتح الحزمة
k this deck
8
Indicate the three main measures of dispersion (which were discussed in this chapter) and briefly describe their purpose.
فتح الحزمة
افتح القفل للوصول البطاقات البالغ عددها 15 في هذه المجموعة.
فتح الحزمة
k this deck
9
What is the reason for the denominator in the formula of (sample) variance and (sample) standard deviation to be n - 1 and not simply n?
فتح الحزمة
افتح القفل للوصول البطاقات البالغ عددها 15 في هذه المجموعة.
فتح الحزمة
k this deck
10
Let's go back to the distribution we utilized in problem 4 (how often students skipped class in the past 12 months). Compute the range, variance, and standard deviation .
. فتح الحزمة
افتح القفل للوصول البطاقات البالغ عددها 15 في هذه المجموعة.
فتح الحزمة
k this deck
11
Let's take the distribution provided in problem 6. Compute the range, variance, and standard deviation.
فتح الحزمة
افتح القفل للوصول البطاقات البالغ عددها 15 في هذه المجموعة.
فتح الحزمة
k this deck
12
The following is a distribution representing the number of prior convictions of 26 inmates of a local county jail. Compute the range, variance, and standard deviation.
فتح الحزمة
افتح القفل للوصول البطاقات البالغ عددها 15 في هذه المجموعة.
فتح الحزمة
k this deck
13
You are gathering information about different Master's programs in criminal justice. One thing you want to know is how many students of a cohort drop out each year. The program director of the first school informs you that 45 students dropped out in the previous academic year. The second program you are interested in reports a number of 8 drop-outs in the last academic year.
a. Now consider 879 graduate students are enrolled in program 1, whereas 135 are enrolled in program 2. Does your interpretation change? Report the drop-out rate per 50 students.
b. Calculate the percentage of drop-outs for both programs.
a. Now consider 879 graduate students are enrolled in program 1, whereas 135 are enrolled in program 2. Does your interpretation change? Report the drop-out rate per 50 students.
b. Calculate the percentage of drop-outs for both programs.
فتح الحزمة
افتح القفل للوصول البطاقات البالغ عددها 15 في هذه المجموعة.
فتح الحزمة
k this deck
14
Consider the following dataset, which captures relapse/no-relapse of 20 individuals after treatment within a correctional facility. The data are coded in a way that 0 indicates no relapse and 1 indicates relapse.
a. Indicate how many individuals fall in category 0 and how many in category 1 (counts).
b. Compute the percentages of individuals who did not relapse after treatment in a corrections facility and that of individuals who did relapse.
a. Indicate how many individuals fall in category 0 and how many in category 1 (counts).
b. Compute the percentages of individuals who did not relapse after treatment in a corrections facility and that of individuals who did relapse.
فتح الحزمة
افتح القفل للوصول البطاقات البالغ عددها 15 في هذه المجموعة.
فتح الحزمة
k this deck
15
The ACME community treatment center is attempting to evaluate the types and amounts of resources and interventions they should provide to their clients. It is known that elderly clients (50+) typically require fewer resources, followed by the middle-aged clients. Finally, younger clients (<30) are more likely to recidivate, which indicates a greater need for more services.
a. Create a grouped frequency distribution of the dataset. Group ages as you feel best suits the dataset. Be sure to include the frequency and the percentage for each grouping.
b. Based on your created frequency distribution, which group should the ACME CTC invest in? Why? Should any other groups be included? Why or why not?
فتح الحزمة
افتح القفل للوصول البطاقات البالغ عددها 15 في هذه المجموعة.
فتح الحزمة
k this deck
فتح الحزمة
افتح القفل للوصول البطاقات البالغ عددها 15 في هذه المجموعة.


