Deck 2: Interest Rates and Bond Prices
ملء الشاشة (f)
سؤال
سؤال
Figure 5-1
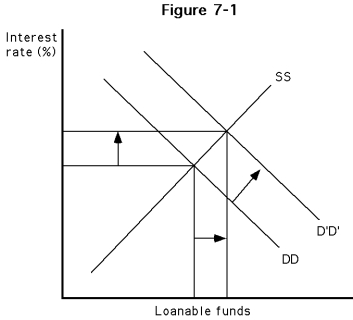
-Which of the following best describes the diagram of Figure 5-1?
A) The demand for loanable funds increased. This, in turn, increased the interest rate and the supply of loanable funds.
B) The demand for loanable funds increased. This, in turn, increased the interest rate and the quantity supplied of loanable funds.
C) The supply of loanable fund increased. In turn, interest rates increased.
D) Interest rates increased, causing the demand of loanable funds to increase.
سؤال
Figure 5-1
-Which of the following occurrences could have generated the phenomena diagrammed in Figure 5-1?
A) a decrease in income
B) an increase in income
C) an increase in money supply
D) a decrease in money supply
-Which of the following occurrences could have generated the phenomena diagrammed in Figure 5-1?
A) a decrease in income
B) an increase in income
C) an increase in money supply
D) a decrease in money supply
سؤال
Figure 5-1
-In which phase of the business cycle would the diagrammed phenomena of Figure 5-1 most likely have occurred?
A) recession
B) expansion
C) trough
D) depression
-In which phase of the business cycle would the diagrammed phenomena of Figure 5-1 most likely have occurred?
A) recession
B) expansion
C) trough
D) depression
سؤال
Figure 5-2
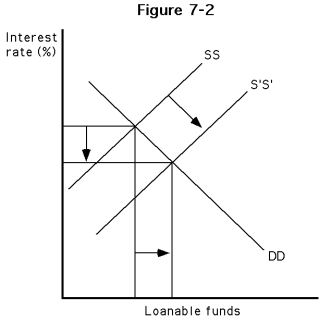
-Which of the following best describes the diagram of Figure 5-2?
A) The demand for loanable funds decreased. This in turn decreased the interest rate and increased the quantity supplied of loanable funds.
B) The supply of loanable funds increased. This in turn increased the interest rate.
C) The supply of loanable funds increased. In turn, interest rates decreased and the quantity demanded of loanable funds increased.
D) The interest rate fell, causing an increase in the supply of loanable funds.
سؤال
Figure 5-2
-In which phase of the business cycle would the diagrammed phenomena of Figure 5-2 most likely have occurred?
A) recession
B) expansion
C) trough
D) depression
-In which phase of the business cycle would the diagrammed phenomena of Figure 5-2 most likely have occurred?
A) recession
B) expansion
C) trough
D) depression
سؤال

فتح الحزمة
قم بالتسجيل لفتح البطاقات في هذه المجموعة!
Unlock Deck
Unlock Deck
1/7
العب
ملء الشاشة (f)
Deck 2: Interest Rates and Bond Prices
1
Assuming an interest rate of 5%, what would the present value be of $4 million to be received in 4 years?
A) $2,468,107.42
B) $2,887,753.24
C) $3,290,809.89
D) $3,469,145.89
A) $2,468,107.42
B) $2,887,753.24
C) $3,290,809.89
D) $3,469,145.89
$3,290,809.89
2
Figure 5-1
-Which of the following best describes the diagram of Figure 5-1?
A) The demand for loanable funds increased. This, in turn, increased the interest rate and the supply of loanable funds.
B) The demand for loanable funds increased. This, in turn, increased the interest rate and the quantity supplied of loanable funds.
C) The supply of loanable fund increased. In turn, interest rates increased.
D) Interest rates increased, causing the demand of loanable funds to increase.
The demand for loanable funds increased. This, in turn, increased the interest rate and the quantity supplied of loanable funds.
3
Figure 5-1
-Which of the following occurrences could have generated the phenomena diagrammed in Figure 5-1?
A) a decrease in income
B) an increase in income
C) an increase in money supply
D) a decrease in money supply
-Which of the following occurrences could have generated the phenomena diagrammed in Figure 5-1?
A) a decrease in income
B) an increase in income
C) an increase in money supply
D) a decrease in money supply
an increase in income
4
Figure 5-1
-In which phase of the business cycle would the diagrammed phenomena of Figure 5-1 most likely have occurred?
A) recession
B) expansion
C) trough
D) depression
-In which phase of the business cycle would the diagrammed phenomena of Figure 5-1 most likely have occurred?
A) recession
B) expansion
C) trough
D) depression
فتح الحزمة
افتح القفل للوصول البطاقات البالغ عددها 7 في هذه المجموعة.
فتح الحزمة
k this deck
5
Figure 5-2
-Which of the following best describes the diagram of Figure 5-2?
A) The demand for loanable funds decreased. This in turn decreased the interest rate and increased the quantity supplied of loanable funds.
B) The supply of loanable funds increased. This in turn increased the interest rate.
C) The supply of loanable funds increased. In turn, interest rates decreased and the quantity demanded of loanable funds increased.
D) The interest rate fell, causing an increase in the supply of loanable funds.
فتح الحزمة
افتح القفل للوصول البطاقات البالغ عددها 7 في هذه المجموعة.
فتح الحزمة
k this deck
6
Figure 5-2
-In which phase of the business cycle would the diagrammed phenomena of Figure 5-2 most likely have occurred?
A) recession
B) expansion
C) trough
D) depression
-In which phase of the business cycle would the diagrammed phenomena of Figure 5-2 most likely have occurred?
A) recession
B) expansion
C) trough
D) depression
فتح الحزمة
افتح القفل للوصول البطاقات البالغ عددها 7 في هذه المجموعة.
فتح الحزمة
k this deck
7
If a bank will pay 7% interest compounded annually on $2,500 deposited today, the depositor will receive how much at the end of 8 years?
A) $3,900.00
B) $3,950.45
C) $4,267.63
D) $4,295.47
A) $3,900.00
B) $3,950.45
C) $4,267.63
D) $4,295.47
فتح الحزمة
افتح القفل للوصول البطاقات البالغ عددها 7 في هذه المجموعة.
فتح الحزمة
k this deck
فتح الحزمة
افتح القفل للوصول البطاقات البالغ عددها 7 في هذه المجموعة.


