Deck 1: Market Failure, Market Efficiency and Welfare
ملء الشاشة (f)
سؤال
Currently Q0 of electrical power is being produced. The demand curve is represented by D, and the current market supply is represented by S0. It is discovered that the Rocky Mountain Electrical Co-op and Power Company is discharging waste into the area water supply. As a result, S1 represents ____ and a price of ____ would represent the true internalized cost of production at that level of output. 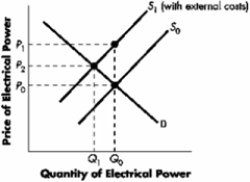
A)the supply curve with external costs included; P2
B)the supply curve with external costs included; P1
C)the supply curve with external costs included; P0
D)There is insufficient information available to provide an accurate answer.
A)the supply curve with external costs included; P2
B)the supply curve with external costs included; P1
C)the supply curve with external costs included; P0
D)There is insufficient information available to provide an accurate answer.
سؤال
?Exhibit
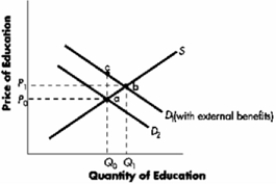
-Refer to Exhibit. Suppose that education provides spillover benefits to the community as illustrated in the diagram. Based on this information, we can say that:
A)the market would exceed short of the desirable level of education, Q0.
B)education is overproduced by Q1 minus Q0 units.
C)the socially optimal quantity of education is Q1 units.
D)the socially optimal quantity of education is Q0 units.
سؤال
سؤال
سؤال
سؤال
سؤال
سؤال
سؤال
سؤال

فتح الحزمة
قم بالتسجيل لفتح البطاقات في هذه المجموعة!
Unlock Deck
Unlock Deck
1/10
العب
ملء الشاشة (f)
Deck 1: Market Failure, Market Efficiency and Welfare
1
Currently Q0 of electrical power is being produced. The demand curve is represented by D, and the current market supply is represented by S0. It is discovered that the Rocky Mountain Electrical Co-op and Power Company is discharging waste into the area water supply. As a result, S1 represents ____ and a price of ____ would represent the true internalized cost of production at that level of output.
A)the supply curve with external costs included; P2
B)the supply curve with external costs included; P1
C)the supply curve with external costs included; P0
D)There is insufficient information available to provide an accurate answer.
A)the supply curve with external costs included; P2
B)the supply curve with external costs included; P1
C)the supply curve with external costs included; P0
D)There is insufficient information available to provide an accurate answer.
the supply curve with external costs included; P2
2
?Exhibit
-Refer to Exhibit. Suppose that education provides spillover benefits to the community as illustrated in the diagram. Based on this information, we can say that:
A)the market would exceed short of the desirable level of education, Q0.
B)education is overproduced by Q1 minus Q0 units.
C)the socially optimal quantity of education is Q1 units.
D)the socially optimal quantity of education is Q0 units.
the socially optimal quantity of education is Q1 units.
3
Factory A can reduce emissions at a cost of $400 per ton. Factory B can reduce emissions at a cost of $100 per ton. In a system in which the government issues transferable pollution right at a price of $200 per ton:
A)Factory A can profit from selling its pollution rights to Factory B.
B)Neither firm can profit from selling its pollution rights to the other.
C)Factory B can profit from selling its pollution rights to Factory A.
D)Both firms have an incentive to sell pollution rights.
A)Factory A can profit from selling its pollution rights to Factory B.
B)Neither firm can profit from selling its pollution rights to the other.
C)Factory B can profit from selling its pollution rights to Factory A.
D)Both firms have an incentive to sell pollution rights.
Factory B can profit from selling its pollution rights to Factory A.
4
Exhibit
-Refer to Exhibit . What would be the total cost if each firm was initially emitting 5 tons of pollution, then the government established a standard of 3 tons maximum pollution per firm in order to decrease pollution by a total of 6 tons?
A)$800
B)$1,050
C)$1,850
D)$2,100
-Refer to Exhibit . What would be the total cost if each firm was initially emitting 5 tons of pollution, then the government established a standard of 3 tons maximum pollution per firm in order to decrease pollution by a total of 6 tons?
A)$800
B)$1,050
C)$1,850
D)$2,100
فتح الحزمة
افتح القفل للوصول البطاقات البالغ عددها 10 في هذه المجموعة.
فتح الحزمة
k this deck
5
Exhibit
-Refer to Exhibit. What would be the total cost if each firm was initially emitting 5 tons of pollution, then the government issued transferable pollution rights allowing a total of 9 tons of pollution in the industry in order to decrease pollution by a total of 6 tons?
A)$1,400
B)$1,700
C)$1,840
D)$3,600
فتح الحزمة
افتح القفل للوصول البطاقات البالغ عددها 10 في هذه المجموعة.
فتح الحزمة
k this deck
6
?Exhibit
Miles demands jazz CDs according to the following demand schedule:
-Refer to Exhibit. If the price of the jazz CDs equals $15, the total consumer surplus Miles receives from purchasing jazz CDs is:
A)$15.
B)$25.
C)$30.
D)$55.
Miles demands jazz CDs according to the following demand schedule:
-Refer to Exhibit. If the price of the jazz CDs equals $15, the total consumer surplus Miles receives from purchasing jazz CDs is:
A)$15.
B)$25.
C)$30.
D)$55.
فتح الحزمة
افتح القفل للوصول البطاقات البالغ عددها 10 في هذه المجموعة.
فتح الحزمة
k this deck
7
?Exhibit
Miles demands jazz CDs according to the following demand schedule:
-Refer to Exhibit. If in the schedule, total consumer surplus equals $5, the market price of a jazz CD is:
A)$10.
B)$15.
C)$20.
D)$25.
Miles demands jazz CDs according to the following demand schedule:
-Refer to Exhibit. If in the schedule, total consumer surplus equals $5, the market price of a jazz CD is:
A)$10.
B)$15.
C)$20.
D)$25.
فتح الحزمة
افتح القفل للوصول البطاقات البالغ عددها 10 في هذه المجموعة.
فتح الحزمة
k this deck
8
?Exhibit
The schedule below shows the prices that a consumer is willing to pay for pounds of shrimp:
-Refer to Exhibit. If the price of shrimp is $12 per pound, according to the schedule total consumer surplus equals:?
A)$8.
B)$12.
C)$14.
D)$36.
The schedule below shows the prices that a consumer is willing to pay for pounds of shrimp:
-Refer to Exhibit. If the price of shrimp is $12 per pound, according to the schedule total consumer surplus equals:?
A)$8.
B)$12.
C)$14.
D)$36.
فتح الحزمة
افتح القفل للوصول البطاقات البالغ عددها 10 في هذه المجموعة.
فتح الحزمة
k this deck
9
?Exhibit
The schedule below represents the willingness of a typical consumer to pay for wine in a year. Suppose there are 10,000 identical consumers in the community.
-Refer to Exhibit. If the market price of wine is $20, the total consumer surplus for the community equals:
A)$20,000.
B)$30,000.
C)$50,000.
D)$60,000.
فتح الحزمة
افتح القفل للوصول البطاقات البالغ عددها 10 في هذه المجموعة.
فتح الحزمة
k this deck
10
?Exhibit
The schedule below represents the willingness of a typical consumer to pay for wine in a year. Suppose there are 10,000 identical consumers in the community.
-Refer to Exhibit. If the market price of wine is $30, the total consumer surplus for the community equals:?
A)$20,000.
B)$30,000.
C)$50,000.
D)$60,000.
فتح الحزمة
افتح القفل للوصول البطاقات البالغ عددها 10 في هذه المجموعة.
فتح الحزمة
k this deck
فتح الحزمة
افتح القفل للوصول البطاقات البالغ عددها 10 في هذه المجموعة.


