Deck 5: Integration
ملء الشاشة (f)
سؤال
Estimate the value of the quantity.
-The table shows the velocity of a remote controlled race car moving along a dirt path for 8 seconds. Estimate the distance traveled by the car using 8 subintervals of length 1 with left-end point values.
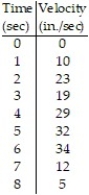
A) 149 in.
B) 318 in.
C) 164 in.
D) 159 in.
-The table shows the velocity of a remote controlled race car moving along a dirt path for 8 seconds. Estimate the distance traveled by the car using 8 subintervals of length 1 with left-end point values.
A) 149 in.
B) 318 in.
C) 164 in.
D) 159 in.
سؤال
Estimate the value of the quantity.
-The table shows the velocity of a remote controlled race car moving along a dirt path for 8 seconds. Estimate the distance traveled by the car using 8 subintervals of length 1 with right-end point values.
A) 142 in.
B) 148 in.
C) 158 in.
D) 152 in.
-The table shows the velocity of a remote controlled race car moving along a dirt path for 8 seconds. Estimate the distance traveled by the car using 8 subintervals of length 1 with right-end point values.
A) 142 in.
B) 148 in.
C) 158 in.
D) 152 in.
سؤال
Estimate the value of the quantity.
-Joe wants to find out how far it is across the lake. His boat has a speedometer but no odometer. The table shows the boats velocity at 10 second intervals. Estimate the distance across the lake using right-end point values.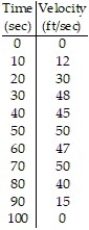
A) 5000 ft
B) 337 ft
C) 3470 ft
D) 3370 ft
-Joe wants to find out how far it is across the lake. His boat has a speedometer but no odometer. The table shows the boats velocity at 10 second intervals. Estimate the distance across the lake using right-end point values.
A) 5000 ft
B) 337 ft
C) 3470 ft
D) 3370 ft
سؤال
Estimate the value of the quantity.
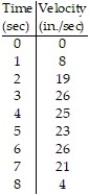
-A piece of tissue paper is picked up in gusty wind. The table shows the velocity of the paper at 2 second intervals. Estimate the distance the paper travelled using left-endpoints.
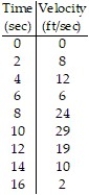
A) 110 ft
B) 200 ft
C) 197 ft
D) 220 ft
-A piece of tissue paper is picked up in gusty wind. The table shows the velocity of the paper at 2 second intervals. Estimate the distance the paper travelled using left-endpoints.
A) 110 ft
B) 200 ft
C) 197 ft
D) 220 ft
سؤال
Estimate the value of the quantity.
-The velocity of a projectile fired straight into the air is given every half second. Use right endpoints to estimate the distance the projectile travelled in four seconds.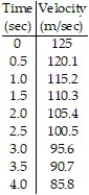
A) 823.6 m
B) 411.8 m
C) 431.4 m
D) 862.8 m
-The velocity of a projectile fired straight into the air is given every half second. Use right endpoints to estimate the distance the projectile travelled in four seconds.
A) 823.6 m
B) 411.8 m
C) 431.4 m
D) 862.8 m
سؤال
Use a finite approximation to estimate the area under the graph of the given function on the stated interval as instructed.
-f(x) = between x = 0 and x = 4 using a left sum with two rectangles of equal width.
A) 20
B) 38.75
C) 8
D) 40
-f(x) =
between x = 0 and x = 4 using a left sum with two rectangles of equal width.A) 20
B) 38.75
C) 8
D) 40
سؤال
Use a finite approximation to estimate the area under the graph of the given function on the stated interval as instructed.
-f(x) = between x = 0 and x = 4 using a right sum with two rectangles of equal width.
A) 40
B) 8
C) 20
D) 38.75
-f(x) =
between x = 0 and x = 4 using a right sum with two rectangles of equal width.A) 40
B) 8
C) 20
D) 38.75
سؤال
Use a finite approximation to estimate the area under the graph of the given function on the stated interval as instructed.
-f(x) = between x = 0 and x = 3 using the midpoint sum with two rectangles of equal width.
A) 16.875
B) 12.5
C) 3.375
D) 8.4375
-f(x) =
between x = 0 and x = 3 using the midpoint sum with two rectangles of equal width.A) 16.875
B) 12.5
C) 3.375
D) 8.4375
سؤال
Use a finite approximation to estimate the area under the graph of the given function on the stated interval as instructed.
-f(x) = between x = 3 and x = 8 using a right sum with two rectangles of equal width.
A) 85/66
B) 45/22
C) 85/176
D) 135/176
-f(x) =
between x = 3 and x = 8 using a right sum with two rectangles of equal width.A) 85/66
B) 45/22
C) 85/176
D) 135/176
سؤال
Use a finite approximation to estimate the area under the graph of the given function on the stated interval as instructed.
-f(x) = between x = 1 and x = 6 using an left sum with two rectangles of equal width.
A) 45/14
B) 15/28
C) 95/14
D) 95/84
-f(x) =
between x = 1 and x = 6 using an left sum with two rectangles of equal width.A) 45/14
B) 15/28
C) 95/14
D) 95/84
سؤال
Use a finite approximation to estimate the area under the graph of the given function on the stated interval as instructed.
-f(x) = between x = 1 and x = 8 using the "midpoint rule" with two rectangles of equal width.
A) 252/275
B) 20888/75625
C) 41776/226875
D) 504/275
-f(x) =
between x = 1 and x = 8 using the "midpoint rule" with two rectangles of equal width.A) 252/275
B) 20888/75625
C) 41776/226875
D) 504/275
سؤال
Use a finite approximation to estimate the area under the graph of the given function on the stated interval as instructed.
-f(x) = between x = 2 and x = 6 using a left sum with four rectangles of equal width.
A) 69
B) 54
C) 86
D) 62
-f(x) =
between x = 2 and x = 6 using a left sum with four rectangles of equal width.A) 69
B) 54
C) 86
D) 62
سؤال
Use a finite approximation to estimate the area under the graph of the given function on the stated interval as instructed.
-f(x) = between x = 4 and x = 8 using a right sum with four rectangles of equal width.
A) 126
B) 149
C) 165
D) 174
-f(x) =
between x = 4 and x = 8 using a right sum with four rectangles of equal width.A) 126
B) 149
C) 165
D) 174
سؤال
Use a finite approximation to estimate the area under the graph of the given function on the stated interval as instructed.
-f(x) = between x = 4 and x = 8 using the midpoint sum with four rectangles of equal width.
A) 174
B) 149
C) 165
D) 126
-f(x) =
between x = 4 and x = 8 using the midpoint sum with four rectangles of equal width.A) 174
B) 149
C) 165
D) 126
سؤال
Use a finite approximation to estimate the area under the graph of the given function on the stated interval as instructed.
-f(x) = 9 - between x = -3 and x = 3 using the midpoint sum with two rectangles of equal width.
A) 13.5
B) 6
C) 40.5
D) 20.25
-f(x) = 9 -
between x = -3 and x = 3 using the midpoint sum with two rectangles of equal width.A) 13.5
B) 6
C) 40.5
D) 20.25
سؤال
Graph the function f(x) over the given interval. Partition the interval into 4 subintervals of equal length. Then add to your sketch the rectangles associated with the Riemann sum ![<strong>Graph the function f(x) over the given interval. Partition the interval into 4 subintervals of equal length. Then add to your sketch the rectangles associated with the Riemann sum , using the indicated point in the kth subinterval for . -f(x) = 2x + 2, [0, 2], left-hand endpoint </strong> A) B) C) D) <div style=padding-top: 35px>](https://d2lvgg3v3hfg70.cloudfront.net/TB9662/11ee9522_3493_76bd_bdb6_0d2821ce9955_TB9662_11.jpg) , using the indicated point in the kth subinterval for
, using the indicated point in the kth subinterval for ![<strong>Graph the function f(x) over the given interval. Partition the interval into 4 subintervals of equal length. Then add to your sketch the rectangles associated with the Riemann sum , using the indicated point in the kth subinterval for . -f(x) = 2x + 2, [0, 2], left-hand endpoint </strong> A) B) C) D) <div style=padding-top: 35px>](https://d2lvgg3v3hfg70.cloudfront.net/TB9662/11ee9522_3493_76be_bdb6_9be4dabc56a0_TB9662_11.jpg) .
.
-f(x) = 2x + 2, [0, 2], left-hand endpoint![<strong>Graph the function f(x) over the given interval. Partition the interval into 4 subintervals of equal length. Then add to your sketch the rectangles associated with the Riemann sum , using the indicated point in the kth subinterval for . -f(x) = 2x + 2, [0, 2], left-hand endpoint </strong> A) B) C) D) <div style=padding-top: 35px>](https://d2lvgg3v3hfg70.cloudfront.net/TB9662/11ee9522_3493_76bf_bdb6_e5c7b61e2f7d_TB9662_11.jpg)
A)
![<strong>Graph the function f(x) over the given interval. Partition the interval into 4 subintervals of equal length. Then add to your sketch the rectangles associated with the Riemann sum , using the indicated point in the kth subinterval for . -f(x) = 2x + 2, [0, 2], left-hand endpoint </strong> A) B) C) D) <div style=padding-top: 35px>](https://d2lvgg3v3hfg70.cloudfront.net/TB9662/11ee9522_3493_76c0_bdb6_9ba40db21000_TB9662_11.jpg)
B)
![<strong>Graph the function f(x) over the given interval. Partition the interval into 4 subintervals of equal length. Then add to your sketch the rectangles associated with the Riemann sum , using the indicated point in the kth subinterval for . -f(x) = 2x + 2, [0, 2], left-hand endpoint </strong> A) B) C) D) <div style=padding-top: 35px>](https://d2lvgg3v3hfg70.cloudfront.net/TB9662/11ee9522_3493_76c1_bdb6_1915e8fe33b4_TB9662_11.jpg)
C)
![<strong>Graph the function f(x) over the given interval. Partition the interval into 4 subintervals of equal length. Then add to your sketch the rectangles associated with the Riemann sum , using the indicated point in the kth subinterval for . -f(x) = 2x + 2, [0, 2], left-hand endpoint </strong> A) B) C) D) <div style=padding-top: 35px>](https://d2lvgg3v3hfg70.cloudfront.net/TB9662/11ee9522_3493_76c2_bdb6_a77ed89b564a_TB9662_11.jpg)
D)
![<strong>Graph the function f(x) over the given interval. Partition the interval into 4 subintervals of equal length. Then add to your sketch the rectangles associated with the Riemann sum , using the indicated point in the kth subinterval for . -f(x) = 2x + 2, [0, 2], left-hand endpoint </strong> A) B) C) D) <div style=padding-top: 35px>](https://d2lvgg3v3hfg70.cloudfront.net/TB9662/11ee9522_3493_76c3_bdb6_d9b9c071b95b_TB9662_11.jpg)
, using the indicated point in the kth subinterval for .-f(x) = 2x + 2, [0, 2], left-hand endpoint
A)
B)
C)
D)
سؤال
Graph the function f(x) over the given interval. Partition the interval into 4 subintervals of equal length. Then add to your sketch the rectangles associated with the Riemann sum , using the indicated point in the kth subinterval for .
-f(x) = -2x - 4, [0, 2], left-hand endpoint
![<strong>Graph the function f(x) over the given interval. Partition the interval into 4 subintervals of equal length. Then add to your sketch the rectangles associated with the Riemann sum , using the indicated point in the kth subinterval for . -f(x) = -2x - 4, [0, 2], left-hand endpoint </strong> A) B) C) D) <div style=padding-top: 35px>](https://d2lvgg3v3hfg70.cloudfront.net/TB9662/11ee9522_3493_9dd4_bdb6_eb93ff5b4465_TB9662_11.jpg)
A)
![<strong>Graph the function f(x) over the given interval. Partition the interval into 4 subintervals of equal length. Then add to your sketch the rectangles associated with the Riemann sum , using the indicated point in the kth subinterval for . -f(x) = -2x - 4, [0, 2], left-hand endpoint </strong> A) B) C) D) <div style=padding-top: 35px>](https://d2lvgg3v3hfg70.cloudfront.net/TB9662/11ee9522_3493_9dd5_bdb6_95a0fe9a2ba8_TB9662_11.jpg)
B)
![<strong>Graph the function f(x) over the given interval. Partition the interval into 4 subintervals of equal length. Then add to your sketch the rectangles associated with the Riemann sum , using the indicated point in the kth subinterval for . -f(x) = -2x - 4, [0, 2], left-hand endpoint </strong> A) B) C) D) <div style=padding-top: 35px>](https://d2lvgg3v3hfg70.cloudfront.net/TB9662/11ee9522_3493_9dd6_bdb6_ffc4aa676aaa_TB9662_11.jpg)
C)
![<strong>Graph the function f(x) over the given interval. Partition the interval into 4 subintervals of equal length. Then add to your sketch the rectangles associated with the Riemann sum , using the indicated point in the kth subinterval for . -f(x) = -2x - 4, [0, 2], left-hand endpoint </strong> A) B) C) D) <div style=padding-top: 35px>](https://d2lvgg3v3hfg70.cloudfront.net/TB9662/11ee9522_3493_9dd7_bdb6_b19c1a23d506_TB9662_11.jpg)
D)
![<strong>Graph the function f(x) over the given interval. Partition the interval into 4 subintervals of equal length. Then add to your sketch the rectangles associated with the Riemann sum , using the indicated point in the kth subinterval for . -f(x) = -2x - 4, [0, 2], left-hand endpoint </strong> A) B) C) D) <div style=padding-top: 35px>](https://d2lvgg3v3hfg70.cloudfront.net/TB9662/11ee9522_3493_9dd8_bdb6_bd0e39e6cdc1_TB9662_11.jpg)
, using the indicated point in the kth subinterval for .-f(x) = -2x - 4, [0, 2], left-hand endpoint
A)
B)
C)
D)
سؤال
Graph the function f(x) over the given interval. Partition the interval into 4 subintervals of equal length. Then add to your sketch the rectangles associated with the Riemann sum , using the indicated point in the kth subinterval for .
-f(x) =![<strong>Graph the function f(x) over the given interval. Partition the interval into 4 subintervals of equal length. Then add to your sketch the rectangles associated with the Riemann sum , using the indicated point in the kth subinterval for . -f(x) = - 2, [0, 8], midpoint </strong> A) B) C) D) <div style=padding-top: 35px>](https://d2lvgg3v3hfg70.cloudfront.net/TB9662/11ee9522_3493_9dd9_bdb6_073a21673e5d_TB9662_11.jpg) - 2, [0, 8], midpoint
- 2, [0, 8], midpoint
![<strong>Graph the function f(x) over the given interval. Partition the interval into 4 subintervals of equal length. Then add to your sketch the rectangles associated with the Riemann sum , using the indicated point in the kth subinterval for . -f(x) = - 2, [0, 8], midpoint </strong> A) B) C) D) <div style=padding-top: 35px>](https://d2lvgg3v3hfg70.cloudfront.net/TB9662/11ee9522_3493_9dda_bdb6_3be2c4813f95_TB9662_11.jpg)
A)
![<strong>Graph the function f(x) over the given interval. Partition the interval into 4 subintervals of equal length. Then add to your sketch the rectangles associated with the Riemann sum , using the indicated point in the kth subinterval for . -f(x) = - 2, [0, 8], midpoint </strong> A) B) C) D) <div style=padding-top: 35px>](https://d2lvgg3v3hfg70.cloudfront.net/TB9662/11ee9522_3493_c4eb_bdb6_e3768a579592_TB9662_11.jpg)
B)
![<strong>Graph the function f(x) over the given interval. Partition the interval into 4 subintervals of equal length. Then add to your sketch the rectangles associated with the Riemann sum , using the indicated point in the kth subinterval for . -f(x) = - 2, [0, 8], midpoint </strong> A) B) C) D) <div style=padding-top: 35px>](https://d2lvgg3v3hfg70.cloudfront.net/TB9662/11ee9522_3493_c4ec_bdb6_b1d2e786e8ae_TB9662_11.jpg)
C)
![<strong>Graph the function f(x) over the given interval. Partition the interval into 4 subintervals of equal length. Then add to your sketch the rectangles associated with the Riemann sum , using the indicated point in the kth subinterval for . -f(x) = - 2, [0, 8], midpoint </strong> A) B) C) D) <div style=padding-top: 35px>](https://d2lvgg3v3hfg70.cloudfront.net/TB9662/11ee9522_3493_c4ed_bdb6_3955971d3851_TB9662_11.jpg)
D)
![<strong>Graph the function f(x) over the given interval. Partition the interval into 4 subintervals of equal length. Then add to your sketch the rectangles associated with the Riemann sum , using the indicated point in the kth subinterval for . -f(x) = - 2, [0, 8], midpoint </strong> A) B) C) D) <div style=padding-top: 35px>](https://d2lvgg3v3hfg70.cloudfront.net/TB9662/11ee9522_3493_c4ee_bdb6_f14f046e338a_TB9662_11.jpg)
, using the indicated point in the kth subinterval for .-f(x) =
- 2, [0, 8], midpoint A)
B)
C)
D)
سؤال
Graph the function f(x) over the given interval. Partition the interval into 4 subintervals of equal length. Then add to your sketch the rectangles associated with the Riemann sum , using the indicated point in the kth subinterval for .
-f(x) =![<strong>Graph the function f(x) over the given interval. Partition the interval into 4 subintervals of equal length. Then add to your sketch the rectangles associated with the Riemann sum , using the indicated point in the kth subinterval for . -f(x) = - 2, [0, 8], left-hand endpoint </strong> A) B) C) D) <div style=padding-top: 35px>](https://d2lvgg3v3hfg70.cloudfront.net/TB9662/11ee9522_3493_c4ef_bdb6_43969f88ff23_TB9662_11.jpg) - 2, [0, 8], left-hand endpoint
- 2, [0, 8], left-hand endpoint
A)
![<strong>Graph the function f(x) over the given interval. Partition the interval into 4 subintervals of equal length. Then add to your sketch the rectangles associated with the Riemann sum , using the indicated point in the kth subinterval for . -f(x) = - 2, [0, 8], left-hand endpoint </strong> A) B) C) D) <div style=padding-top: 35px>](https://d2lvgg3v3hfg70.cloudfront.net/TB9662/11ee9522_3493_ec01_bdb6_734ce9370e9d_TB9662_11.jpg)
B)
![<strong>Graph the function f(x) over the given interval. Partition the interval into 4 subintervals of equal length. Then add to your sketch the rectangles associated with the Riemann sum , using the indicated point in the kth subinterval for . -f(x) = - 2, [0, 8], left-hand endpoint </strong> A) B) C) D) <div style=padding-top: 35px>](https://d2lvgg3v3hfg70.cloudfront.net/TB9662/11ee9522_3493_ec02_bdb6_137b42e3bd44_TB9662_11.jpg)
C)
![<strong>Graph the function f(x) over the given interval. Partition the interval into 4 subintervals of equal length. Then add to your sketch the rectangles associated with the Riemann sum , using the indicated point in the kth subinterval for . -f(x) = - 2, [0, 8], left-hand endpoint </strong> A) B) C) D) <div style=padding-top: 35px>](https://d2lvgg3v3hfg70.cloudfront.net/TB9662/11ee9522_3493_ec03_bdb6_b97e703a95ed_TB9662_11.jpg)
D)
![<strong>Graph the function f(x) over the given interval. Partition the interval into 4 subintervals of equal length. Then add to your sketch the rectangles associated with the Riemann sum , using the indicated point in the kth subinterval for . -f(x) = - 2, [0, 8], left-hand endpoint </strong> A) B) C) D) <div style=padding-top: 35px>](https://d2lvgg3v3hfg70.cloudfront.net/TB9662/11ee9522_3493_ec04_bdb6_41649a8d7b72_TB9662_11.jpg)
, using the indicated point in the kth subinterval for .-f(x) =
- 2, [0, 8], left-hand endpoint A)
B)
C)
D)
سؤال
Graph the function f(x) over the given interval. Partition the interval into 4 subintervals of equal length. Then add to your sketch the rectangles associated with the Riemann sum , using the indicated point in the kth subinterval for .
-f(x) =![<strong>Graph the function f(x) over the given interval. Partition the interval into 4 subintervals of equal length. Then add to your sketch the rectangles associated with the Riemann sum , using the indicated point in the kth subinterval for . -f(x) = - 3, [0, 8], right-hand endpoint </strong> A) B) C) D) <div style=padding-top: 35px>](https://d2lvgg3v3hfg70.cloudfront.net/TB9662/11ee9522_3493_ec05_bdb6_576325502614_TB9662_11.jpg) - 3, [0, 8], right-hand endpoint
- 3, [0, 8], right-hand endpoint
![<strong>Graph the function f(x) over the given interval. Partition the interval into 4 subintervals of equal length. Then add to your sketch the rectangles associated with the Riemann sum , using the indicated point in the kth subinterval for . -f(x) = - 3, [0, 8], right-hand endpoint </strong> A) B) C) D) <div style=padding-top: 35px>](https://d2lvgg3v3hfg70.cloudfront.net/TB9662/11ee9522_3493_ec06_bdb6_c383ce154fb5_TB9662_11.jpg)
A)
![<strong>Graph the function f(x) over the given interval. Partition the interval into 4 subintervals of equal length. Then add to your sketch the rectangles associated with the Riemann sum , using the indicated point in the kth subinterval for . -f(x) = - 3, [0, 8], right-hand endpoint </strong> A) B) C) D) <div style=padding-top: 35px>](https://d2lvgg3v3hfg70.cloudfront.net/TB9662/11ee9522_3493_ec07_bdb6_e727ad45829d_TB9662_11.jpg)
B)
![<strong>Graph the function f(x) over the given interval. Partition the interval into 4 subintervals of equal length. Then add to your sketch the rectangles associated with the Riemann sum , using the indicated point in the kth subinterval for . -f(x) = - 3, [0, 8], right-hand endpoint </strong> A) B) C) D) <div style=padding-top: 35px>](https://d2lvgg3v3hfg70.cloudfront.net/TB9662/11ee9522_3494_1318_bdb6_bf31912758e0_TB9662_11.jpg)
C)
![<strong>Graph the function f(x) over the given interval. Partition the interval into 4 subintervals of equal length. Then add to your sketch the rectangles associated with the Riemann sum , using the indicated point in the kth subinterval for . -f(x) = - 3, [0, 8], right-hand endpoint </strong> A) B) C) D) <div style=padding-top: 35px>](https://d2lvgg3v3hfg70.cloudfront.net/TB9662/11ee9522_3494_1319_bdb6_2bd4871450f9_TB9662_11.jpg)
D)
![<strong>Graph the function f(x) over the given interval. Partition the interval into 4 subintervals of equal length. Then add to your sketch the rectangles associated with the Riemann sum , using the indicated point in the kth subinterval for . -f(x) = - 3, [0, 8], right-hand endpoint </strong> A) B) C) D) <div style=padding-top: 35px>](https://d2lvgg3v3hfg70.cloudfront.net/TB9662/11ee9522_3494_131a_bdb6_cdbef5a9a57f_TB9662_11.jpg)
, using the indicated point in the kth subinterval for .-f(x) =
- 3, [0, 8], right-hand endpoint A)
B)
C)
D)
سؤال
Graph the function f(x) over the given interval. Partition the interval into 4 subintervals of equal length. Then add to your sketch the rectangles associated with the Riemann sum , using the indicated point in the kth subinterval for .
-f(x) = -4![<strong>Graph the function f(x) over the given interval. Partition the interval into 4 subintervals of equal length. Then add to your sketch the rectangles associated with the Riemann sum , using the indicated point in the kth subinterval for . -f(x) = -4 , [0, 4], midpoint </strong> A) B) C) D) <div style=padding-top: 35px>](https://d2lvgg3v3hfg70.cloudfront.net/TB9662/11ee9522_3494_131b_bdb6_d948acc0c079_TB9662_11.jpg) , [0, 4], midpoint
, [0, 4], midpoint
![<strong>Graph the function f(x) over the given interval. Partition the interval into 4 subintervals of equal length. Then add to your sketch the rectangles associated with the Riemann sum , using the indicated point in the kth subinterval for . -f(x) = -4 , [0, 4], midpoint </strong> A) B) C) D) <div style=padding-top: 35px>](https://d2lvgg3v3hfg70.cloudfront.net/TB9662/11ee9522_3494_131c_bdb6_2dfd6a57f1f1_TB9662_11.jpg)
A)
![<strong>Graph the function f(x) over the given interval. Partition the interval into 4 subintervals of equal length. Then add to your sketch the rectangles associated with the Riemann sum , using the indicated point in the kth subinterval for . -f(x) = -4 , [0, 4], midpoint </strong> A) B) C) D) <div style=padding-top: 35px>](https://d2lvgg3v3hfg70.cloudfront.net/TB9662/11ee9522_3494_131d_bdb6_3944ff37ae9f_TB9662_11.jpg)
B)
![<strong>Graph the function f(x) over the given interval. Partition the interval into 4 subintervals of equal length. Then add to your sketch the rectangles associated with the Riemann sum , using the indicated point in the kth subinterval for . -f(x) = -4 , [0, 4], midpoint </strong> A) B) C) D) <div style=padding-top: 35px>](https://d2lvgg3v3hfg70.cloudfront.net/TB9662/11ee9522_3494_131e_bdb6_d9979c4cb935_TB9662_11.jpg)
C)
![<strong>Graph the function f(x) over the given interval. Partition the interval into 4 subintervals of equal length. Then add to your sketch the rectangles associated with the Riemann sum , using the indicated point in the kth subinterval for . -f(x) = -4 , [0, 4], midpoint </strong> A) B) C) D) <div style=padding-top: 35px>](https://d2lvgg3v3hfg70.cloudfront.net/TB9662/11ee9522_3494_3a2f_bdb6_ffd383e01a76_TB9662_11.jpg)
D)
![<strong>Graph the function f(x) over the given interval. Partition the interval into 4 subintervals of equal length. Then add to your sketch the rectangles associated with the Riemann sum , using the indicated point in the kth subinterval for . -f(x) = -4 , [0, 4], midpoint </strong> A) B) C) D) <div style=padding-top: 35px>](https://d2lvgg3v3hfg70.cloudfront.net/TB9662/11ee9522_3494_3a30_bdb6_57e16340e084_TB9662_11.jpg)
, using the indicated point in the kth subinterval for .-f(x) = -4
, [0, 4], midpoint A)
B)
C)
D)
سؤال
Graph the function f(x) over the given interval. Partition the interval into 4 subintervals of equal length. Then add to your sketch the rectangles associated with the Riemann sum , using the indicated point in the kth subinterval for .
-f(x) = -4![<strong>Graph the function f(x) over the given interval. Partition the interval into 4 subintervals of equal length. Then add to your sketch the rectangles associated with the Riemann sum , using the indicated point in the kth subinterval for . -f(x) = -4 , [0, 4], left-hand endpoint </strong> A) B) C) D) <div style=padding-top: 35px>](https://d2lvgg3v3hfg70.cloudfront.net/TB9662/11ee9522_3494_3a31_bdb6_6df46586cdfe_TB9662_11.jpg) , [0, 4], left-hand endpoint
, [0, 4], left-hand endpoint
![<strong>Graph the function f(x) over the given interval. Partition the interval into 4 subintervals of equal length. Then add to your sketch the rectangles associated with the Riemann sum , using the indicated point in the kth subinterval for . -f(x) = -4 , [0, 4], left-hand endpoint </strong> A) B) C) D) <div style=padding-top: 35px>](https://d2lvgg3v3hfg70.cloudfront.net/TB9662/11ee9522_3494_3a32_bdb6_2fac77d8fb54_TB9662_11.jpg)
A)
![<strong>Graph the function f(x) over the given interval. Partition the interval into 4 subintervals of equal length. Then add to your sketch the rectangles associated with the Riemann sum , using the indicated point in the kth subinterval for . -f(x) = -4 , [0, 4], left-hand endpoint </strong> A) B) C) D) <div style=padding-top: 35px>](https://d2lvgg3v3hfg70.cloudfront.net/TB9662/11ee9522_3494_3a33_bdb6_35b34168fd78_TB9662_11.jpg)
B)
![<strong>Graph the function f(x) over the given interval. Partition the interval into 4 subintervals of equal length. Then add to your sketch the rectangles associated with the Riemann sum , using the indicated point in the kth subinterval for . -f(x) = -4 , [0, 4], left-hand endpoint </strong> A) B) C) D) <div style=padding-top: 35px>](https://d2lvgg3v3hfg70.cloudfront.net/TB9662/11ee9522_3494_3a34_bdb6_03a3dfecdc4a_TB9662_11.jpg)
C)
![<strong>Graph the function f(x) over the given interval. Partition the interval into 4 subintervals of equal length. Then add to your sketch the rectangles associated with the Riemann sum , using the indicated point in the kth subinterval for . -f(x) = -4 , [0, 4], left-hand endpoint </strong> A) B) C) D) <div style=padding-top: 35px>](https://d2lvgg3v3hfg70.cloudfront.net/TB9662/11ee9522_3494_6145_bdb6_0d082bd088cd_TB9662_11.jpg)
D)
![<strong>Graph the function f(x) over the given interval. Partition the interval into 4 subintervals of equal length. Then add to your sketch the rectangles associated with the Riemann sum , using the indicated point in the kth subinterval for . -f(x) = -4 , [0, 4], left-hand endpoint </strong> A) B) C) D) <div style=padding-top: 35px>](https://d2lvgg3v3hfg70.cloudfront.net/TB9662/11ee9522_3494_6146_bdb6_7b38df9f368b_TB9662_11.jpg)
, using the indicated point in the kth subinterval for .-f(x) = -4
, [0, 4], left-hand endpoint A)
B)
C)
D)
سؤال
Graph the function f(x) over the given interval. Partition the interval into 4 subintervals of equal length. Then add to your sketch the rectangles associated with the Riemann sum , using the indicated point in the kth subinterval for .
-f(x) = cos x + 2, [0, 2 ], left-hand endpoint
![<strong>Graph the function f(x) over the given interval. Partition the interval into 4 subintervals of equal length. Then add to your sketch the rectangles associated with the Riemann sum , using the indicated point in the kth subinterval for . -f(x) = cos x + 2, [0, 2 \pi ], left-hand endpoint </strong> A) B) C) D) <div style=padding-top: 35px>](https://d2lvgg3v3hfg70.cloudfront.net/TB9662/11ee9522_3494_6147_bdb6_435946a70b0f_TB9662_11.jpg)
A)
![<strong>Graph the function f(x) over the given interval. Partition the interval into 4 subintervals of equal length. Then add to your sketch the rectangles associated with the Riemann sum , using the indicated point in the kth subinterval for . -f(x) = cos x + 2, [0, 2 \pi ], left-hand endpoint </strong> A) B) C) D) <div style=padding-top: 35px>](https://d2lvgg3v3hfg70.cloudfront.net/TB9662/11ee9522_3494_6148_bdb6_33dcba2ec1c1_TB9662_11.jpg)
B)
![<strong>Graph the function f(x) over the given interval. Partition the interval into 4 subintervals of equal length. Then add to your sketch the rectangles associated with the Riemann sum , using the indicated point in the kth subinterval for . -f(x) = cos x + 2, [0, 2 \pi ], left-hand endpoint </strong> A) B) C) D) <div style=padding-top: 35px>](https://d2lvgg3v3hfg70.cloudfront.net/TB9662/11ee9522_3494_6149_bdb6_c7bdea4fc872_TB9662_11.jpg)
C)
![<strong>Graph the function f(x) over the given interval. Partition the interval into 4 subintervals of equal length. Then add to your sketch the rectangles associated with the Riemann sum , using the indicated point in the kth subinterval for . -f(x) = cos x + 2, [0, 2 \pi ], left-hand endpoint </strong> A) B) C) D) <div style=padding-top: 35px>](https://d2lvgg3v3hfg70.cloudfront.net/TB9662/11ee9522_3494_614a_bdb6_d9c505d113b4_TB9662_11.jpg)
D)
![<strong>Graph the function f(x) over the given interval. Partition the interval into 4 subintervals of equal length. Then add to your sketch the rectangles associated with the Riemann sum , using the indicated point in the kth subinterval for . -f(x) = cos x + 2, [0, 2 \pi ], left-hand endpoint </strong> A) B) C) D) <div style=padding-top: 35px>](https://d2lvgg3v3hfg70.cloudfront.net/TB9662/11ee9522_3494_614b_bdb6_b3e56a7023c6_TB9662_11.jpg)
, using the indicated point in the kth subinterval for .-f(x) = cos x + 2, [0, 2 ], left-hand endpoint
A)
B)
C)
D)
سؤال
Graph the function f(x) over the given interval. Partition the interval into 4 subintervals of equal length. Then add to your sketch the rectangles associated with the Riemann sum , using the indicated point in the kth subinterval for .
-f(x) = cos x + 4, [0, 2 ], right-hand endpoint
![<strong>Graph the function f(x) over the given interval. Partition the interval into 4 subintervals of equal length. Then add to your sketch the rectangles associated with the Riemann sum , using the indicated point in the kth subinterval for . -f(x) = cos x + 4, [0, 2 \pi ], right-hand endpoint </strong> A) B) C) D) <div style=padding-top: 35px>](https://d2lvgg3v3hfg70.cloudfront.net/TB9662/11ee9522_3494_885c_bdb6_01224ba82d61_TB9662_11.jpg)
A)
![<strong>Graph the function f(x) over the given interval. Partition the interval into 4 subintervals of equal length. Then add to your sketch the rectangles associated with the Riemann sum , using the indicated point in the kth subinterval for . -f(x) = cos x + 4, [0, 2 \pi ], right-hand endpoint </strong> A) B) C) D) <div style=padding-top: 35px>](https://d2lvgg3v3hfg70.cloudfront.net/TB9662/11ee9522_3494_885d_bdb6_1f7a613510c9_TB9662_11.jpg)
B)
![<strong>Graph the function f(x) over the given interval. Partition the interval into 4 subintervals of equal length. Then add to your sketch the rectangles associated with the Riemann sum , using the indicated point in the kth subinterval for . -f(x) = cos x + 4, [0, 2 \pi ], right-hand endpoint </strong> A) B) C) D) <div style=padding-top: 35px>](https://d2lvgg3v3hfg70.cloudfront.net/TB9662/11ee9522_3494_885e_bdb6_078b99c0051f_TB9662_11.jpg)
C)
![<strong>Graph the function f(x) over the given interval. Partition the interval into 4 subintervals of equal length. Then add to your sketch the rectangles associated with the Riemann sum , using the indicated point in the kth subinterval for . -f(x) = cos x + 4, [0, 2 \pi ], right-hand endpoint </strong> A) B) C) D) <div style=padding-top: 35px>](https://d2lvgg3v3hfg70.cloudfront.net/TB9662/11ee9522_3494_885f_bdb6_714c8e3da8fb_TB9662_11.jpg)
D)
![<strong>Graph the function f(x) over the given interval. Partition the interval into 4 subintervals of equal length. Then add to your sketch the rectangles associated with the Riemann sum , using the indicated point in the kth subinterval for . -f(x) = cos x + 4, [0, 2 \pi ], right-hand endpoint </strong> A) B) C) D) <div style=padding-top: 35px>](https://d2lvgg3v3hfg70.cloudfront.net/TB9662/11ee9522_3494_8860_bdb6_b5a2f10830bc_TB9662_11.jpg)
, using the indicated point in the kth subinterval for .-f(x) = cos x + 4, [0, 2 ], right-hand endpoint
A)
B)
C)
D)
سؤال
Graph the function f(x) over the given interval. Partition the interval into 4 subintervals of equal length. Then add to your sketch the rectangles associated with the Riemann sum , using the indicated point in the kth subinterval for .
-f(x) = cos x + 1, [0, 2 ], midpoint
![<strong>Graph the function f(x) over the given interval. Partition the interval into 4 subintervals of equal length. Then add to your sketch the rectangles associated with the Riemann sum , using the indicated point in the kth subinterval for . -f(x) = cos x + 1, [0, 2 \pi ], midpoint </strong> A) B) C) D) <div style=padding-top: 35px>](https://d2lvgg3v3hfg70.cloudfront.net/TB9662/11ee9522_3494_af71_bdb6_cdbce081d97d_TB9662_11.jpg)
A)
![<strong>Graph the function f(x) over the given interval. Partition the interval into 4 subintervals of equal length. Then add to your sketch the rectangles associated with the Riemann sum , using the indicated point in the kth subinterval for . -f(x) = cos x + 1, [0, 2 \pi ], midpoint </strong> A) B) C) D) <div style=padding-top: 35px>](https://d2lvgg3v3hfg70.cloudfront.net/TB9662/11ee9522_3494_af72_bdb6_4705a6f583b9_TB9662_11.jpg)
B)
![<strong>Graph the function f(x) over the given interval. Partition the interval into 4 subintervals of equal length. Then add to your sketch the rectangles associated with the Riemann sum , using the indicated point in the kth subinterval for . -f(x) = cos x + 1, [0, 2 \pi ], midpoint </strong> A) B) C) D) <div style=padding-top: 35px>](https://d2lvgg3v3hfg70.cloudfront.net/TB9662/11ee9522_3494_af73_bdb6_77bbfe51518b_TB9662_11.jpg)
C)
![<strong>Graph the function f(x) over the given interval. Partition the interval into 4 subintervals of equal length. Then add to your sketch the rectangles associated with the Riemann sum , using the indicated point in the kth subinterval for . -f(x) = cos x + 1, [0, 2 \pi ], midpoint </strong> A) B) C) D) <div style=padding-top: 35px>](https://d2lvgg3v3hfg70.cloudfront.net/TB9662/11ee9522_3494_af74_bdb6_c9de621cee27_TB9662_11.jpg)
D)
![<strong>Graph the function f(x) over the given interval. Partition the interval into 4 subintervals of equal length. Then add to your sketch the rectangles associated with the Riemann sum , using the indicated point in the kth subinterval for . -f(x) = cos x + 1, [0, 2 \pi ], midpoint </strong> A) B) C) D) <div style=padding-top: 35px>](https://d2lvgg3v3hfg70.cloudfront.net/TB9662/11ee9522_3494_af75_bdb6_9b60c82abafe_TB9662_11.jpg)
, using the indicated point in the kth subinterval for .-f(x) = cos x + 1, [0, 2 ], midpoint
A)
B)
C)
D)
سؤال
Express the sum in sigma notation.
-1 - 4 + 16 - 64 + 256
A)
B)

C)

D)

-1 - 4 + 16 - 64 + 256
A)
B)
C)
D)
سؤال
Express the sum in sigma notation.
-5 + 6 + 7 + 8 + 9 + 10
A) + 5
+ 5
B) k
k
C)
D)
-5 + 6 + 7 + 8 + 9 + 10
A)
+ 5B)
kC)
D)
سؤال
Express the sum in sigma notation.
- +
+  +
+  +
+ 
A)
B)
C)
D)
-
+ + + A)
B)
C)
D)
سؤال
Express the sum in sigma notation.
-2 + 4 + 6 + 8 + 10
A)
B)
C)
D)
-2 + 4 + 6 + 8 + 10
A)
B)
C)
D)
سؤال
Express the sum in sigma notation.
-- +
+  -
-  +
+  -
- 
A)
B)
C)
D)
--
+ - + - A)
B)
C)
D)
سؤال
Evaluate the sum.
-
A) 10
B) 110
C) 55
D)
-
A) 10
B) 110
C) 55
D)
سؤال
Evaluate the sum.
-
A) 285
B) 729
C) 2025
D) 900
-
A) 285
B) 729
C) 2025
D) 900
سؤال
Evaluate the sum.
-
A) 132
B) 84
C) 41
D) 140
-
A) 132
B) 84
C) 41
D) 140
سؤال
Evaluate the sum.
-
A) 88
B) 96
C) 84
D) 93
-
A) 88
B) 96
C) 84
D) 93
سؤال
Express the limit as a definite integral.
-![<strong>Express the limit as a definite integral. - \Delta ; [ -3, 5]</strong> A) dx B) dx C) dx D) dx <div style=padding-top: 35px>](https://d2lvgg3v3hfg70.cloudfront.net/TB9662/11ee9522_3495_c00b_bdb6_55cb3e90ac29_TB9662_11.jpg)
![<strong>Express the limit as a definite integral. - \Delta ; [ -3, 5]</strong> A) dx B) dx C) dx D) dx <div style=padding-top: 35px>](https://d2lvgg3v3hfg70.cloudfront.net/TB9662/11ee9522_3495_c00c_bdb6_c7959b1f2737_TB9662_11.jpg)
![<strong>Express the limit as a definite integral. - \Delta ; [ -3, 5]</strong> A) dx B) dx C) dx D) dx <div style=padding-top: 35px>](https://d2lvgg3v3hfg70.cloudfront.net/TB9662/11ee9522_3495_c00d_bdb6_3d49ba700245_TB9662_11.jpg) ; [ -3, 5]
; [ -3, 5]
A)![<strong>Express the limit as a definite integral. - \Delta ; [ -3, 5]</strong> A) dx B) dx C) dx D) dx <div style=padding-top: 35px>](https://d2lvgg3v3hfg70.cloudfront.net/TB9662/11ee9522_3495_c00e_bdb6_33a6ec4f2233_TB9662_11.jpg) dx
dx
B)![<strong>Express the limit as a definite integral. - \Delta ; [ -3, 5]</strong> A) dx B) dx C) dx D) dx <div style=padding-top: 35px>](https://d2lvgg3v3hfg70.cloudfront.net/TB9662/11ee9522_3495_c00f_bdb6_2f2ca437ad35_TB9662_11.jpg) dx
dx
C)![<strong>Express the limit as a definite integral. - \Delta ; [ -3, 5]</strong> A) dx B) dx C) dx D) dx <div style=padding-top: 35px>](https://d2lvgg3v3hfg70.cloudfront.net/TB9662/11ee9522_3495_e720_bdb6_43c8d0aca458_TB9662_11.jpg) dx
dx
D)![<strong>Express the limit as a definite integral. - \Delta ; [ -3, 5]</strong> A) dx B) dx C) dx D) dx <div style=padding-top: 35px>](https://d2lvgg3v3hfg70.cloudfront.net/TB9662/11ee9522_3495_e721_bdb6_d9ea62526ab8_TB9662_11.jpg) dx
dx
-
; [ -3, 5]A)
dxB)
dxC)
dxD)
dx سؤال
Express the limit as a definite integral.
-![<strong>Express the limit as a definite integral. - \Delta ; [ -2, 3]</strong> A) B) C) D) <div style=padding-top: 35px>](https://d2lvgg3v3hfg70.cloudfront.net/TB9662/11ee9522_3495_e722_bdb6_2fb9ee417611_TB9662_11.jpg)
![<strong>Express the limit as a definite integral. - \Delta ; [ -2, 3]</strong> A) B) C) D) <div style=padding-top: 35px>](https://d2lvgg3v3hfg70.cloudfront.net/TB9662/11ee9522_3495_e723_bdb6_356b54616966_TB9662_11.jpg)
![<strong>Express the limit as a definite integral. - \Delta ; [ -2, 3]</strong> A) B) C) D) <div style=padding-top: 35px>](https://d2lvgg3v3hfg70.cloudfront.net/TB9662/11ee9522_3495_e724_bdb6_a76bda579c1c_TB9662_11.jpg) ; [ -2, 3]
; [ -2, 3]
A)![<strong>Express the limit as a definite integral. - \Delta ; [ -2, 3]</strong> A) B) C) D) <div style=padding-top: 35px>](https://d2lvgg3v3hfg70.cloudfront.net/TB9662/11ee9522_3495_e725_bdb6_39a0c53f98bc_TB9662_11.jpg)
B)![<strong>Express the limit as a definite integral. - \Delta ; [ -2, 3]</strong> A) B) C) D) <div style=padding-top: 35px>](https://d2lvgg3v3hfg70.cloudfront.net/TB9662/11ee9522_3495_e726_bdb6_b3ea416f4b16_TB9662_11.jpg)
C)![<strong>Express the limit as a definite integral. - \Delta ; [ -2, 3]</strong> A) B) C) D) <div style=padding-top: 35px>](https://d2lvgg3v3hfg70.cloudfront.net/TB9662/11ee9522_3496_0e37_bdb6_cb12d69abc11_TB9662_11.jpg)
D)![<strong>Express the limit as a definite integral. - \Delta ; [ -2, 3]</strong> A) B) C) D) <div style=padding-top: 35px>](https://d2lvgg3v3hfg70.cloudfront.net/TB9662/11ee9522_3496_0e38_bdb6_2d25b02f53e1_TB9662_11.jpg)
-
; [ -2, 3]A)
B)
C)
D)
سؤال
Express the limit as a definite integral.
-![<strong>Express the limit as a definite integral. - \Delta ; [ 1, 14]</strong> A) B) C) D) <div style=padding-top: 35px>](https://d2lvgg3v3hfg70.cloudfront.net/TB9662/11ee9522_3496_0e39_bdb6_6d142a5f9f3a_TB9662_11.jpg)
![<strong>Express the limit as a definite integral. - \Delta ; [ 1, 14]</strong> A) B) C) D) <div style=padding-top: 35px>](https://d2lvgg3v3hfg70.cloudfront.net/TB9662/11ee9522_3496_0e3a_bdb6_5fd8000c243a_TB9662_11.jpg)
![<strong>Express the limit as a definite integral. - \Delta ; [ 1, 14]</strong> A) B) C) D) <div style=padding-top: 35px>](https://d2lvgg3v3hfg70.cloudfront.net/TB9662/11ee9522_3496_0e3b_bdb6_19ca1e1f2aff_TB9662_11.jpg) ; [ 1, 14]
; [ 1, 14]
A)![<strong>Express the limit as a definite integral. - \Delta ; [ 1, 14]</strong> A) B) C) D) <div style=padding-top: 35px>](https://d2lvgg3v3hfg70.cloudfront.net/TB9662/11ee9522_3496_0e3c_bdb6_3bb8025815d3_TB9662_11.jpg)
B)![<strong>Express the limit as a definite integral. - \Delta ; [ 1, 14]</strong> A) B) C) D) <div style=padding-top: 35px>](https://d2lvgg3v3hfg70.cloudfront.net/TB9662/11ee9522_3496_0e3d_bdb6_63e862eb8855_TB9662_11.jpg)
C)![<strong>Express the limit as a definite integral. - \Delta ; [ 1, 14]</strong> A) B) C) D) <div style=padding-top: 35px>](https://d2lvgg3v3hfg70.cloudfront.net/TB9662/11ee9522_3496_0e3e_bdb6_c3abe1e80d7d_TB9662_11.jpg)
D)![<strong>Express the limit as a definite integral. - \Delta ; [ 1, 14]</strong> A) B) C) D) <div style=padding-top: 35px>](https://d2lvgg3v3hfg70.cloudfront.net/TB9662/11ee9522_3496_354f_bdb6_cd490f3c0347_TB9662_11.jpg)
-
; [ 1, 14]A)
B)
C)
D)
سؤال
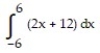
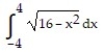
Graph the integrand and use geometry to evaluate the integral.
-
A)
B) 9
C) 5
D) 15
-
A)
B) 9
C) 5
D) 15
سؤال
Graph the integrand and use geometry to evaluate the integral.
-
A) 17
B) 68
C) 136
D) 34
-
A) 17
B) 68
C) 136
D) 34
سؤال
Graph the integrand and use geometry to evaluate the integral.
-
A)
B) 36
C) 72
D) 24
-
A)
B) 36
C) 72
D) 24
سؤال
Graph the integrand and use geometry to evaluate the integral.
-
A) 400
B) 20
C) 100
D) 200
-
A) 400
B) 20
C) 100
D) 200
سؤال
Graph the integrand and use geometry to evaluate the integral.
-
A) 72
B) 24
C) 144
D) 288
-
A) 72
B) 24
C) 144
D) 288
سؤال
Graph the integrand and use geometry to evaluate the integral.
-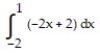
A) 12
B) 9
C) 18
D) 3
-
A) 12
B) 9
C) 18
D) 3
سؤال
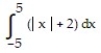
Graph the integrand and use geometry to evaluate the integral.
-
A) 14
B) 42
C) 116
D) 58
-
A) 14
B) 42
C) 116
D) 58
سؤال
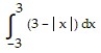
Graph the integrand and use geometry to evaluate the integral.
-
A) 70
B) 45
C) 35
D) 65
-
A) 70
B) 45
C) 35
D) 65
سؤال
Graph the integrand and use geometry to evaluate the integral.
-
A)
B) 18
C) 27
D) 9
-
A)
B) 18
C) 27
D) 9
سؤال
Graph the integrand and use geometry to evaluate the integral.
-
A) 16
B) 16
C) 8
D) 4
-
A) 16
B) 16
C) 8
D) 4
سؤال
Solve the problem.
-Suppose that = -2. Find
  and
and  .
.
A) 0; -2
B) 6; -2
C) -2; 2
D) 0; 2
-Suppose that
= -2. Find and .A) 0; -2
B) 6; -2
C) -2; 2
D) 0; 2
سؤال
Solve the problem.
-Suppose that = -4. Find
  and
and  .
.
A) 9; 4
B) -36; 4
C) -36; -
D) 5 ; -4
-Suppose that
= -4. Find and .A) 9; 4
B) -36; 4
C) -36; -
D) 5 ; -4
سؤال
Solve the problem.
-Suppose that = 10. Find
  and
and  .
.
A) 0; 10
B) 1; -10
C) -1; -10
D) 1; 10
-Suppose that
= 10. Find and .A) 0; 10
B) 1; -10
C) -1; -10
D) 1; 10
سؤال
Solve the problem.
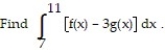
-Suppose that f and g are continuous and that and
and 
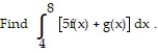
A) 43
B) 35
C) 14
D) -1
-Suppose that f and g are continuous and that
and A) 43
B) 35
C) 14
D) -1
سؤال
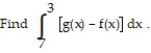
Solve the problem.
-Suppose that f and g are continuous and that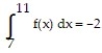 and
and 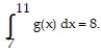
A) 22
B) -30
C) -26
D) -10
-Suppose that f and g are continuous and that
and A) 22
B) -30
C) -26
D) -10
سؤال
Solve the problem.
-Suppose that f and g are continuous and that and
and 
A) 11
B) 7
C) -11
D) -7
-Suppose that f and g are continuous and that
and A) 11
B) 7
C) -11
D) -7
سؤال
Solve the problem.
-Suppose that h is continuous and that = 4 and
 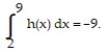 Find
Find  and
and 
A) 13; -13
B) -13; 13
C) 5; -5
D) -5; 5
-Suppose that h is continuous and that
= 4 and Find and A) 13; -13
B) -13; 13
C) 5; -5
D) -5; 5
سؤال
Solve the problem.
-Suppose that g is continuous and that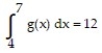 and
and  Find
Find  .
.
A) 26
B) 2
C) -26
D) -2
-Suppose that g is continuous and that
and Find .A) 26
B) 2
C) -26
D) -2
سؤال
Solve the problem.
-Suppose that f is continuous and that and
and  Find
Find  .
.
A) 6
B) -12
C) 12
D) -6
-Suppose that f is continuous and that
and Find .A) 6
B) -12
C) 12
D) -6
سؤال
Solve the problem.
-Suppose that f is continuous and that and
and  Find
Find 
A) -6
B) -3
C) 18
D) -18
-Suppose that f is continuous and that
and Find A) -6
B) -3
C) 18
D) -18
سؤال
Compute the definite integral as the limit of Riemann sums.
-
A)
B) 8
C) -
D)
-
A)
B) 8
C) -
D)
سؤال
Compute the definite integral as the limit of Riemann sums.
- dx
dx
A)
B)
C) 0
D) 27
-
dxA)
B)
C) 0
D) 27
سؤال
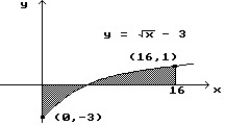
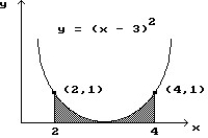
Find the area of the shaded region.
-
A) 7.5
B) 10
C) 5
D) 12.5
-
A) 7.5
B) 10
C) 5
D) 12.5
سؤال
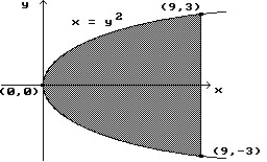
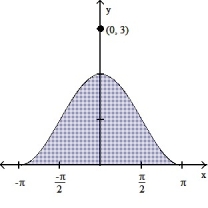
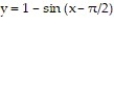
Find the area of the shaded region.
-
A) 25/3
B) 22/3
C) 23/3
D) 26/3
-
A) 25/3
B) 22/3
C) 23/3
D) 26/3
سؤال
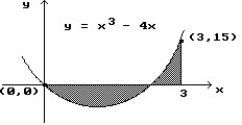
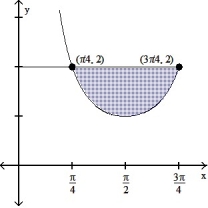
Find the area of the shaded region.
-
A) 5/3
B) 23/3
C) 3
D) 5
-
A) 5/3
B) 23/3
C) 3
D) 5
سؤال
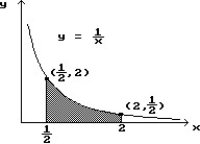
Find the area of the shaded region.
-
A) 22/3
B) 29/3
C) 16/3
D) 38/3
-
A) 22/3
B) 29/3
C) 16/3
D) 38/3
سؤال
Find the area of the shaded region.
-
A) 45
B) 27
C) 18
D) 36
-
A) 45
B) 27
C) 18
D) 36
سؤال
Find the area of the shaded region.
-
A) 17/4
B) 9/4
C) 33/4
D) 41/4
-
A) 17/4
B) 9/4
C) 33/4
D) 41/4
سؤال
Find the area of the shaded region.
-
A) 1.25
B) 1.39
C) 1.69
D) 1.50
-
A) 1.25
B) 1.39
C) 1.69
D) 1.50
سؤال
Find the area of the shaded region.
-
A) 5/3
B) 2/3
C) 1/3
D) 4/3
-
A) 5/3
B) 2/3
C) 1/3
D) 4/3
سؤال
Find the area of the shaded region.
-
A) 2
B)
C) 2
D) 2 + 2
-
A) 2
B)
C) 2
D) 2 + 2
سؤال
Find the area of the shaded region.
-
A) -2
B) + 2
C)
D) 2
-
A) -2
B) + 2
C)
D) 2
سؤال
Evaluate the integral.
- dx
dx
A) 108
B) 18
C) 72
D) 162
-
dxA) 108
B) 18
C) 72
D) 162
سؤال
Evaluate the integral.
- dx
dx
A) 6335
B) 91
C) -1267
D) 1267
-
dxA) 6335
B) 91
C) -1267
D) 1267
سؤال
Evaluate the integral.
-
A) 45
B) 64
C) 255
D)
-
A) 45
B) 64
C) 255
D)
سؤال
Evaluate the integral.
- dx
dx
A) 37/6
B) 5/6
C)15/2
D) 29/6
-
dxA) 37/6
B) 5/6
C)15/2
D) 29/6
سؤال
Evaluate the integral.
-
A) 32
B) 92/5
C) 72/5
D) 77/5
-
A) 32
B) 92/5
C) 72/5
D) 77/5
سؤال
Evaluate the integral.
-
A) 0
B) 1
C) -22
D) 22
-
A) 0
B) 1
C) -22
D) 22
سؤال
Evaluate the integral.
-
A) 18
B) - 36
C) -18
D) 36
-
A) 18
B) - 36
C) -18
D) 36
سؤال
Evaluate the integral.
-
A) -6
B) 0
C) -3
D) 3
-
A) -6
B) 0
C) -3
D) 3
سؤال
Evaluate the integral.
-
A) -10
B) 10
C) 0
D) 5
-
A) -10
B) 10
C) 0
D) 5
سؤال
Evaluate the integral.
-
A) -
- 
B)
C) +
+ 
D) -
-
A)
- B)
C)
+ D) -
سؤال
Evaluate the integral.
-
A) 9/2
B) 9
C) 4
D) 8
-
A) 9/2
B) 9
C) 4
D) 8

فتح الحزمة
قم بالتسجيل لفتح البطاقات في هذه المجموعة!
Unlock Deck
Unlock Deck
1/166
العب
ملء الشاشة (f)
Deck 5: Integration
1
Estimate the value of the quantity.
-The table shows the velocity of a remote controlled race car moving along a dirt path for 8 seconds. Estimate the distance traveled by the car using 8 subintervals of length 1 with left-end point values.
A) 149 in.
B) 318 in.
C) 164 in.
D) 159 in.
-The table shows the velocity of a remote controlled race car moving along a dirt path for 8 seconds. Estimate the distance traveled by the car using 8 subintervals of length 1 with left-end point values.
A) 149 in.
B) 318 in.
C) 164 in.
D) 159 in.
159 in.
2
Estimate the value of the quantity.
-The table shows the velocity of a remote controlled race car moving along a dirt path for 8 seconds. Estimate the distance traveled by the car using 8 subintervals of length 1 with right-end point values.
A) 142 in.
B) 148 in.
C) 158 in.
D) 152 in.
-The table shows the velocity of a remote controlled race car moving along a dirt path for 8 seconds. Estimate the distance traveled by the car using 8 subintervals of length 1 with right-end point values.
A) 142 in.
B) 148 in.
C) 158 in.
D) 152 in.
152 in.
3
Estimate the value of the quantity.
-Joe wants to find out how far it is across the lake. His boat has a speedometer but no odometer. The table shows the boats velocity at 10 second intervals. Estimate the distance across the lake using right-end point values.
A) 5000 ft
B) 337 ft
C) 3470 ft
D) 3370 ft
-Joe wants to find out how far it is across the lake. His boat has a speedometer but no odometer. The table shows the boats velocity at 10 second intervals. Estimate the distance across the lake using right-end point values.
A) 5000 ft
B) 337 ft
C) 3470 ft
D) 3370 ft
3370 ft
4
Estimate the value of the quantity.
-A piece of tissue paper is picked up in gusty wind. The table shows the velocity of the paper at 2 second intervals. Estimate the distance the paper travelled using left-endpoints.
A) 110 ft
B) 200 ft
C) 197 ft
D) 220 ft
-A piece of tissue paper is picked up in gusty wind. The table shows the velocity of the paper at 2 second intervals. Estimate the distance the paper travelled using left-endpoints.
A) 110 ft
B) 200 ft
C) 197 ft
D) 220 ft
فتح الحزمة
افتح القفل للوصول البطاقات البالغ عددها 166 في هذه المجموعة.
فتح الحزمة
k this deck
5
Estimate the value of the quantity.
-The velocity of a projectile fired straight into the air is given every half second. Use right endpoints to estimate the distance the projectile travelled in four seconds.
A) 823.6 m
B) 411.8 m
C) 431.4 m
D) 862.8 m
-The velocity of a projectile fired straight into the air is given every half second. Use right endpoints to estimate the distance the projectile travelled in four seconds.
A) 823.6 m
B) 411.8 m
C) 431.4 m
D) 862.8 m
فتح الحزمة
افتح القفل للوصول البطاقات البالغ عددها 166 في هذه المجموعة.
فتح الحزمة
k this deck
6
Use a finite approximation to estimate the area under the graph of the given function on the stated interval as instructed.
-f(x) = between x = 0 and x = 4 using a left sum with two rectangles of equal width.
A) 20
B) 38.75
C) 8
D) 40
-f(x) =
between x = 0 and x = 4 using a left sum with two rectangles of equal width.A) 20
B) 38.75
C) 8
D) 40
فتح الحزمة
افتح القفل للوصول البطاقات البالغ عددها 166 في هذه المجموعة.
فتح الحزمة
k this deck
7
Use a finite approximation to estimate the area under the graph of the given function on the stated interval as instructed.
-f(x) = between x = 0 and x = 4 using a right sum with two rectangles of equal width.
A) 40
B) 8
C) 20
D) 38.75
-f(x) =
between x = 0 and x = 4 using a right sum with two rectangles of equal width.A) 40
B) 8
C) 20
D) 38.75
فتح الحزمة
افتح القفل للوصول البطاقات البالغ عددها 166 في هذه المجموعة.
فتح الحزمة
k this deck
8
Use a finite approximation to estimate the area under the graph of the given function on the stated interval as instructed.
-f(x) = between x = 0 and x = 3 using the midpoint sum with two rectangles of equal width.
A) 16.875
B) 12.5
C) 3.375
D) 8.4375
-f(x) =
between x = 0 and x = 3 using the midpoint sum with two rectangles of equal width.A) 16.875
B) 12.5
C) 3.375
D) 8.4375
فتح الحزمة
افتح القفل للوصول البطاقات البالغ عددها 166 في هذه المجموعة.
فتح الحزمة
k this deck
9
Use a finite approximation to estimate the area under the graph of the given function on the stated interval as instructed.
-f(x) = between x = 3 and x = 8 using a right sum with two rectangles of equal width.
A) 85/66
B) 45/22
C) 85/176
D) 135/176
-f(x) =
between x = 3 and x = 8 using a right sum with two rectangles of equal width.A) 85/66
B) 45/22
C) 85/176
D) 135/176
فتح الحزمة
افتح القفل للوصول البطاقات البالغ عددها 166 في هذه المجموعة.
فتح الحزمة
k this deck
10
Use a finite approximation to estimate the area under the graph of the given function on the stated interval as instructed.
-f(x) = between x = 1 and x = 6 using an left sum with two rectangles of equal width.
A) 45/14
B) 15/28
C) 95/14
D) 95/84
-f(x) =
between x = 1 and x = 6 using an left sum with two rectangles of equal width.A) 45/14
B) 15/28
C) 95/14
D) 95/84
فتح الحزمة
افتح القفل للوصول البطاقات البالغ عددها 166 في هذه المجموعة.
فتح الحزمة
k this deck
11
Use a finite approximation to estimate the area under the graph of the given function on the stated interval as instructed.
-f(x) = between x = 1 and x = 8 using the "midpoint rule" with two rectangles of equal width.
A) 252/275
B) 20888/75625
C) 41776/226875
D) 504/275
-f(x) =
between x = 1 and x = 8 using the "midpoint rule" with two rectangles of equal width.A) 252/275
B) 20888/75625
C) 41776/226875
D) 504/275
فتح الحزمة
افتح القفل للوصول البطاقات البالغ عددها 166 في هذه المجموعة.
فتح الحزمة
k this deck
12
Use a finite approximation to estimate the area under the graph of the given function on the stated interval as instructed.
-f(x) = between x = 2 and x = 6 using a left sum with four rectangles of equal width.
A) 69
B) 54
C) 86
D) 62
-f(x) =
between x = 2 and x = 6 using a left sum with four rectangles of equal width.A) 69
B) 54
C) 86
D) 62
فتح الحزمة
افتح القفل للوصول البطاقات البالغ عددها 166 في هذه المجموعة.
فتح الحزمة
k this deck
13
Use a finite approximation to estimate the area under the graph of the given function on the stated interval as instructed.
-f(x) = between x = 4 and x = 8 using a right sum with four rectangles of equal width.
A) 126
B) 149
C) 165
D) 174
-f(x) =
between x = 4 and x = 8 using a right sum with four rectangles of equal width.A) 126
B) 149
C) 165
D) 174
فتح الحزمة
افتح القفل للوصول البطاقات البالغ عددها 166 في هذه المجموعة.
فتح الحزمة
k this deck
14
Use a finite approximation to estimate the area under the graph of the given function on the stated interval as instructed.
-f(x) = between x = 4 and x = 8 using the midpoint sum with four rectangles of equal width.
A) 174
B) 149
C) 165
D) 126
-f(x) =
between x = 4 and x = 8 using the midpoint sum with four rectangles of equal width.A) 174
B) 149
C) 165
D) 126
فتح الحزمة
افتح القفل للوصول البطاقات البالغ عددها 166 في هذه المجموعة.
فتح الحزمة
k this deck
15
Use a finite approximation to estimate the area under the graph of the given function on the stated interval as instructed.
-f(x) = 9 - between x = -3 and x = 3 using the midpoint sum with two rectangles of equal width.
A) 13.5
B) 6
C) 40.5
D) 20.25
-f(x) = 9 -
between x = -3 and x = 3 using the midpoint sum with two rectangles of equal width.A) 13.5
B) 6
C) 40.5
D) 20.25
فتح الحزمة
افتح القفل للوصول البطاقات البالغ عددها 166 في هذه المجموعة.
فتح الحزمة
k this deck
16
Graph the function f(x) over the given interval. Partition the interval into 4 subintervals of equal length. Then add to your sketch the rectangles associated with the Riemann sum , using the indicated point in the kth subinterval for .
-f(x) = 2x + 2, [0, 2], left-hand endpoint
A)
B)
C)
D)
, using the indicated point in the kth subinterval for .-f(x) = 2x + 2, [0, 2], left-hand endpoint
A)
B)
C)
D)
فتح الحزمة
افتح القفل للوصول البطاقات البالغ عددها 166 في هذه المجموعة.
فتح الحزمة
k this deck
17
Graph the function f(x) over the given interval. Partition the interval into 4 subintervals of equal length. Then add to your sketch the rectangles associated with the Riemann sum , using the indicated point in the kth subinterval for .
-f(x) = -2x - 4, [0, 2], left-hand endpoint
A)
B)
C)
D)
, using the indicated point in the kth subinterval for .-f(x) = -2x - 4, [0, 2], left-hand endpoint
A)
B)
C)
D)
فتح الحزمة
افتح القفل للوصول البطاقات البالغ عددها 166 في هذه المجموعة.
فتح الحزمة
k this deck
18
Graph the function f(x) over the given interval. Partition the interval into 4 subintervals of equal length. Then add to your sketch the rectangles associated with the Riemann sum , using the indicated point in the kth subinterval for .
-f(x) = - 2, [0, 8], midpoint
A)
B)
C)
D)
, using the indicated point in the kth subinterval for .-f(x) =
- 2, [0, 8], midpoint A)
B)
C)
D)
فتح الحزمة
افتح القفل للوصول البطاقات البالغ عددها 166 في هذه المجموعة.
فتح الحزمة
k this deck
19
Graph the function f(x) over the given interval. Partition the interval into 4 subintervals of equal length. Then add to your sketch the rectangles associated with the Riemann sum , using the indicated point in the kth subinterval for .
-f(x) = - 2, [0, 8], left-hand endpoint
A)
B)
C)
D)
, using the indicated point in the kth subinterval for .-f(x) =
- 2, [0, 8], left-hand endpoint A)
B)
C)
D)
فتح الحزمة
افتح القفل للوصول البطاقات البالغ عددها 166 في هذه المجموعة.
فتح الحزمة
k this deck
20
Graph the function f(x) over the given interval. Partition the interval into 4 subintervals of equal length. Then add to your sketch the rectangles associated with the Riemann sum , using the indicated point in the kth subinterval for .
-f(x) = - 3, [0, 8], right-hand endpoint
A)
B)
C)
D)
, using the indicated point in the kth subinterval for .-f(x) =
- 3, [0, 8], right-hand endpoint A)
B)
C)
D)
فتح الحزمة
افتح القفل للوصول البطاقات البالغ عددها 166 في هذه المجموعة.
فتح الحزمة
k this deck
21
Graph the function f(x) over the given interval. Partition the interval into 4 subintervals of equal length. Then add to your sketch the rectangles associated with the Riemann sum , using the indicated point in the kth subinterval for .
-f(x) = -4 , [0, 4], midpoint
A)
B)
C)
D)
, using the indicated point in the kth subinterval for .-f(x) = -4
, [0, 4], midpoint A)
B)
C)
D)
فتح الحزمة
افتح القفل للوصول البطاقات البالغ عددها 166 في هذه المجموعة.
فتح الحزمة
k this deck
22
Graph the function f(x) over the given interval. Partition the interval into 4 subintervals of equal length. Then add to your sketch the rectangles associated with the Riemann sum , using the indicated point in the kth subinterval for .
-f(x) = -4 , [0, 4], left-hand endpoint
A)
B)
C)
D)
, using the indicated point in the kth subinterval for .-f(x) = -4
, [0, 4], left-hand endpoint A)
B)
C)
D)
فتح الحزمة
افتح القفل للوصول البطاقات البالغ عددها 166 في هذه المجموعة.
فتح الحزمة
k this deck
23
Graph the function f(x) over the given interval. Partition the interval into 4 subintervals of equal length. Then add to your sketch the rectangles associated with the Riemann sum , using the indicated point in the kth subinterval for .
-f(x) = cos x + 2, [0, 2 ], left-hand endpoint
A)
B)
C)
D)
, using the indicated point in the kth subinterval for .-f(x) = cos x + 2, [0, 2 ], left-hand endpoint
A)
B)
C)
D)
فتح الحزمة
افتح القفل للوصول البطاقات البالغ عددها 166 في هذه المجموعة.
فتح الحزمة
k this deck
24
Graph the function f(x) over the given interval. Partition the interval into 4 subintervals of equal length. Then add to your sketch the rectangles associated with the Riemann sum , using the indicated point in the kth subinterval for .
-f(x) = cos x + 4, [0, 2 ], right-hand endpoint
A)
B)
C)
D)
, using the indicated point in the kth subinterval for .-f(x) = cos x + 4, [0, 2 ], right-hand endpoint
A)
B)
C)
D)
فتح الحزمة
افتح القفل للوصول البطاقات البالغ عددها 166 في هذه المجموعة.
فتح الحزمة
k this deck
25
Graph the function f(x) over the given interval. Partition the interval into 4 subintervals of equal length. Then add to your sketch the rectangles associated with the Riemann sum , using the indicated point in the kth subinterval for .
-f(x) = cos x + 1, [0, 2 ], midpoint
A)
B)
C)
D)
, using the indicated point in the kth subinterval for .-f(x) = cos x + 1, [0, 2 ], midpoint
A)
B)
C)
D)
فتح الحزمة
افتح القفل للوصول البطاقات البالغ عددها 166 في هذه المجموعة.
فتح الحزمة
k this deck
26
Express the sum in sigma notation.
-1 - 4 + 16 - 64 + 256
A)
B)
C)
D)
-1 - 4 + 16 - 64 + 256
A)
B)
C)
D)
فتح الحزمة
افتح القفل للوصول البطاقات البالغ عددها 166 في هذه المجموعة.
فتح الحزمة
k this deck
27
Express the sum in sigma notation.
-5 + 6 + 7 + 8 + 9 + 10
A) + 5
B) k
C)
D)
-5 + 6 + 7 + 8 + 9 + 10
A)
+ 5B)
kC)
D)
فتح الحزمة
افتح القفل للوصول البطاقات البالغ عددها 166 في هذه المجموعة.
فتح الحزمة
k this deck
28
Express the sum in sigma notation.
- + + +
A)
B)
C)
D)
-
+ + + A)
B)
C)
D)
فتح الحزمة
افتح القفل للوصول البطاقات البالغ عددها 166 في هذه المجموعة.
فتح الحزمة
k this deck
29
Express the sum in sigma notation.
-2 + 4 + 6 + 8 + 10
A)
B)
C)
D)
-2 + 4 + 6 + 8 + 10
A)
B)
C)
D)
فتح الحزمة
افتح القفل للوصول البطاقات البالغ عددها 166 في هذه المجموعة.
فتح الحزمة
k this deck
30
Express the sum in sigma notation.
-- + - + -
A)
B)
C)
D)
--
+ - + - A)
B)
C)
D)
فتح الحزمة
افتح القفل للوصول البطاقات البالغ عددها 166 في هذه المجموعة.
فتح الحزمة
k this deck
31
Evaluate the sum.
-
A) 10
B) 110
C) 55
D)
-
A) 10
B) 110
C) 55
D)
فتح الحزمة
افتح القفل للوصول البطاقات البالغ عددها 166 في هذه المجموعة.
فتح الحزمة
k this deck
32
Evaluate the sum.
-
A) 285
B) 729
C) 2025
D) 900
-
A) 285
B) 729
C) 2025
D) 900
فتح الحزمة
افتح القفل للوصول البطاقات البالغ عددها 166 في هذه المجموعة.
فتح الحزمة
k this deck
33
Evaluate the sum.
-
A) 132
B) 84
C) 41
D) 140
-
A) 132
B) 84
C) 41
D) 140
فتح الحزمة
افتح القفل للوصول البطاقات البالغ عددها 166 في هذه المجموعة.
فتح الحزمة
k this deck
34
Evaluate the sum.
-
A) 88
B) 96
C) 84
D) 93
-
A) 88
B) 96
C) 84
D) 93
فتح الحزمة
افتح القفل للوصول البطاقات البالغ عددها 166 في هذه المجموعة.
فتح الحزمة
k this deck
35
Express the limit as a definite integral.
- ; [ -3, 5]
A) dx
B) dx
C) dx
D) dx
-
; [ -3, 5]A)
dxB)
dxC)
dxD)
dx فتح الحزمة
افتح القفل للوصول البطاقات البالغ عددها 166 في هذه المجموعة.
فتح الحزمة
k this deck
36
Express the limit as a definite integral.
- ; [ -2, 3]
A)
B)
C)
D)
-
; [ -2, 3]A)
B)
C)
D)
فتح الحزمة
افتح القفل للوصول البطاقات البالغ عددها 166 في هذه المجموعة.
فتح الحزمة
k this deck
37
Express the limit as a definite integral.
- ; [ 1, 14]
A)
B)
C)
D)
-
; [ 1, 14]A)
B)
C)
D)
فتح الحزمة
افتح القفل للوصول البطاقات البالغ عددها 166 في هذه المجموعة.
فتح الحزمة
k this deck
38
Graph the integrand and use geometry to evaluate the integral.
-
A)
B) 9
C) 5
D) 15
-
A)
B) 9
C) 5
D) 15
فتح الحزمة
افتح القفل للوصول البطاقات البالغ عددها 166 في هذه المجموعة.
فتح الحزمة
k this deck
39
Graph the integrand and use geometry to evaluate the integral.
-
A) 17
B) 68
C) 136
D) 34
-
A) 17
B) 68
C) 136
D) 34
فتح الحزمة
افتح القفل للوصول البطاقات البالغ عددها 166 في هذه المجموعة.
فتح الحزمة
k this deck
40
Graph the integrand and use geometry to evaluate the integral.
-
A)
B) 36
C) 72
D) 24
-
A)
B) 36
C) 72
D) 24
فتح الحزمة
افتح القفل للوصول البطاقات البالغ عددها 166 في هذه المجموعة.
فتح الحزمة
k this deck
41
Graph the integrand and use geometry to evaluate the integral.
-
A) 400
B) 20
C) 100
D) 200
-
A) 400
B) 20
C) 100
D) 200
فتح الحزمة
افتح القفل للوصول البطاقات البالغ عددها 166 في هذه المجموعة.
فتح الحزمة
k this deck
42
Graph the integrand and use geometry to evaluate the integral.
-
A) 72
B) 24
C) 144
D) 288
-
A) 72
B) 24
C) 144
D) 288
فتح الحزمة
افتح القفل للوصول البطاقات البالغ عددها 166 في هذه المجموعة.
فتح الحزمة
k this deck
43
Graph the integrand and use geometry to evaluate the integral.
-
A) 12
B) 9
C) 18
D) 3
-
A) 12
B) 9
C) 18
D) 3
فتح الحزمة
افتح القفل للوصول البطاقات البالغ عددها 166 في هذه المجموعة.
فتح الحزمة
k this deck
44
Graph the integrand and use geometry to evaluate the integral.
-
A) 14
B) 42
C) 116
D) 58
-
A) 14
B) 42
C) 116
D) 58
فتح الحزمة
افتح القفل للوصول البطاقات البالغ عددها 166 في هذه المجموعة.
فتح الحزمة
k this deck
45
Graph the integrand and use geometry to evaluate the integral.
-
A) 70
B) 45
C) 35
D) 65
-
A) 70
B) 45
C) 35
D) 65
فتح الحزمة
افتح القفل للوصول البطاقات البالغ عددها 166 في هذه المجموعة.
فتح الحزمة
k this deck
46
Graph the integrand and use geometry to evaluate the integral.
-
A)
B) 18
C) 27
D) 9
-
A)
B) 18
C) 27
D) 9
فتح الحزمة
افتح القفل للوصول البطاقات البالغ عددها 166 في هذه المجموعة.
فتح الحزمة
k this deck
47
Graph the integrand and use geometry to evaluate the integral.
-
A) 16
B) 16
C) 8
D) 4
-
A) 16
B) 16
C) 8
D) 4
فتح الحزمة
افتح القفل للوصول البطاقات البالغ عددها 166 في هذه المجموعة.
فتح الحزمة
k this deck
48
Solve the problem.
-Suppose that = -2. Find and .
A) 0; -2
B) 6; -2
C) -2; 2
D) 0; 2
-Suppose that
= -2. Find and .A) 0; -2
B) 6; -2
C) -2; 2
D) 0; 2
فتح الحزمة
افتح القفل للوصول البطاقات البالغ عددها 166 في هذه المجموعة.
فتح الحزمة
k this deck
49
Solve the problem.
-Suppose that = -4. Find and .
A) 9; 4
B) -36; 4
C) -36; -
D) 5 ; -4
-Suppose that
= -4. Find and .A) 9; 4
B) -36; 4
C) -36; -
D) 5 ; -4
فتح الحزمة
افتح القفل للوصول البطاقات البالغ عددها 166 في هذه المجموعة.
فتح الحزمة
k this deck
50
Solve the problem.
-Suppose that = 10. Find and .
A) 0; 10
B) 1; -10
C) -1; -10
D) 1; 10
-Suppose that
= 10. Find and .A) 0; 10
B) 1; -10
C) -1; -10
D) 1; 10
فتح الحزمة
افتح القفل للوصول البطاقات البالغ عددها 166 في هذه المجموعة.
فتح الحزمة
k this deck
51
Solve the problem.
-Suppose that f and g are continuous and that and
A) 43
B) 35
C) 14
D) -1
-Suppose that f and g are continuous and that
and A) 43
B) 35
C) 14
D) -1
فتح الحزمة
افتح القفل للوصول البطاقات البالغ عددها 166 في هذه المجموعة.
فتح الحزمة
k this deck
52
Solve the problem.
-Suppose that f and g are continuous and that and
A) 22
B) -30
C) -26
D) -10
-Suppose that f and g are continuous and that
and A) 22
B) -30
C) -26
D) -10
فتح الحزمة
افتح القفل للوصول البطاقات البالغ عددها 166 في هذه المجموعة.
فتح الحزمة
k this deck
53
Solve the problem.
-Suppose that f and g are continuous and that and
A) 11
B) 7
C) -11
D) -7
-Suppose that f and g are continuous and that
and A) 11
B) 7
C) -11
D) -7
فتح الحزمة
افتح القفل للوصول البطاقات البالغ عددها 166 في هذه المجموعة.
فتح الحزمة
k this deck
54
Solve the problem.
-Suppose that h is continuous and that = 4 and Find and
A) 13; -13
B) -13; 13
C) 5; -5
D) -5; 5
-Suppose that h is continuous and that
= 4 and Find and A) 13; -13
B) -13; 13
C) 5; -5
D) -5; 5
فتح الحزمة
افتح القفل للوصول البطاقات البالغ عددها 166 في هذه المجموعة.
فتح الحزمة
k this deck
55
Solve the problem.
-Suppose that g is continuous and that and Find .
A) 26
B) 2
C) -26
D) -2
-Suppose that g is continuous and that
and Find .A) 26
B) 2
C) -26
D) -2
فتح الحزمة
افتح القفل للوصول البطاقات البالغ عددها 166 في هذه المجموعة.
فتح الحزمة
k this deck
56
Solve the problem.
-Suppose that f is continuous and that and Find .
A) 6
B) -12
C) 12
D) -6
-Suppose that f is continuous and that
and Find .A) 6
B) -12
C) 12
D) -6
فتح الحزمة
افتح القفل للوصول البطاقات البالغ عددها 166 في هذه المجموعة.
فتح الحزمة
k this deck
57
Solve the problem.
-Suppose that f is continuous and that and Find
A) -6
B) -3
C) 18
D) -18
-Suppose that f is continuous and that
and Find A) -6
B) -3
C) 18
D) -18
فتح الحزمة
افتح القفل للوصول البطاقات البالغ عددها 166 في هذه المجموعة.
فتح الحزمة
k this deck
58
Compute the definite integral as the limit of Riemann sums.
-
A)
B) 8
C) -
D)
-
A)
B) 8
C) -
D)
فتح الحزمة
افتح القفل للوصول البطاقات البالغ عددها 166 في هذه المجموعة.
فتح الحزمة
k this deck
59
Compute the definite integral as the limit of Riemann sums.
- dx
A)
B)
C) 0
D) 27
-
dxA)
B)
C) 0
D) 27
فتح الحزمة
افتح القفل للوصول البطاقات البالغ عددها 166 في هذه المجموعة.
فتح الحزمة
k this deck
60
Find the area of the shaded region.
-
A) 7.5
B) 10
C) 5
D) 12.5
-
A) 7.5
B) 10
C) 5
D) 12.5
فتح الحزمة
افتح القفل للوصول البطاقات البالغ عددها 166 في هذه المجموعة.
فتح الحزمة
k this deck
61
Find the area of the shaded region.
-
A) 25/3
B) 22/3
C) 23/3
D) 26/3
-
A) 25/3
B) 22/3
C) 23/3
D) 26/3
فتح الحزمة
افتح القفل للوصول البطاقات البالغ عددها 166 في هذه المجموعة.
فتح الحزمة
k this deck
62
Find the area of the shaded region.
-
A) 5/3
B) 23/3
C) 3
D) 5
-
A) 5/3
B) 23/3
C) 3
D) 5
فتح الحزمة
افتح القفل للوصول البطاقات البالغ عددها 166 في هذه المجموعة.
فتح الحزمة
k this deck
63
Find the area of the shaded region.
-
A) 22/3
B) 29/3
C) 16/3
D) 38/3
-
A) 22/3
B) 29/3
C) 16/3
D) 38/3
فتح الحزمة
افتح القفل للوصول البطاقات البالغ عددها 166 في هذه المجموعة.
فتح الحزمة
k this deck
64
Find the area of the shaded region.
-
A) 45
B) 27
C) 18
D) 36
-
A) 45
B) 27
C) 18
D) 36
فتح الحزمة
افتح القفل للوصول البطاقات البالغ عددها 166 في هذه المجموعة.
فتح الحزمة
k this deck
65
Find the area of the shaded region.
-
A) 17/4
B) 9/4
C) 33/4
D) 41/4
-
A) 17/4
B) 9/4
C) 33/4
D) 41/4
فتح الحزمة
افتح القفل للوصول البطاقات البالغ عددها 166 في هذه المجموعة.
فتح الحزمة
k this deck
66
Find the area of the shaded region.
-
A) 1.25
B) 1.39
C) 1.69
D) 1.50
-
A) 1.25
B) 1.39
C) 1.69
D) 1.50
فتح الحزمة
افتح القفل للوصول البطاقات البالغ عددها 166 في هذه المجموعة.
فتح الحزمة
k this deck
67
Find the area of the shaded region.
-
A) 5/3
B) 2/3
C) 1/3
D) 4/3
-
A) 5/3
B) 2/3
C) 1/3
D) 4/3
فتح الحزمة
افتح القفل للوصول البطاقات البالغ عددها 166 في هذه المجموعة.
فتح الحزمة
k this deck
68
Find the area of the shaded region.
-
A) 2
B)
C) 2
D) 2 + 2
-
A) 2
B)
C) 2
D) 2 + 2
فتح الحزمة
افتح القفل للوصول البطاقات البالغ عددها 166 في هذه المجموعة.
فتح الحزمة
k this deck
69
Find the area of the shaded region.
-
A) -2
B) + 2
C)
D) 2
-
A) -2
B) + 2
C)
D) 2
فتح الحزمة
افتح القفل للوصول البطاقات البالغ عددها 166 في هذه المجموعة.
فتح الحزمة
k this deck
70
Evaluate the integral.
- dx
A) 108
B) 18
C) 72
D) 162
-
dxA) 108
B) 18
C) 72
D) 162
فتح الحزمة
افتح القفل للوصول البطاقات البالغ عددها 166 في هذه المجموعة.
فتح الحزمة
k this deck
71
Evaluate the integral.
- dx
A) 6335
B) 91
C) -1267
D) 1267
-
dxA) 6335
B) 91
C) -1267
D) 1267
فتح الحزمة
افتح القفل للوصول البطاقات البالغ عددها 166 في هذه المجموعة.
فتح الحزمة
k this deck
72
Evaluate the integral.
-
A) 45
B) 64
C) 255
D)
-
A) 45
B) 64
C) 255
D)
فتح الحزمة
افتح القفل للوصول البطاقات البالغ عددها 166 في هذه المجموعة.
فتح الحزمة
k this deck
73
Evaluate the integral.
- dx
A) 37/6
B) 5/6
C)15/2
D) 29/6
-
dxA) 37/6
B) 5/6
C)15/2
D) 29/6
فتح الحزمة
افتح القفل للوصول البطاقات البالغ عددها 166 في هذه المجموعة.
فتح الحزمة
k this deck
74
Evaluate the integral.
-
A) 32
B) 92/5
C) 72/5
D) 77/5
-
A) 32
B) 92/5
C) 72/5
D) 77/5
فتح الحزمة
افتح القفل للوصول البطاقات البالغ عددها 166 في هذه المجموعة.
فتح الحزمة
k this deck
75
Evaluate the integral.
-
A) 0
B) 1
C) -22
D) 22
-
A) 0
B) 1
C) -22
D) 22
فتح الحزمة
افتح القفل للوصول البطاقات البالغ عددها 166 في هذه المجموعة.
فتح الحزمة
k this deck
76
Evaluate the integral.
-
A) 18
B) - 36
C) -18
D) 36
-
A) 18
B) - 36
C) -18
D) 36
فتح الحزمة
افتح القفل للوصول البطاقات البالغ عددها 166 في هذه المجموعة.
فتح الحزمة
k this deck
77
Evaluate the integral.
-
A) -6
B) 0
C) -3
D) 3
-
A) -6
B) 0
C) -3
D) 3
فتح الحزمة
افتح القفل للوصول البطاقات البالغ عددها 166 في هذه المجموعة.
فتح الحزمة
k this deck
78
Evaluate the integral.
-
A) -10
B) 10
C) 0
D) 5
-
A) -10
B) 10
C) 0
D) 5
فتح الحزمة
افتح القفل للوصول البطاقات البالغ عددها 166 في هذه المجموعة.
فتح الحزمة
k this deck
79
Evaluate the integral.
-
A) -
B)
C) +
D) -
-
A)
- B)
C)
+ D) -
فتح الحزمة
افتح القفل للوصول البطاقات البالغ عددها 166 في هذه المجموعة.
فتح الحزمة
k this deck
80
Evaluate the integral.
-
A) 9/2
B) 9
C) 4
D) 8
-
A) 9/2
B) 9
C) 4
D) 8
فتح الحزمة
افتح القفل للوصول البطاقات البالغ عددها 166 في هذه المجموعة.
فتح الحزمة
k this deck
فتح الحزمة
افتح القفل للوصول البطاقات البالغ عددها 166 في هذه المجموعة.


