Deck 7: Pure Competition
ملء الشاشة (f)
سؤال
سؤال
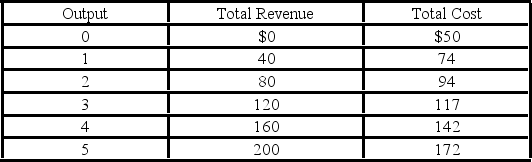
Given the table below, what is the short-run profit-maximizing level of output for the firm? 
A) 2 units
B) 3 units
C) 4 units
D) 5 units
A) 2 units
B) 3 units
C) 4 units
D) 5 units
سؤال
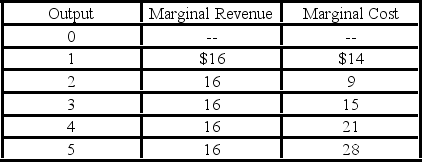
 Refer to the above table. The marginal cost of the third unit of output is:
A) $20.
B) $23.
C) $24.
D) $25.
سؤال
 Refer to the above data. At the profit-maximizing output, the firm's total revenue is:
A) $48.
B) $38.
C) $80.
D) $64.
سؤال
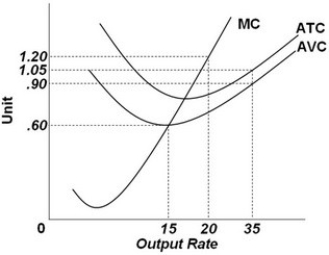 Refer to the above graph. It shows the cost curves for a competitive firm. At output level 20, the marginal cost is:
A) $0.60.
B) $0.90.
C) $1.05.
D) $1.20.
سؤال
 The graph above represents a(n):
A) decreasing-cost industry: firms may be paying lower prices for their inputs when the industry expands.
B) increasing-cost industry: firms may be paying higher prices for their inputs when the industry expands.
C) competitive, break-even industry: the long-run supply curve is upward sloping as it must be according to the law of supply.
D) constant-cost industry: prices of the inputs stay the same, and other production costs are constant as the industry expands.

فتح الحزمة
قم بالتسجيل لفتح البطاقات في هذه المجموعة!
Unlock Deck
Unlock Deck
1/6
العب
ملء الشاشة (f)
Deck 7: Pure Competition
1
Total revenue for a perfectly competitive firm producing six units of output is $48. Total revenue for producing eight units of output is $64. Given this information, the:
A) firm should raise its price.
B) average revenue for producing eight units is $16.
C) marginal revenue for producing the eighth unit is $16.
D) marginal revenue for producing the eighth unit is $8.
A) firm should raise its price.
B) average revenue for producing eight units is $16.
C) marginal revenue for producing the eighth unit is $16.
D) marginal revenue for producing the eighth unit is $8.
marginal revenue for producing the eighth unit is $8.
2
Given the table below, what is the short-run profit-maximizing level of output for the firm?
A) 2 units
B) 3 units
C) 4 units
D) 5 units
A) 2 units
B) 3 units
C) 4 units
D) 5 units
4 units
3
Refer to the above table. The marginal cost of the third unit of output is:A) $20.
B) $23.
C) $24.
D) $25.
$23.
4
Refer to the above data. At the profit-maximizing output, the firm's total revenue is:A) $48.
B) $38.
C) $80.
D) $64.
فتح الحزمة
افتح القفل للوصول البطاقات البالغ عددها 6 في هذه المجموعة.
فتح الحزمة
k this deck
5
Refer to the above graph. It shows the cost curves for a competitive firm. At output level 20, the marginal cost is:A) $0.60.
B) $0.90.
C) $1.05.
D) $1.20.
فتح الحزمة
افتح القفل للوصول البطاقات البالغ عددها 6 في هذه المجموعة.
فتح الحزمة
k this deck
6
The graph above represents a(n):A) decreasing-cost industry: firms may be paying lower prices for their inputs when the industry expands.
B) increasing-cost industry: firms may be paying higher prices for their inputs when the industry expands.
C) competitive, break-even industry: the long-run supply curve is upward sloping as it must be according to the law of supply.
D) constant-cost industry: prices of the inputs stay the same, and other production costs are constant as the industry expands.
فتح الحزمة
افتح القفل للوصول البطاقات البالغ عددها 6 في هذه المجموعة.
فتح الحزمة
k this deck
فتح الحزمة
افتح القفل للوصول البطاقات البالغ عددها 6 في هذه المجموعة.


