Deck 2: Basic Descriptive Statistics: Percentages, Ratios and Rates, Tables, Charts, and Graphs
ملء الشاشة (f)
سؤال
سؤال
سؤال
سؤال
سؤال
سؤال
سؤال
سؤال
سؤال
سؤال
سؤال
سؤال
سؤال
سؤال
سؤال
Table 2.1 Age of Respondents
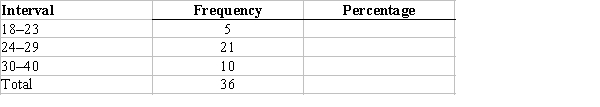
-According to Table 2.1, what is the width of each interval if 60 cases range in score from 4 to 84, and 10 intervals in a frequency distribution are wanted?
A) approximately 4
B) approximately 8
C) approximately 12
D) approximately 60
-According to Table 2.1, what is the width of each interval if 60 cases range in score from 4 to 84, and 10 intervals in a frequency distribution are wanted?
A) approximately 4
B) approximately 8
C) approximately 12
D) approximately 60
سؤال
سؤال
سؤال
سؤال
سؤال
سؤال
سؤال
سؤال
سؤال
سؤال
Table 2.2 Number of Prior Convictions among Inmates at a Prison
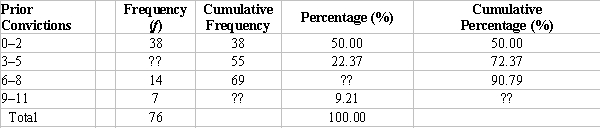
-In Table 2.2, what is the ratio of people with 0-2 prior convictions to those with 9-11?
A) 0.18
B) 5.43
C) 10.86
D) 76.38
-In Table 2.2, what is the ratio of people with 0-2 prior convictions to those with 9-11?
A) 0.18
B) 5.43
C) 10.86
D) 76.38
سؤال
Table 2.2 Number of Prior Convictions among Inmates at a Prison
-In Table 2.2, what percentage of cases are in the 6-8 prior conviction group?
A) (76/14) = 5.43%
B) (14/76) × 100 = 18.42%
C) (14/69) × 100 = 20.29%
D) (69/76) × 100 = 90.79%
-In Table 2.2, what percentage of cases are in the 6-8 prior conviction group?
A) (76/14) = 5.43%
B) (14/76) × 100 = 18.42%
C) (14/69) × 100 = 20.29%
D) (69/76) × 100 = 90.79%
سؤال
Table 2.2 Number of Prior Convictions among Inmates at a Prison
-In Table 2.2, what would be the value for the cumulative percentage corresponding to the 9-11 prior conviction group?
A) 9.21%
B) 27.63%
C) 50%
D) 100%
-In Table 2.2, what would be the value for the cumulative percentage corresponding to the 9-11 prior conviction group?
A) 9.21%
B) 27.63%
C) 50%
D) 100%
سؤال
Table 2.2 Number of Prior Convictions among Inmates at a Prison
-In Table 2.2, what is the frequency value corresponding to the 3-5 prior conviction group?
A) 69
B) 59
C) 49
D) 17
-In Table 2.2, what is the frequency value corresponding to the 3-5 prior conviction group?
A) 69
B) 59
C) 49
D) 17
سؤال
Table 2.2 Number of Prior Convictions among Inmates at a Prison
-In Table 2.2, fill in the missing value in the cumulative frequency column.
A) 7
B) 11
C) 76
D) 100
-In Table 2.2, fill in the missing value in the cumulative frequency column.
A) 7
B) 11
C) 76
D) 100
سؤال
Table 2.2 Number of Prior Convictions among Inmates at a Prison
-Which of the following best characterizes the values in the prior convictions column in Table 2.2.
A) unequal intervals
B) stated limits
C) real limits
D) proportions
-Which of the following best characterizes the values in the prior convictions column in Table 2.2.
A) unequal intervals
B) stated limits
C) real limits
D) proportions
سؤال
Table 2.2 Number of Prior Convictions among Inmates at a Prison
-What would be an ideal graph to represent the data shown in Table 2.2?
A) frequency polygon
B) pie chart
C) bar chart
D) rate graph
-What would be an ideal graph to represent the data shown in Table 2.2?
A) frequency polygon
B) pie chart
C) bar chart
D) rate graph
سؤال
سؤال
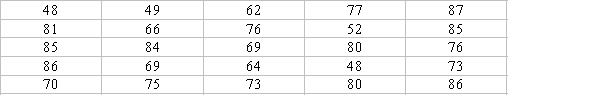
Below are skills test scores for applicants of a software engineering job. Put the data into a frequency distribution using intervals of size 8. Include columns for percentages and cumulative percentages.
سؤال
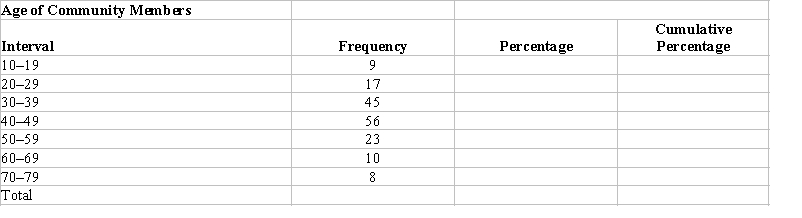
The frequency distribution below displays the distribution of age for a sample drawn from a community. Finish the table by completing the columns for percentages and cumulative percentages.

فتح الحزمة
قم بالتسجيل لفتح البطاقات في هذه المجموعة!
Unlock Deck
Unlock Deck
1/34
العب
ملء الشاشة (f)
Deck 2: Basic Descriptive Statistics: Percentages, Ratios and Rates, Tables, Charts, and Graphs
1
How is a proportion calculated?
A) The number of cases in any category (f) is divided by the number of cases in all categories (n).
B) The number of cases in any category (f) is divided by the cases in that category (f).
C) The number of cases in any category (f) is divided by the number of cases in adjacent categories (k-1).
D) The number of cases in any category (f) is divided by the total number of categories (k).
The number of cases in any category (f) is divided by the number of cases in all categories (n).
2
An environmental scientist reports that the proportion of lakes in a region that are contaminated by pollution is 0.28. How would this value be written as a percentage?
A) 0.28 × 1,000 = 280
B) 0.28 × 100 = 28
C) 0.28 × 10 = 2.8
D) 0.28 × 1 = 0.28
A) 0.28 × 1,000 = 280
B) 0.28 × 100 = 28
C) 0.28 × 10 = 2.8
D) 0.28 × 1 = 0.28
0.28 × 100 = 28
3
What is the sum of the proportions for all categories of a variable?
A) 100.00
B) 10.00
C) 1.00
D) 0.10
A) 100.00
B) 10.00
C) 1.00
D) 0.10
1.00
4
Which of the following is preferred for reporting when working with a very small number of cases?
A) proportions
B) fractions
C) percentages
D) actual frequencies
A) proportions
B) fractions
C) percentages
D) actual frequencies
فتح الحزمة
افتح القفل للوصول البطاقات البالغ عددها 34 في هذه المجموعة.
فتح الحزمة
k this deck
5
A company has 8 entry-level workers and 4 managers. What is the ratio of managers to entry-level workers?
A) 4 to 12
B) 1 to 2
C) 2 to 1
D) 30%
A) 4 to 12
B) 1 to 2
C) 2 to 1
D) 30%
فتح الحزمة
افتح القفل للوصول البطاقات البالغ عددها 34 في هذه المجموعة.
فتح الحزمة
k this deck
6
Which of the following explains how to determine the ratio of smokers to non-smokers in a population?
A) Add them together and divide by the number of smokers.
B) Divide the number of non-smokers by the number of smokers.
C) Divide the number of smokers by the number of non-smokers.
D) Multiply the number of smokers by the total number of people.
A) Add them together and divide by the number of smokers.
B) Divide the number of non-smokers by the number of smokers.
C) Divide the number of smokers by the number of non-smokers.
D) Multiply the number of smokers by the total number of people.
فتح الحزمة
افتح القفل للوصول البطاقات البالغ عددها 34 في هذه المجموعة.
فتح الحزمة
k this deck
7
Suppose a city experiences 75 suicides in a year, and its population is 250,000. What is the correct way to calculate its suicide rate?
A) suicide rate = (75/250,075) × 1,000
B) suicide rate = (250,000 × 1,000)/75
C) suicide rate = (75/250,000) × 1,000
D) suicide rate = (1,000 × 75) × 0.50
A) suicide rate = (75/250,075) × 1,000
B) suicide rate = (250,000 × 1,000)/75
C) suicide rate = (75/250,000) × 1,000
D) suicide rate = (1,000 × 75) × 0.50
فتح الحزمة
افتح القفل للوصول البطاقات البالغ عددها 34 في هذه المجموعة.
فتح الحزمة
k this deck
8
City A, with a population of 1,567 people, had 34 auto thefts last year. City B, with a population of 34,567, had 40 auto thefts in the same time period. City C, with a population of 156,980, had 70 auto thefts. City D, with a population of 900,880, had 305 auto thefts. Which city had the highest rate of auto thefts?
A) City A
B) City B
C) City C
D) City D
A) City A
B) City B
C) City C
D) City D
فتح الحزمة
افتح القفل للوصول البطاقات البالغ عددها 34 في هذه المجموعة.
فتح الحزمة
k this deck
9
The intervals below represent ages of respondents. Which set of intervals is both exhaustive and mutually exclusive?
A) 18-19, 19-20, 20-21
B) 18-19, 20-21, 22-23
C) 18-19, 21-22, 24-25
D) 18-20, 22-24, 26-28
A) 18-19, 19-20, 20-21
B) 18-19, 20-21, 22-23
C) 18-19, 21-22, 24-25
D) 18-20, 22-24, 26-28
فتح الحزمة
افتح القفل للوصول البطاقات البالغ عددها 34 في هذه المجموعة.
فتح الحزمة
k this deck
10
What percentage value corresponds to a ratio of f1/f2 = 120/120?
A) 25%
B) 50%
C) 75%
D) 100%
A) 25%
B) 50%
C) 75%
D) 100%
فتح الحزمة
افتح القفل للوصول البطاقات البالغ عددها 34 في هذه المجموعة.
فتح الحزمة
k this deck
11
In a sample of 2000 Manitoba adults, 80 are currently out of work. What is the correct ratio of working to non-working adults in this sample?
A) 1.04:1-for every non-working adult, 1.04 are working
B) 24:1-for every non-working adult, 24 are working
C) 25:1-for every non-working adult, 25 are working
D) 80:1-for every non-working adult, 80 are working
A) 1.04:1-for every non-working adult, 1.04 are working
B) 24:1-for every non-working adult, 24 are working
C) 25:1-for every non-working adult, 25 are working
D) 80:1-for every non-working adult, 80 are working
فتح الحزمة
افتح القفل للوصول البطاقات البالغ عددها 34 في هذه المجموعة.
فتح الحزمة
k this deck
12
In June 2014, the entire province of Manitoba had a population of 985,900 working-age adults, and 668,300 of them were participating in the labour force. What percentage of the working-age population was participating in the labour force?
A) 0.32 × 100 = 32%
B) 0.48 × 100 = 48%
C) 0.59 × 100 = 59%
D) 0.68 × 100 = 68%
A) 0.32 × 100 = 32%
B) 0.48 × 100 = 48%
C) 0.59 × 100 = 59%
D) 0.68 × 100 = 68%
فتح الحزمة
افتح القفل للوصول البطاقات البالغ عددها 34 في هذه المجموعة.
فتح الحزمة
k this deck
13
Which of the following is a requirement for creating a frequency distribution?
A) The variable must be measured at the interval-ratio level.
B) The variable must have more than two categories.
C) The variable's categories must be mutually exclusive.
D) The variable's categories must be evenly balanced.
A) The variable must be measured at the interval-ratio level.
B) The variable must have more than two categories.
C) The variable's categories must be mutually exclusive.
D) The variable's categories must be evenly balanced.
فتح الحزمة
افتح القفل للوصول البطاقات البالغ عددها 34 في هذه المجموعة.
فتح الحزمة
k this deck
14
Which of the following should be reflected in a frequency distribution?
A) a balance of elegance and symmetry
B) a balance of time and money
C) a balance of questions and answers
D) a balance of detail and conciseness
A) a balance of elegance and symmetry
B) a balance of time and money
C) a balance of questions and answers
D) a balance of detail and conciseness
فتح الحزمة
افتح القفل للوصول البطاقات البالغ عددها 34 في هذه المجموعة.
فتح الحزمة
k this deck
15
Table 2.1 Age of Respondents
-According to Table 2.1, what is the width of each interval if 60 cases range in score from 4 to 84, and 10 intervals in a frequency distribution are wanted?
A) approximately 4
B) approximately 8
C) approximately 12
D) approximately 60
-According to Table 2.1, what is the width of each interval if 60 cases range in score from 4 to 84, and 10 intervals in a frequency distribution are wanted?
A) approximately 4
B) approximately 8
C) approximately 12
D) approximately 60
فتح الحزمة
افتح القفل للوصول البطاقات البالغ عددها 34 في هذه المجموعة.
فتح الحزمة
k this deck
16
Why do frequency distributions of interval-ratio-level data seldom contain more than 15 intervals?
A) The purpose of creating intervals is to reduce the categories into a concise range of values.
B) Midpoints of intervals become unclear when you have too many intervals.
C) The distinction between stated limits and real limits becomes unclear when you have a large number of intervals.
D) Most interval-ratio variables have fewer than 15 possible values, and it is impossible for the number of intervals to exceed the variable's range.
فتح الحزمة
افتح القفل للوصول البطاقات البالغ عددها 34 في هذه المجموعة.
فتح الحزمة
k this deck
17
The variable "number of fitness centres" across 25 districts of a large city ranges from 3 to 23. How wide should the interval width be if we desired 5 intervals?
A) interval width 1
B) interval width 2
C) interval width 3
D) interval width 4
A) interval width 1
B) interval width 2
C) interval width 3
D) interval width 4
فتح الحزمة
افتح القفل للوصول البطاقات البالغ عددها 34 في هذه المجموعة.
فتح الحزمة
k this deck
18
What would be the appropriate graph to show the distribution of Canadian-born versus non-Canadian-born students in an introductory economics class?
A) a frequency polygon
B) a pie chart
C) a bivariate table
D) a histogram
A) a frequency polygon
B) a pie chart
C) a bivariate table
D) a histogram
فتح الحزمة
افتح القفل للوصول البطاقات البالغ عددها 34 في هذه المجموعة.
فتح الحزمة
k this deck
19
What type of data is used with histograms and frequency polygons?
A) data measured at any level
B) data measured at the ordinal level
C) data measured at the interval-ratio level
D) data measured at the nominal level
A) data measured at any level
B) data measured at the ordinal level
C) data measured at the interval-ratio level
D) data measured at the nominal level
فتح الحزمة
افتح القفل للوصول البطاقات البالغ عددها 34 في هذه المجموعة.
فتح الحزمة
k this deck
20
What type of data is most appropriate for a histogram?
A) a continuous interval-ratio variable
B) a discrete interval-ratio variable
C) an ordinal variable
D) a nominal variable
A) a continuous interval-ratio variable
B) a discrete interval-ratio variable
C) an ordinal variable
D) a nominal variable
فتح الحزمة
افتح القفل للوصول البطاقات البالغ عددها 34 في هذه المجموعة.
فتح الحزمة
k this deck
21
The following is a frequency distribution for occupational category among people in an apartment building: Professional/Executive-17; Sales/Retail-31; Manual-11; Unemployed/Retired-5. What should be the proportion of the pie allocated to Sales/Retail in a pie chart?
A) 0.18
B) 0.40
C) 0.48
D) 0.63
A) 0.18
B) 0.40
C) 0.48
D) 0.63
فتح الحزمة
افتح القفل للوصول البطاقات البالغ عددها 34 في هذه المجموعة.
فتح الحزمة
k this deck
22
A researcher presents a figure to depict how many heroin sales were made last year by members of a large gang. Interval values for the variable border each other, representing the data as a continuous series. What type of graphing technique is the researcher using?
A) a histogram
B) a bar chart
C) a pie chart
D) a ratio chart
A) a histogram
B) a bar chart
C) a pie chart
D) a ratio chart
فتح الحزمة
افتح القفل للوصول البطاقات البالغ عددها 34 في هذه المجموعة.
فتح الحزمة
k this deck
23
Which of these distributions appropriately illustrates real limits?
A) 5-7, 8-10, 11-13, 12-14
B) 5-6.9, 7-8.9, 9-10.9, 11-12.9
C) 4.5-6.5, 5.5-7.5, 6.5-8.5, 7.5-9.5
D) 4.5-6.5, 6.5-8.5, 8.5-10.5, 10.5-12.5
A) 5-7, 8-10, 11-13, 12-14
B) 5-6.9, 7-8.9, 9-10.9, 11-12.9
C) 4.5-6.5, 5.5-7.5, 6.5-8.5, 7.5-9.5
D) 4.5-6.5, 6.5-8.5, 8.5-10.5, 10.5-12.5
فتح الحزمة
افتح القفل للوصول البطاقات البالغ عددها 34 في هذه المجموعة.
فتح الحزمة
k this deck
24
How does a frequency polygon differ from a histogram?
A) The frequency polygon uses dots rather than bars to represent frequencies.
B) The frequency polygon represents the upper values of adjacent intervals rather than midpoints.
C) The frequency polygon is best used for nominal and ordinal data.
D) The frequency polygon is used for data with smaller intervals than the histogram.
فتح الحزمة
افتح القفل للوصول البطاقات البالغ عددها 34 في هذه المجموعة.
فتح الحزمة
k this deck
25
Table 2.2 Number of Prior Convictions among Inmates at a Prison
-In Table 2.2, what is the ratio of people with 0-2 prior convictions to those with 9-11?
A) 0.18
B) 5.43
C) 10.86
D) 76.38
-In Table 2.2, what is the ratio of people with 0-2 prior convictions to those with 9-11?
A) 0.18
B) 5.43
C) 10.86
D) 76.38
فتح الحزمة
افتح القفل للوصول البطاقات البالغ عددها 34 في هذه المجموعة.
فتح الحزمة
k this deck
26
Table 2.2 Number of Prior Convictions among Inmates at a Prison
-In Table 2.2, what percentage of cases are in the 6-8 prior conviction group?
A) (76/14) = 5.43%
B) (14/76) × 100 = 18.42%
C) (14/69) × 100 = 20.29%
D) (69/76) × 100 = 90.79%
-In Table 2.2, what percentage of cases are in the 6-8 prior conviction group?
A) (76/14) = 5.43%
B) (14/76) × 100 = 18.42%
C) (14/69) × 100 = 20.29%
D) (69/76) × 100 = 90.79%
فتح الحزمة
افتح القفل للوصول البطاقات البالغ عددها 34 في هذه المجموعة.
فتح الحزمة
k this deck
27
Table 2.2 Number of Prior Convictions among Inmates at a Prison
-In Table 2.2, what would be the value for the cumulative percentage corresponding to the 9-11 prior conviction group?
A) 9.21%
B) 27.63%
C) 50%
D) 100%
-In Table 2.2, what would be the value for the cumulative percentage corresponding to the 9-11 prior conviction group?
A) 9.21%
B) 27.63%
C) 50%
D) 100%
فتح الحزمة
افتح القفل للوصول البطاقات البالغ عددها 34 في هذه المجموعة.
فتح الحزمة
k this deck
28
Table 2.2 Number of Prior Convictions among Inmates at a Prison
-In Table 2.2, what is the frequency value corresponding to the 3-5 prior conviction group?
A) 69
B) 59
C) 49
D) 17
-In Table 2.2, what is the frequency value corresponding to the 3-5 prior conviction group?
A) 69
B) 59
C) 49
D) 17
فتح الحزمة
افتح القفل للوصول البطاقات البالغ عددها 34 في هذه المجموعة.
فتح الحزمة
k this deck
29
Table 2.2 Number of Prior Convictions among Inmates at a Prison
-In Table 2.2, fill in the missing value in the cumulative frequency column.
A) 7
B) 11
C) 76
D) 100
-In Table 2.2, fill in the missing value in the cumulative frequency column.
A) 7
B) 11
C) 76
D) 100
فتح الحزمة
افتح القفل للوصول البطاقات البالغ عددها 34 في هذه المجموعة.
فتح الحزمة
k this deck
30
Table 2.2 Number of Prior Convictions among Inmates at a Prison
-Which of the following best characterizes the values in the prior convictions column in Table 2.2.
A) unequal intervals
B) stated limits
C) real limits
D) proportions
-Which of the following best characterizes the values in the prior convictions column in Table 2.2.
A) unequal intervals
B) stated limits
C) real limits
D) proportions
فتح الحزمة
افتح القفل للوصول البطاقات البالغ عددها 34 في هذه المجموعة.
فتح الحزمة
k this deck
31
Table 2.2 Number of Prior Convictions among Inmates at a Prison
-What would be an ideal graph to represent the data shown in Table 2.2?
A) frequency polygon
B) pie chart
C) bar chart
D) rate graph
-What would be an ideal graph to represent the data shown in Table 2.2?
A) frequency polygon
B) pie chart
C) bar chart
D) rate graph
فتح الحزمة
افتح القفل للوصول البطاقات البالغ عددها 34 في هذه المجموعة.
فتح الحزمة
k this deck
32
Why do researchers commonly use intervals when representing frequency distributions for interval-ratio variables, and what principles should guide them when constructing such frequency distributions?
• Interval-ratio variables tend to have many possible values. Aggregating a range of values helps provide a more manageable way to understand how the variable is distributed rather than showing the frequency of every possible score.
• Scores should be grouped to maximize clarity and ease of comprehension. A general guiding principle is that one should balance detail (a large number of narrow categories) with compactness (a smaller number of wide categories).
• Another general rule for using intervals is that they should be equal in size.
فتح الحزمة
افتح القفل للوصول البطاقات البالغ عددها 34 في هذه المجموعة.
فتح الحزمة
k this deck
33
Below are skills test scores for applicants of a software engineering job. Put the data into a frequency distribution using intervals of size 8. Include columns for percentages and cumulative percentages.
فتح الحزمة
افتح القفل للوصول البطاقات البالغ عددها 34 في هذه المجموعة.
فتح الحزمة
k this deck
34
The frequency distribution below displays the distribution of age for a sample drawn from a community. Finish the table by completing the columns for percentages and cumulative percentages.
فتح الحزمة
افتح القفل للوصول البطاقات البالغ عددها 34 في هذه المجموعة.
فتح الحزمة
k this deck
فتح الحزمة
افتح القفل للوصول البطاقات البالغ عددها 34 في هذه المجموعة.


