Deck 11: Managerial Decisions in Competitive Markets
ملء الشاشة (f)
سؤال
refer to the following figure:
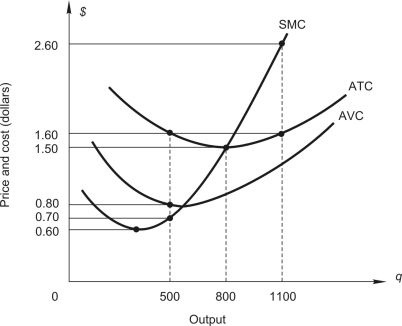 The figure above shows cost curves for a perfectly competitive firm.
-A profit-maximizing firm will break even when market price is:
A) $ 0.60
B) $ 0.80
C) $1.50
D) $1.60
The figure above shows cost curves for a perfectly competitive firm.-A profit-maximizing firm will break even when market price is:
A) $ 0.60
B) $ 0.80
C) $1.50
D) $1.60
سؤال
refer to the following figure:
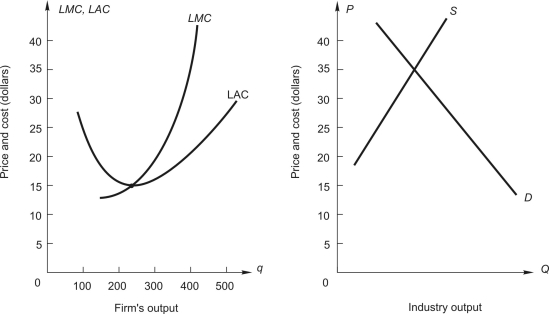 The graph on the left shows long-run average and marginal cost for a typical firm in a perfectly competitive industry. The graph on the right shows demand and long-run supply for an increasing-cost industry.
-How much profit will the firm earn?
A) zero
B) $2,600
C) $3,100
D) $3,750
E) $6,000
The graph on the left shows long-run average and marginal cost for a typical firm in a perfectly competitive industry. The graph on the right shows demand and long-run supply for an increasing-cost industry.-How much profit will the firm earn?
A) zero
B) $2,600
C) $3,100
D) $3,750
E) $6,000
سؤال
refer to the following:
A consulting company estimated market demand and supply in a perfectly competitive industry and obtained the following results:
 where P is price, M is income, and
  is the price of a key input. The forecasts for the next year are
  = $15,000 and
  = $20. Average variable cost is estimated to be
 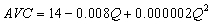 Total fixed cost will be $6,000 next year.
-What is the firm's minimum average variable cost?
A) $ 2
B) $ 6
C) $ 8
D) $20
A consulting company estimated market demand and supply in a perfectly competitive industry and obtained the following results:
where P is price, M is income, and is the price of a key input. The forecasts for the next year are = $15,000 and = $20. Average variable cost is estimated to be Total fixed cost will be $6,000 next year.-What is the firm's minimum average variable cost?
A) $ 2
B) $ 6
C) $ 8
D) $20
سؤال
refer to the following:
A consulting company estimated market demand and supply in a perfectly competitive industry and obtained the following results: where P is price, M is income, and is the price of a key input. The forecasts for the next year are = $15,000 and = $20. Average variable cost is estimated to be Total fixed cost will be $6,000 next year.
-What is the profit-maximizing output choice for the firm?
A) 3,000 units
B) 4,000 units
C) 5,000 units
D) 6,000 units
A consulting company estimated market demand and supply in a perfectly competitive industry and obtained the following results:
where P is price, M is income, and is the price of a key input. The forecasts for the next year are = $15,000 and = $20. Average variable cost is estimated to be Total fixed cost will be $6,000 next year.-What is the profit-maximizing output choice for the firm?
A) 3,000 units
B) 4,000 units
C) 5,000 units
D) 6,000 units
سؤال
refer to the following:
Consider a competitive industry and a price-taking firm that produces in that industry. The market demand and supply functions are estimated to be:
Demand: Supply:
  where Q is quantity, P is the price of the product, M is income, and
  is the input price. The manager of the perfectly competitive firm uses time-eries data to obtain the following forecasted values of M and
  for 2009:
 The manager also estimates the average variable cost function to be
 Total fixed costs will be $2,000 in 2009.
-What is the price forecast for 2009?
A) $2
B) $2.50
C) $2.75
D) $3
E) none of the above
Consider a competitive industry and a price-taking firm that produces in that industry. The market demand and supply functions are estimated to be:
Demand:
Supply: where Q is quantity, P is the price of the product, M is income, and is the input price. The manager of the perfectly competitive firm uses time-eries data to obtain the following forecasted values of M and for 2009: The manager also estimates the average variable cost function to be Total fixed costs will be $2,000 in 2009.-What is the price forecast for 2009?
A) $2
B) $2.50
C) $2.75
D) $3
E) none of the above
سؤال
refer to the following:
Consider a competitive industry and a price-taking firm that produces in that industry. The market demand and supply functions are estimated to be:
Demand: Supply: where Q is quantity, P is the price of the product, M is income, and is the input price. The manager of the perfectly competitive firm uses time-eries data to obtain the following forecasted values of M and for 2009:
The manager also estimates the average variable cost function to be
Total fixed costs will be $2,000 in 2009.
-Average variable cost reaches its minimum value of _____ units of output.
A) 1,000
B) 1,500
C) 2,000
D) 2,500
Consider a competitive industry and a price-taking firm that produces in that industry. The market demand and supply functions are estimated to be:
Demand:
Supply: where Q is quantity, P is the price of the product, M is income, and is the input price. The manager of the perfectly competitive firm uses time-eries data to obtain the following forecasted values of M and for 2009: The manager also estimates the average variable cost function to be Total fixed costs will be $2,000 in 2009.-Average variable cost reaches its minimum value of _____ units of output.
A) 1,000
B) 1,500
C) 2,000
D) 2,500
سؤال
refer to the following:
Consider a competitive industry and a price-taking firm that produces in that industry. The market demand and supply functions are estimated to be:
Demand: Supply: where Q is quantity, P is the price of the product, M is income, and is the input price. The manager of the perfectly competitive firm uses time-eries data to obtain the following forecasted values of M and for 2009:
The manager also estimates the average variable cost function to be
Total fixed costs will be $2,000 in 2009.
-The minimum value of average variable cost is $_____.
A) $0.50
B) $0.75
C) $0.975
D) $1.00
E) $2.15
Consider a competitive industry and a price-taking firm that produces in that industry. The market demand and supply functions are estimated to be:
Demand:
Supply: where Q is quantity, P is the price of the product, M is income, and is the input price. The manager of the perfectly competitive firm uses time-eries data to obtain the following forecasted values of M and for 2009: The manager also estimates the average variable cost function to be Total fixed costs will be $2,000 in 2009.-The minimum value of average variable cost is $_____.
A) $0.50
B) $0.75
C) $0.975
D) $1.00
E) $2.15
سؤال
refer to the following:
Consider a competitive industry and a price-taking firm that produces in that industry. The market demand and supply functions are estimated to be:
Demand: Supply: where Q is quantity, P is the price of the product, M is income, and is the input price. The manager of the perfectly competitive firm uses time-eries data to obtain the following forecasted values of M and for 2009:
The manager also estimates the average variable cost function to be
Total fixed costs will be $2,000 in 2009.
-The manager _____ produce since _____________.
A) should; $3 > $0.975
B) should; $2.75 > $0.75
C) should not; $2 < $2.15
D) should not; $0.50 < $1.00
Consider a competitive industry and a price-taking firm that produces in that industry. The market demand and supply functions are estimated to be:
Demand:
Supply: where Q is quantity, P is the price of the product, M is income, and is the input price. The manager of the perfectly competitive firm uses time-eries data to obtain the following forecasted values of M and for 2009: The manager also estimates the average variable cost function to be Total fixed costs will be $2,000 in 2009.-The manager _____ produce since _____________.
A) should; $3 > $0.975
B) should; $2.75 > $0.75
C) should not; $2 < $2.15
D) should not; $0.50 < $1.00
سؤال
refer to the following:
Consider a competitive industry and a price-taking firm that produces in that industry. The market demand and supply functions are estimated to be:
Demand: Supply: where Q is quantity, P is the price of the product, M is income, and is the input price. The manager of the perfectly competitive firm uses time-eries data to obtain the following forecasted values of M and for 2009:
The manager also estimates the average variable cost function to be
Total fixed costs will be $2,000 in 2009.
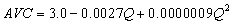
-The marginal cost function is:
A) SMC = 3.0 - 0.0027Q + 0.0000009Q2
B) SMC = 3.0 - 0.00135Q + 0.00000045Q2
C) SMC = 3.0Q -0.0027Q2 + 0.0000009Q3
D) SMC = 3.0 - 0.0054Q + 0.0000018Q2
E) none of the above
Consider a competitive industry and a price-taking firm that produces in that industry. The market demand and supply functions are estimated to be:
Demand:
Supply: where Q is quantity, P is the price of the product, M is income, and is the input price. The manager of the perfectly competitive firm uses time-eries data to obtain the following forecasted values of M and for 2009: The manager also estimates the average variable cost function to be Total fixed costs will be $2,000 in 2009.-The marginal cost function is:
A) SMC = 3.0 - 0.0027Q + 0.0000009Q2
B) SMC = 3.0 - 0.00135Q + 0.00000045Q2
C) SMC = 3.0Q -0.0027Q2 + 0.0000009Q3
D) SMC = 3.0 - 0.0054Q + 0.0000018Q2
E) none of the above
سؤال
refer to the following:
Consider a competitive industry and a price-taking firm that produces in that industry. The market demand and supply functions are estimated to be:
Demand: Supply: where Q is quantity, P is the price of the product, M is income, and is the input price. The manager of the perfectly competitive firm uses time-eries data to obtain the following forecasted values of M and for 2009:
The manager also estimates the average variable cost function to be
Total fixed costs will be $2,000 in 2009.
-The optimal level of production for the firm is
A) 1,000
B) 1,500
C) 2,000
D) 2,500
E) none of the above
Consider a competitive industry and a price-taking firm that produces in that industry. The market demand and supply functions are estimated to be:
Demand:
Supply: where Q is quantity, P is the price of the product, M is income, and is the input price. The manager of the perfectly competitive firm uses time-eries data to obtain the following forecasted values of M and for 2009: The manager also estimates the average variable cost function to be Total fixed costs will be $2,000 in 2009.-The optimal level of production for the firm is
A) 1,000
B) 1,500
C) 2,000
D) 2,500
E) none of the above
سؤال
refer to the following:
Consider a competitive industry and a price-taking firm that produces in that industry. The market demand and supply functions are estimated to be:
Demand: Supply: where Q is quantity, P is the price of the product, M is income, and is the input price. The manager of the perfectly competitive firm uses time-eries data to obtain the following forecasted values of M and for 2009:
The manager also estimates the average variable cost function to be
Total fixed costs will be $2,000 in 2009.
-The profit (loss) is
A) $2,600
B) $2,000
C) $4,000
D) $3,250
E) none of the above
Consider a competitive industry and a price-taking firm that produces in that industry. The market demand and supply functions are estimated to be:
Demand:
Supply: where Q is quantity, P is the price of the product, M is income, and is the input price. The manager of the perfectly competitive firm uses time-eries data to obtain the following forecasted values of M and for 2009: The manager also estimates the average variable cost function to be Total fixed costs will be $2,000 in 2009.-The profit (loss) is
A) $2,600
B) $2,000
C) $4,000
D) $3,250
E) none of the above
سؤال
use the following data for a competitive industry and a price-taking firm that operates in this market.
Bartech, Inc. is a firm operating in a competitive market. The manager of Bartech forecasts product price to be $28 in 2009. Bartech's average variable cost function in 2005 is estimated to be
 Bartech expects to face fixed costs of $12,000 in 2009.
-At what level of output will Bartech's average variable cost reach its minimum value?
A) 2,000 units
B) 3,000 units
C) 4,000 units
D) 5,000 units
E) 6,000 units
Bartech, Inc. is a firm operating in a competitive market. The manager of Bartech forecasts product price to be $28 in 2009. Bartech's average variable cost function in 2005 is estimated to be
Bartech expects to face fixed costs of $12,000 in 2009.-At what level of output will Bartech's average variable cost reach its minimum value?
A) 2,000 units
B) 3,000 units
C) 4,000 units
D) 5,000 units
E) 6,000 units
سؤال
use the following data for a competitive industry and a price-taking firm that operates in this market.
Bartech, Inc. is a firm operating in a competitive market. The manager of Bartech forecasts product price to be $28 in 2009. Bartech's average variable cost function in 2005 is estimated to be
Bartech expects to face fixed costs of $12,000 in 2009.
-What is the minimum average variable cost?
A) $0
B) $5.50
C) $6.00
D) $6.50
E) $7.00
Bartech, Inc. is a firm operating in a competitive market. The manager of Bartech forecasts product price to be $28 in 2009. Bartech's average variable cost function in 2005 is estimated to be
Bartech expects to face fixed costs of $12,000 in 2009.-What is the minimum average variable cost?
A) $0
B) $5.50
C) $6.00
D) $6.50
E) $7.00
سؤال
سؤال
Use the following information
Radon Research Corporation (RRC) is one of 24 firms in Albuquerque testing homes for dangerous levels of radon gas. There is a standard test that all testing companies use. The manager of RRC wants to know the number of homes to test in 2009 in order to maximize the firm's profit. The manager forecasted a price of $160 for radon tests in 2009.
The firm's marginal cost was estimated as
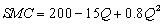 where Q is the number of tests performed each week. RRC's fixed cost will be $250 per week.
-The weekly profit (loss) at RRC in 2009 will be
A) $121
B) $320
C) $86 -$61
D)-$121
Radon Research Corporation (RRC) is one of 24 firms in Albuquerque testing homes for dangerous levels of radon gas. There is a standard test that all testing companies use. The manager of RRC wants to know the number of homes to test in 2009 in order to maximize the firm's profit. The manager forecasted a price of $160 for radon tests in 2009.
The firm's marginal cost was estimated as
where Q is the number of tests performed each week. RRC's fixed cost will be $250 per week.-The weekly profit (loss) at RRC in 2009 will be
A) $121
B) $320
C) $86 -$61
D)-$121
سؤال
سؤال
سؤال
سؤال
سؤال
سؤال
Use the following graph on a competitive firm's short-run cost curves to answer this question.
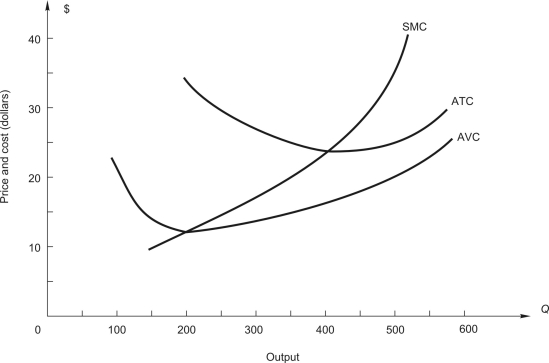
The price of the product is $35.
-The firm produces ____________ units of output. Total revenue is $____________ and total cost is $____________.
The price of the product is $35.
-The firm produces ____________ units of output. Total revenue is $____________ and total cost is $____________.
سؤال
Use the following graph on a competitive firm's short-run cost curves to answer this question.
The price of the product is $35.
-The firm makes a profit (loss) of $____________.
The price of the product is $20.
The price of the product is $35.
-The firm makes a profit (loss) of $____________.
The price of the product is $20.
سؤال
Use the following graph on a competitive firm's short-run cost curves to answer this question.
The price of the product is $35.
-The firm produces ______ units of output. Total revenue is $____________ and total cost is $____________.
The price of the product is $35.
-The firm produces ______ units of output. Total revenue is $____________ and total cost is $____________.
سؤال
Use the following graph on a competitive firm's short-run cost curves to answer this question.
The price of the product is $35.
-The firm makes a profit (loss) of $____________.
The price of the product is $35.
-The firm makes a profit (loss) of $____________.
سؤال
Use the following graph on a competitive firm's short-run cost curves to answer this question.
The price of the product is $35.
-The firm's total revenue at a price of $20 covers all of its variable cost, and the firm has $____________ left to apply toward paying its ________________________. If the firm shuts down and produces nothing it would lose an amount equal to its _________________
The price of the product is $35.
-The firm's total revenue at a price of $20 covers all of its variable cost, and the firm has $____________ left to apply toward paying its ________________________. If the firm shuts down and produces nothing it would lose an amount equal to its _________________
سؤال
Use the following graph on a competitive firm's short-run cost curves to answer this question.
The price of the product is $35.
-At any price below (approximately) $_________, the firm would shut down.
The price of the product is $35.
-At any price below (approximately) $_________, the firm would shut down.
سؤال
سؤال
سؤال
سؤال
سؤال
The following graph showing a perfectly competitive firm's long-run cost curves.
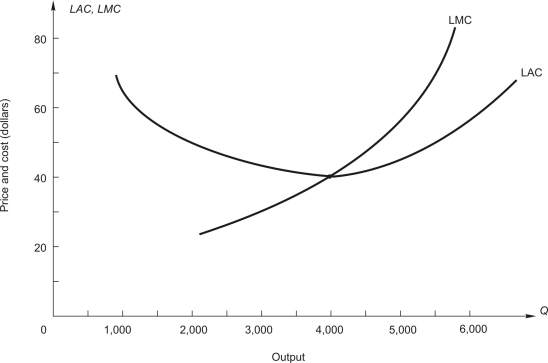
-If price is $70, the firm will produce __________ units of output.
-If price is $70, the firm will produce __________ units of output.
سؤال
The following graph showing a perfectly competitive firm's long-run cost curves.
-If price is $70, total revenue will be $__________ and total cost will be $__________.
-If price is $70, total revenue will be $__________ and total cost will be $__________.
سؤال
The following graph showing a perfectly competitive firm's long-run cost curves.
-If price is $70, the firm makes $__________ economic profit.
-If price is $70, the firm makes $__________ economic profit.
سؤال
The following graph showing a perfectly competitive firm's long-run cost curves.
-In long-run competitive equilibrium, the firm will produce __________ units of output and sell them at a price of $________ if this is a constant cost industry.
-In long-run competitive equilibrium, the firm will produce __________ units of output and sell them at a price of $________ if this is a constant cost industry.
سؤال
The following graph showing a perfectly competitive firm's long-run cost curves.
-In long-run equilibrium, the firm's economic profit is $_________.
-In long-run equilibrium, the firm's economic profit is $_________.
سؤال
The following figure shows a competitive firm's ARP and MRP curves.
-If the wage rate is $20, how many workers will the firm hire? ________.
-If the wage rate is $20, how many workers will the firm hire? ________.
سؤال
The following figure shows a competitive firm's ARP and MRP curves.
-If the wage rate is $30, how many workers will the firm hire? ________.
-If the wage rate is $30, how many workers will the firm hire? ________.
سؤال
The following figure shows a competitive firm's ARP and MRP curves.
-If the wage is $60, how many workers will the firm hire? ________. How much output will the firm produce? ________.
-If the wage is $60, how many workers will the firm hire? ________. How much output will the firm produce? ________.
سؤال
سؤال
سؤال
سؤال
A competitive firm estimates its average variable cost function to be . 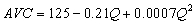 The firm's total fixed cost is $3,500.
-The marginal cost function associated with this average variable cost function is
SMC =__________________________.
The firm's total fixed cost is $3,500.-The marginal cost function associated with this average variable cost function is
SMC =__________________________.
سؤال
A competitive firm estimates its average variable cost function to be . The firm's total fixed cost is $3,500.
-AVC reaches its minimum at ______units of output. Minimum AVC is $_________.
The firm's total fixed cost is $3,500.-AVC reaches its minimum at ______units of output. Minimum AVC is $_________.
سؤال
A competitive firm estimates its average variable cost function to be . The firm's total fixed cost is $3,500.
-Suppose the price of the product is P = $125. The firm should produce _________ units of output. The firm earns a profit (loss) of $__________________.
The firm's total fixed cost is $3,500.-Suppose the price of the product is P = $125. The firm should produce _________ units of output. The firm earns a profit (loss) of $__________________.
سؤال
A competitive firm estimates its average variable cost function to be . The firm's total fixed cost is $3,500.
-Suppose the price of the product is P = $115. The firm should now produce _________ units of output. Its profit (loss) will be $_________.
The firm's total fixed cost is $3,500.-Suppose the price of the product is P = $115. The firm should now produce _________ units of output. Its profit (loss) will be $_________.
سؤال
A competitive firm estimates its average variable cost function to be . The firm's total fixed cost is $3,500.
-Suppose the price of the product falls to P = $100. The firm should produce _________ units of output. Its profit (loss) will be $____________.
The firm's total fixed cost is $3,500.-Suppose the price of the product falls to P = $100. The firm should produce _________ units of output. Its profit (loss) will be $____________.
سؤال
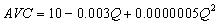
A competitive firm has estimated its average variable cost function as
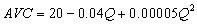 Its total fixed cost is $500.
-The marginal cost function associated with this AVC function is
SMC = ________________.
Its total fixed cost is $500.-The marginal cost function associated with this AVC function is
SMC = ________________.
سؤال
A competitive firm has estimated its average variable cost function as
Its total fixed cost is $500.
-AVC reaches its minimum at _________ units of output at which AVC = $__________.
The forecasted price is P = $23.60.
Its total fixed cost is $500.-AVC reaches its minimum at _________ units of output at which AVC = $__________.
The forecasted price is P = $23.60.
سؤال
A competitive firm has estimated its average variable cost function as
Its total fixed cost is $500.
-To maximize its profit the firm should produce ___________ units of output. Profit (loss) is $____________.
Suppose the forecasted price is P = $14.94.
Its total fixed cost is $500.-To maximize its profit the firm should produce ___________ units of output. Profit (loss) is $____________.
Suppose the forecasted price is P = $14.94.
سؤال
A competitive firm has estimated its average variable cost function as
Its total fixed cost is $500.
-To maximize its profit, the firm should produce ___________ units of output. Profit (loss) is $__________.
Suppose the forecasted price is P = $10.
Its total fixed cost is $500.-To maximize its profit, the firm should produce ___________ units of output. Profit (loss) is $__________.
Suppose the forecasted price is P = $10.
سؤال
A competitive firm has estimated its average variable cost function as
Its total fixed cost is $500.
-The firm should produce ____________ units of output for a profit (loss) of $____________.
Its total fixed cost is $500.-The firm should produce ____________ units of output for a profit (loss) of $____________.
سؤال
The figure below shows a long-run industry supply curve (SLR) and the demand curve (D) facing the competitive industry. The firms in this industry employ inputs of varying quality and productivity.
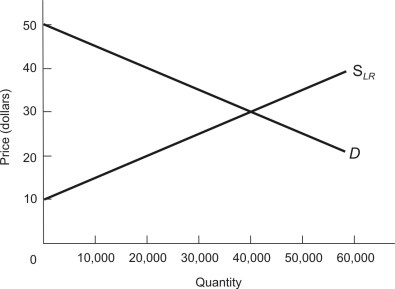
-The long-run marginal cost of producing the 20,000th unit of output is $________.
-The long-run marginal cost of producing the 20,000th unit of output is $________.
سؤال
The figure below shows a long-run industry supply curve (SLR) and the demand curve (D) facing the competitive industry. The firms in this industry employ inputs of varying quality and productivity.
-If the firms in this industry produce a total industry output of 20,000 units, every firm produces at the minimum long-run average cost of $_______ per unit and earns $________ of economic profit.
-If the firms in this industry produce a total industry output of 20,000 units, every firm produces at the minimum long-run average cost of $_______ per unit and earns $________ of economic profit.
سؤال
The figure below shows a long-run industry supply curve (SLR) and the demand curve (D) facing the competitive industry. The firms in this industry employ inputs of varying quality and productivity.
-In long-run competitive equilibrium, the industry will produce ________ units of the good and sell these units at the market-clearing price of $______ per unit.
-In long-run competitive equilibrium, the industry will produce ________ units of the good and sell these units at the market-clearing price of $______ per unit.
سؤال
The figure below shows a long-run industry supply curve (SLR) and the demand curve (D) facing the competitive industry. The firms in this industry employ inputs of varying quality and productivity.
-The long-run marginal cost at the equilibrium output in part c is $_______, and the long-run average cost at the equilibrium output is $_______.
-The long-run marginal cost at the equilibrium output in part c is $_______, and the long-run average cost at the equilibrium output is $_______.
سؤال
The figure below shows a long-run industry supply curve (SLR) and the demand curve (D) facing the competitive industry. The firms in this industry employ inputs of varying quality and productivity.
-"The firms employing the superior inputs have lower costs than their rivals, but they still cannot earn any profit." Is this statement true or false?
-"The firms employing the superior inputs have lower costs than their rivals, but they still cannot earn any profit." Is this statement true or false?
سؤال
The figure below shows a long-run industry supply curve (SLR) and the demand curve (D) facing the competitive industry. The firms in this industry employ inputs of varying quality and productivity.
-Total producer surplus in long-run competitive equilibrium is $_________ for this industry.
-Total producer surplus in long-run competitive equilibrium is $_________ for this industry.
سؤال
The figure below shows a long-run industry supply curve (SLR) and the demand curve (D) facing the competitive industry. The firms in this industry employ inputs of varying quality and productivity.
-______________________ get the producer surplus calculated in part f.
-______________________ get the producer surplus calculated in part f.

فتح الحزمة
قم بالتسجيل لفتح البطاقات في هذه المجموعة!
Unlock Deck
Unlock Deck
1/58
العب
ملء الشاشة (f)
Deck 11: Managerial Decisions in Competitive Markets
1
refer to the following figure:
The figure above shows cost curves for a perfectly competitive firm.
-A profit-maximizing firm will break even when market price is:
A) $ 0.60
B) $ 0.80
C) $1.50
D) $1.60
The figure above shows cost curves for a perfectly competitive firm.-A profit-maximizing firm will break even when market price is:
A) $ 0.60
B) $ 0.80
C) $1.50
D) $1.60
$1.50
2
refer to the following figure:
The graph on the left shows long-run average and marginal cost for a typical firm in a perfectly competitive industry. The graph on the right shows demand and long-run supply for an increasing-cost industry.
-How much profit will the firm earn?
A) zero
B) $2,600
C) $3,100
D) $3,750
E) $6,000
The graph on the left shows long-run average and marginal cost for a typical firm in a perfectly competitive industry. The graph on the right shows demand and long-run supply for an increasing-cost industry.-How much profit will the firm earn?
A) zero
B) $2,600
C) $3,100
D) $3,750
E) $6,000
$6,000
3
refer to the following:
A consulting company estimated market demand and supply in a perfectly competitive industry and obtained the following results: where P is price, M is income, and is the price of a key input. The forecasts for the next year are = $15,000 and = $20. Average variable cost is estimated to be Total fixed cost will be $6,000 next year.
-What is the firm's minimum average variable cost?
A) $ 2
B) $ 6
C) $ 8
D) $20
A consulting company estimated market demand and supply in a perfectly competitive industry and obtained the following results:
where P is price, M is income, and is the price of a key input. The forecasts for the next year are = $15,000 and = $20. Average variable cost is estimated to be Total fixed cost will be $6,000 next year.-What is the firm's minimum average variable cost?
A) $ 2
B) $ 6
C) $ 8
D) $20
$ 6
4
refer to the following:
A consulting company estimated market demand and supply in a perfectly competitive industry and obtained the following results: where P is price, M is income, and is the price of a key input. The forecasts for the next year are = $15,000 and = $20. Average variable cost is estimated to be Total fixed cost will be $6,000 next year.
-What is the profit-maximizing output choice for the firm?
A) 3,000 units
B) 4,000 units
C) 5,000 units
D) 6,000 units
A consulting company estimated market demand and supply in a perfectly competitive industry and obtained the following results:
where P is price, M is income, and is the price of a key input. The forecasts for the next year are = $15,000 and = $20. Average variable cost is estimated to be Total fixed cost will be $6,000 next year.-What is the profit-maximizing output choice for the firm?
A) 3,000 units
B) 4,000 units
C) 5,000 units
D) 6,000 units
فتح الحزمة
افتح القفل للوصول البطاقات البالغ عددها 58 في هذه المجموعة.
فتح الحزمة
k this deck
5
refer to the following:
Consider a competitive industry and a price-taking firm that produces in that industry. The market demand and supply functions are estimated to be:
Demand: Supply: where Q is quantity, P is the price of the product, M is income, and is the input price. The manager of the perfectly competitive firm uses time-eries data to obtain the following forecasted values of M and for 2009:
The manager also estimates the average variable cost function to be
Total fixed costs will be $2,000 in 2009.
-What is the price forecast for 2009?
A) $2
B) $2.50
C) $2.75
D) $3
E) none of the above
Consider a competitive industry and a price-taking firm that produces in that industry. The market demand and supply functions are estimated to be:
Demand:
Supply: where Q is quantity, P is the price of the product, M is income, and is the input price. The manager of the perfectly competitive firm uses time-eries data to obtain the following forecasted values of M and for 2009: The manager also estimates the average variable cost function to be Total fixed costs will be $2,000 in 2009.-What is the price forecast for 2009?
A) $2
B) $2.50
C) $2.75
D) $3
E) none of the above
فتح الحزمة
افتح القفل للوصول البطاقات البالغ عددها 58 في هذه المجموعة.
فتح الحزمة
k this deck
6
refer to the following:
Consider a competitive industry and a price-taking firm that produces in that industry. The market demand and supply functions are estimated to be:
Demand: Supply: where Q is quantity, P is the price of the product, M is income, and is the input price. The manager of the perfectly competitive firm uses time-eries data to obtain the following forecasted values of M and for 2009:
The manager also estimates the average variable cost function to be
Total fixed costs will be $2,000 in 2009.
-Average variable cost reaches its minimum value of _____ units of output.
A) 1,000
B) 1,500
C) 2,000
D) 2,500
Consider a competitive industry and a price-taking firm that produces in that industry. The market demand and supply functions are estimated to be:
Demand:
Supply: where Q is quantity, P is the price of the product, M is income, and is the input price. The manager of the perfectly competitive firm uses time-eries data to obtain the following forecasted values of M and for 2009: The manager also estimates the average variable cost function to be Total fixed costs will be $2,000 in 2009.-Average variable cost reaches its minimum value of _____ units of output.
A) 1,000
B) 1,500
C) 2,000
D) 2,500
فتح الحزمة
افتح القفل للوصول البطاقات البالغ عددها 58 في هذه المجموعة.
فتح الحزمة
k this deck
7
refer to the following:
Consider a competitive industry and a price-taking firm that produces in that industry. The market demand and supply functions are estimated to be:
Demand: Supply: where Q is quantity, P is the price of the product, M is income, and is the input price. The manager of the perfectly competitive firm uses time-eries data to obtain the following forecasted values of M and for 2009:
The manager also estimates the average variable cost function to be
Total fixed costs will be $2,000 in 2009.
-The minimum value of average variable cost is $_____.
A) $0.50
B) $0.75
C) $0.975
D) $1.00
E) $2.15
Consider a competitive industry and a price-taking firm that produces in that industry. The market demand and supply functions are estimated to be:
Demand:
Supply: where Q is quantity, P is the price of the product, M is income, and is the input price. The manager of the perfectly competitive firm uses time-eries data to obtain the following forecasted values of M and for 2009: The manager also estimates the average variable cost function to be Total fixed costs will be $2,000 in 2009.-The minimum value of average variable cost is $_____.
A) $0.50
B) $0.75
C) $0.975
D) $1.00
E) $2.15
فتح الحزمة
افتح القفل للوصول البطاقات البالغ عددها 58 في هذه المجموعة.
فتح الحزمة
k this deck
8
refer to the following:
Consider a competitive industry and a price-taking firm that produces in that industry. The market demand and supply functions are estimated to be:
Demand: Supply: where Q is quantity, P is the price of the product, M is income, and is the input price. The manager of the perfectly competitive firm uses time-eries data to obtain the following forecasted values of M and for 2009:
The manager also estimates the average variable cost function to be
Total fixed costs will be $2,000 in 2009.
-The manager _____ produce since _____________.
A) should; $3 > $0.975
B) should; $2.75 > $0.75
C) should not; $2 < $2.15
D) should not; $0.50 < $1.00
Consider a competitive industry and a price-taking firm that produces in that industry. The market demand and supply functions are estimated to be:
Demand:
Supply: where Q is quantity, P is the price of the product, M is income, and is the input price. The manager of the perfectly competitive firm uses time-eries data to obtain the following forecasted values of M and for 2009: The manager also estimates the average variable cost function to be Total fixed costs will be $2,000 in 2009.-The manager _____ produce since _____________.
A) should; $3 > $0.975
B) should; $2.75 > $0.75
C) should not; $2 < $2.15
D) should not; $0.50 < $1.00
فتح الحزمة
افتح القفل للوصول البطاقات البالغ عددها 58 في هذه المجموعة.
فتح الحزمة
k this deck
9
refer to the following:
Consider a competitive industry and a price-taking firm that produces in that industry. The market demand and supply functions are estimated to be:
Demand: Supply: where Q is quantity, P is the price of the product, M is income, and is the input price. The manager of the perfectly competitive firm uses time-eries data to obtain the following forecasted values of M and for 2009:
The manager also estimates the average variable cost function to be
Total fixed costs will be $2,000 in 2009.
-The marginal cost function is:
A) SMC = 3.0 - 0.0027Q + 0.0000009Q2
B) SMC = 3.0 - 0.00135Q + 0.00000045Q2
C) SMC = 3.0Q -0.0027Q2 + 0.0000009Q3
D) SMC = 3.0 - 0.0054Q + 0.0000018Q2
E) none of the above
Consider a competitive industry and a price-taking firm that produces in that industry. The market demand and supply functions are estimated to be:
Demand:
Supply: where Q is quantity, P is the price of the product, M is income, and is the input price. The manager of the perfectly competitive firm uses time-eries data to obtain the following forecasted values of M and for 2009: The manager also estimates the average variable cost function to be Total fixed costs will be $2,000 in 2009.-The marginal cost function is:
A) SMC = 3.0 - 0.0027Q + 0.0000009Q2
B) SMC = 3.0 - 0.00135Q + 0.00000045Q2
C) SMC = 3.0Q -0.0027Q2 + 0.0000009Q3
D) SMC = 3.0 - 0.0054Q + 0.0000018Q2
E) none of the above
فتح الحزمة
افتح القفل للوصول البطاقات البالغ عددها 58 في هذه المجموعة.
فتح الحزمة
k this deck
10
refer to the following:
Consider a competitive industry and a price-taking firm that produces in that industry. The market demand and supply functions are estimated to be:
Demand: Supply: where Q is quantity, P is the price of the product, M is income, and is the input price. The manager of the perfectly competitive firm uses time-eries data to obtain the following forecasted values of M and for 2009:
The manager also estimates the average variable cost function to be
Total fixed costs will be $2,000 in 2009.
-The optimal level of production for the firm is
A) 1,000
B) 1,500
C) 2,000
D) 2,500
E) none of the above
Consider a competitive industry and a price-taking firm that produces in that industry. The market demand and supply functions are estimated to be:
Demand:
Supply: where Q is quantity, P is the price of the product, M is income, and is the input price. The manager of the perfectly competitive firm uses time-eries data to obtain the following forecasted values of M and for 2009: The manager also estimates the average variable cost function to be Total fixed costs will be $2,000 in 2009.-The optimal level of production for the firm is
A) 1,000
B) 1,500
C) 2,000
D) 2,500
E) none of the above
فتح الحزمة
افتح القفل للوصول البطاقات البالغ عددها 58 في هذه المجموعة.
فتح الحزمة
k this deck
11
refer to the following:
Consider a competitive industry and a price-taking firm that produces in that industry. The market demand and supply functions are estimated to be:
Demand: Supply: where Q is quantity, P is the price of the product, M is income, and is the input price. The manager of the perfectly competitive firm uses time-eries data to obtain the following forecasted values of M and for 2009:
The manager also estimates the average variable cost function to be
Total fixed costs will be $2,000 in 2009.
-The profit (loss) is
A) $2,600
B) $2,000
C) $4,000
D) $3,250
E) none of the above
Consider a competitive industry and a price-taking firm that produces in that industry. The market demand and supply functions are estimated to be:
Demand:
Supply: where Q is quantity, P is the price of the product, M is income, and is the input price. The manager of the perfectly competitive firm uses time-eries data to obtain the following forecasted values of M and for 2009: The manager also estimates the average variable cost function to be Total fixed costs will be $2,000 in 2009.-The profit (loss) is
A) $2,600
B) $2,000
C) $4,000
D) $3,250
E) none of the above
فتح الحزمة
افتح القفل للوصول البطاقات البالغ عددها 58 في هذه المجموعة.
فتح الحزمة
k this deck
12
use the following data for a competitive industry and a price-taking firm that operates in this market.
Bartech, Inc. is a firm operating in a competitive market. The manager of Bartech forecasts product price to be $28 in 2009. Bartech's average variable cost function in 2005 is estimated to be
Bartech expects to face fixed costs of $12,000 in 2009.
-At what level of output will Bartech's average variable cost reach its minimum value?
A) 2,000 units
B) 3,000 units
C) 4,000 units
D) 5,000 units
E) 6,000 units
Bartech, Inc. is a firm operating in a competitive market. The manager of Bartech forecasts product price to be $28 in 2009. Bartech's average variable cost function in 2005 is estimated to be
Bartech expects to face fixed costs of $12,000 in 2009.-At what level of output will Bartech's average variable cost reach its minimum value?
A) 2,000 units
B) 3,000 units
C) 4,000 units
D) 5,000 units
E) 6,000 units
فتح الحزمة
افتح القفل للوصول البطاقات البالغ عددها 58 في هذه المجموعة.
فتح الحزمة
k this deck
13
use the following data for a competitive industry and a price-taking firm that operates in this market.
Bartech, Inc. is a firm operating in a competitive market. The manager of Bartech forecasts product price to be $28 in 2009. Bartech's average variable cost function in 2005 is estimated to be
Bartech expects to face fixed costs of $12,000 in 2009.
-What is the minimum average variable cost?
A) $0
B) $5.50
C) $6.00
D) $6.50
E) $7.00
Bartech, Inc. is a firm operating in a competitive market. The manager of Bartech forecasts product price to be $28 in 2009. Bartech's average variable cost function in 2005 is estimated to be
Bartech expects to face fixed costs of $12,000 in 2009.-What is the minimum average variable cost?
A) $0
B) $5.50
C) $6.00
D) $6.50
E) $7.00
فتح الحزمة
افتح القفل للوصول البطاقات البالغ عددها 58 في هذه المجموعة.
فتح الحزمة
k this deck
14
suppose that the 2009 price forecast is drastically revised downward to $5.
-What is Bartech's profit-maximizing (or loss-minimizing) output for 2009?
A) 0 units
B) 1,000 units
C) 2,000 units
D) 3,000 units
E) 4,000 units
-What is Bartech's profit-maximizing (or loss-minimizing) output for 2009?
A) 0 units
B) 1,000 units
C) 2,000 units
D) 3,000 units
E) 4,000 units
فتح الحزمة
افتح القفل للوصول البطاقات البالغ عددها 58 في هذه المجموعة.
فتح الحزمة
k this deck
15
Use the following information
Radon Research Corporation (RRC) is one of 24 firms in Albuquerque testing homes for dangerous levels of radon gas. There is a standard test that all testing companies use. The manager of RRC wants to know the number of homes to test in 2009 in order to maximize the firm's profit. The manager forecasted a price of $160 for radon tests in 2009.
The firm's marginal cost was estimated as
where Q is the number of tests performed each week. RRC's fixed cost will be $250 per week.
-The weekly profit (loss) at RRC in 2009 will be
A) $121
B) $320
C) $86 -$61
D)-$121
Radon Research Corporation (RRC) is one of 24 firms in Albuquerque testing homes for dangerous levels of radon gas. There is a standard test that all testing companies use. The manager of RRC wants to know the number of homes to test in 2009 in order to maximize the firm's profit. The manager forecasted a price of $160 for radon tests in 2009.
The firm's marginal cost was estimated as
where Q is the number of tests performed each week. RRC's fixed cost will be $250 per week.-The weekly profit (loss) at RRC in 2009 will be
A) $121
B) $320
C) $86 -$61
D)-$121
فتح الحزمة
افتح القفل للوصول البطاقات البالغ عددها 58 في هذه المجموعة.
فتح الحزمة
k this deck
16
Average variable cost at Sport Tee is
A) 12 - 0.01Q + 0.0000024Q2
B) 12 - 0.0025Q + 0.000000266Q2
C) 12 - 0.0001Q + 0.000001Q2
D) 12Q - 0.0025Q2 + 0.000000266Q3
E) none of the above
A) 12 - 0.01Q + 0.0000024Q2
B) 12 - 0.0025Q + 0.000000266Q2
C) 12 - 0.0001Q + 0.000001Q2
D) 12Q - 0.0025Q2 + 0.000000266Q3
E) none of the above
فتح الحزمة
افتح القفل للوصول البطاقات البالغ عددها 58 في هذه المجموعة.
فتح الحزمة
k this deck
17
To maximize profit how many T-shirts should be produced and sold each month?
A) 1,000
B) 2,000
C) 3,000
D) 4,000
E) 5,000
A) 1,000
B) 2,000
C) 3,000
D) 4,000
E) 5,000
فتح الحزمة
افتح القفل للوصول البطاقات البالغ عددها 58 في هذه المجموعة.
فتح الحزمة
k this deck
18
At the profit-maximizing level of output total revenue will be
A) $10,000
B) $15,000
C) $20,000
D) $25,000
E) $35,000
A) $10,000
B) $15,000
C) $20,000
D) $25,000
E) $35,000
فتح الحزمة
افتح القفل للوصول البطاقات البالغ عددها 58 في هذه المجموعة.
فتح الحزمة
k this deck
19
Monthly profit will be
A)-$2,000
B)-$1,150
C) $4,250
D) $3,400
E) $2,250
A)-$2,000
B)-$1,150
C) $4,250
D) $3,400
E) $2,250
فتح الحزمة
افتح القفل للوصول البطاقات البالغ عددها 58 في هذه المجموعة.
فتح الحزمة
k this deck
20
A perfectly competitive firm's demand is ____________ elastic and equal to ____________ which is equal to ____________.
فتح الحزمة
افتح القفل للوصول البطاقات البالغ عددها 58 في هذه المجموعة.
فتح الحزمة
k this deck
21
Use the following graph on a competitive firm's short-run cost curves to answer this question.
The price of the product is $35.
-The firm produces ____________ units of output. Total revenue is $____________ and total cost is $____________.
The price of the product is $35.
-The firm produces ____________ units of output. Total revenue is $____________ and total cost is $____________.
فتح الحزمة
افتح القفل للوصول البطاقات البالغ عددها 58 في هذه المجموعة.
فتح الحزمة
k this deck
22
Use the following graph on a competitive firm's short-run cost curves to answer this question.
The price of the product is $35.
-The firm makes a profit (loss) of $____________.
The price of the product is $20.
The price of the product is $35.
-The firm makes a profit (loss) of $____________.
The price of the product is $20.
فتح الحزمة
افتح القفل للوصول البطاقات البالغ عددها 58 في هذه المجموعة.
فتح الحزمة
k this deck
23
Use the following graph on a competitive firm's short-run cost curves to answer this question.
The price of the product is $35.
-The firm produces ______ units of output. Total revenue is $____________ and total cost is $____________.
The price of the product is $35.
-The firm produces ______ units of output. Total revenue is $____________ and total cost is $____________.
فتح الحزمة
افتح القفل للوصول البطاقات البالغ عددها 58 في هذه المجموعة.
فتح الحزمة
k this deck
24
Use the following graph on a competitive firm's short-run cost curves to answer this question.
The price of the product is $35.
-The firm makes a profit (loss) of $____________.
The price of the product is $35.
-The firm makes a profit (loss) of $____________.
فتح الحزمة
افتح القفل للوصول البطاقات البالغ عددها 58 في هذه المجموعة.
فتح الحزمة
k this deck
25
Use the following graph on a competitive firm's short-run cost curves to answer this question.
The price of the product is $35.
-The firm's total revenue at a price of $20 covers all of its variable cost, and the firm has $____________ left to apply toward paying its ________________________. If the firm shuts down and produces nothing it would lose an amount equal to its _________________
The price of the product is $35.
-The firm's total revenue at a price of $20 covers all of its variable cost, and the firm has $____________ left to apply toward paying its ________________________. If the firm shuts down and produces nothing it would lose an amount equal to its _________________
فتح الحزمة
افتح القفل للوصول البطاقات البالغ عددها 58 في هذه المجموعة.
فتح الحزمة
k this deck
26
Use the following graph on a competitive firm's short-run cost curves to answer this question.
The price of the product is $35.
-At any price below (approximately) $_________, the firm would shut down.
The price of the product is $35.
-At any price below (approximately) $_________, the firm would shut down.
فتح الحزمة
افتح القفل للوصول البطاقات البالغ عددها 58 في هذه المجموعة.
فتح الحزمة
k this deck
27
In long-run competitive equilibrium, product price equals __________________ and also equals __________________. Thus, economic profit equals $___________, however, firms have not incentive to exit the industry because each firm earns enough revenue to cover all its explicit costs of operation and pay its owners an amount equal to ______________________________.
فتح الحزمة
افتح القفل للوصول البطاقات البالغ عددها 58 في هذه المجموعة.
فتح الحزمة
k this deck
28
Firms in a perfectly competitive industry are earning an economic profit.
-Product price will ___________ because ______________________________.
-Product price will ___________ because ______________________________.
فتح الحزمة
افتح القفل للوصول البطاقات البالغ عددها 58 في هذه المجموعة.
فتح الحزمة
k this deck
29
Firms in a perfectly competitive industry are earning an economic profit.
-After long-run competitive equilibrium comes about there will be ___________ (fewer, more, the same number of) firms in the industry and the industry will produce __________ (less, more, the same amount of) output.
-After long-run competitive equilibrium comes about there will be ___________ (fewer, more, the same number of) firms in the industry and the industry will produce __________ (less, more, the same amount of) output.
فتح الحزمة
افتح القفل للوصول البطاقات البالغ عددها 58 في هذه المجموعة.
فتح الحزمة
k this deck
30
Firms in a perfectly competitive industry are earning an economic profit.
-In long-run competitive equilibrium each firm will earn ___________ economic profit.
-In long-run competitive equilibrium each firm will earn ___________ economic profit.
فتح الحزمة
افتح القفل للوصول البطاقات البالغ عددها 58 في هذه المجموعة.
فتح الحزمة
k this deck
31
The following graph showing a perfectly competitive firm's long-run cost curves.
-If price is $70, the firm will produce __________ units of output.
-If price is $70, the firm will produce __________ units of output.
فتح الحزمة
افتح القفل للوصول البطاقات البالغ عددها 58 في هذه المجموعة.
فتح الحزمة
k this deck
32
The following graph showing a perfectly competitive firm's long-run cost curves.
-If price is $70, total revenue will be $__________ and total cost will be $__________.
-If price is $70, total revenue will be $__________ and total cost will be $__________.
فتح الحزمة
افتح القفل للوصول البطاقات البالغ عددها 58 في هذه المجموعة.
فتح الحزمة
k this deck
33
The following graph showing a perfectly competitive firm's long-run cost curves.
-If price is $70, the firm makes $__________ economic profit.
-If price is $70, the firm makes $__________ economic profit.
فتح الحزمة
افتح القفل للوصول البطاقات البالغ عددها 58 في هذه المجموعة.
فتح الحزمة
k this deck
34
The following graph showing a perfectly competitive firm's long-run cost curves.
-In long-run competitive equilibrium, the firm will produce __________ units of output and sell them at a price of $________ if this is a constant cost industry.
-In long-run competitive equilibrium, the firm will produce __________ units of output and sell them at a price of $________ if this is a constant cost industry.
فتح الحزمة
افتح القفل للوصول البطاقات البالغ عددها 58 في هذه المجموعة.
فتح الحزمة
k this deck
35
The following graph showing a perfectly competitive firm's long-run cost curves.
-In long-run equilibrium, the firm's economic profit is $_________.
-In long-run equilibrium, the firm's economic profit is $_________.
فتح الحزمة
افتح القفل للوصول البطاقات البالغ عددها 58 في هذه المجموعة.
فتح الحزمة
k this deck
36
The following figure shows a competitive firm's ARP and MRP curves.
-If the wage rate is $20, how many workers will the firm hire? ________.
-If the wage rate is $20, how many workers will the firm hire? ________.
فتح الحزمة
افتح القفل للوصول البطاقات البالغ عددها 58 في هذه المجموعة.
فتح الحزمة
k this deck
37
The following figure shows a competitive firm's ARP and MRP curves.
-If the wage rate is $30, how many workers will the firm hire? ________.
-If the wage rate is $30, how many workers will the firm hire? ________.
فتح الحزمة
افتح القفل للوصول البطاقات البالغ عددها 58 في هذه المجموعة.
فتح الحزمة
k this deck
38
The following figure shows a competitive firm's ARP and MRP curves.
-If the wage is $60, how many workers will the firm hire? ________. How much output will the firm produce? ________.
-If the wage is $60, how many workers will the firm hire? ________. How much output will the firm produce? ________.
فتح الحزمة
افتح القفل للوصول البطاقات البالغ عددها 58 في هذه المجموعة.
فتح الحزمة
k this deck
39
A perfectly competitive firm in the short run will
-Produce the output at which _____________________ equals __________________ and make an economic profit if price exceeds __________________.
-Produce the output at which _____________________ equals __________________ and make an economic profit if price exceeds __________________.
فتح الحزمة
افتح القفل للوصول البطاقات البالغ عددها 58 في هذه المجموعة.
فتح الحزمة
k this deck
40
A perfectly competitive firm in the short run will
-Produce the output at which __________________ equals __________________ and make a loss if price is between __________________ and __________________.
-Produce the output at which __________________ equals __________________ and make a loss if price is between __________________ and __________________.
فتح الحزمة
افتح القفل للوصول البطاقات البالغ عددها 58 في هذه المجموعة.
فتح الحزمة
k this deck
41
A perfectly competitive firm in the short run will
-Shut down if price is below ________________________ and make a loss of __________________.
-Shut down if price is below ________________________ and make a loss of __________________.
فتح الحزمة
افتح القفل للوصول البطاقات البالغ عددها 58 في هذه المجموعة.
فتح الحزمة
k this deck
42
A competitive firm estimates its average variable cost function to be . The firm's total fixed cost is $3,500.
-The marginal cost function associated with this average variable cost function is
SMC =__________________________.
The firm's total fixed cost is $3,500.-The marginal cost function associated with this average variable cost function is
SMC =__________________________.
فتح الحزمة
افتح القفل للوصول البطاقات البالغ عددها 58 في هذه المجموعة.
فتح الحزمة
k this deck
43
A competitive firm estimates its average variable cost function to be . The firm's total fixed cost is $3,500.
-AVC reaches its minimum at ______units of output. Minimum AVC is $_________.
The firm's total fixed cost is $3,500.-AVC reaches its minimum at ______units of output. Minimum AVC is $_________.
فتح الحزمة
افتح القفل للوصول البطاقات البالغ عددها 58 في هذه المجموعة.
فتح الحزمة
k this deck
44
A competitive firm estimates its average variable cost function to be . The firm's total fixed cost is $3,500.
-Suppose the price of the product is P = $125. The firm should produce _________ units of output. The firm earns a profit (loss) of $__________________.
The firm's total fixed cost is $3,500.-Suppose the price of the product is P = $125. The firm should produce _________ units of output. The firm earns a profit (loss) of $__________________.
فتح الحزمة
افتح القفل للوصول البطاقات البالغ عددها 58 في هذه المجموعة.
فتح الحزمة
k this deck
45
A competitive firm estimates its average variable cost function to be . The firm's total fixed cost is $3,500.
-Suppose the price of the product is P = $115. The firm should now produce _________ units of output. Its profit (loss) will be $_________.
The firm's total fixed cost is $3,500.-Suppose the price of the product is P = $115. The firm should now produce _________ units of output. Its profit (loss) will be $_________.
فتح الحزمة
افتح القفل للوصول البطاقات البالغ عددها 58 في هذه المجموعة.
فتح الحزمة
k this deck
46
A competitive firm estimates its average variable cost function to be . The firm's total fixed cost is $3,500.
-Suppose the price of the product falls to P = $100. The firm should produce _________ units of output. Its profit (loss) will be $____________.
The firm's total fixed cost is $3,500.-Suppose the price of the product falls to P = $100. The firm should produce _________ units of output. Its profit (loss) will be $____________.
فتح الحزمة
افتح القفل للوصول البطاقات البالغ عددها 58 في هذه المجموعة.
فتح الحزمة
k this deck
47
A competitive firm has estimated its average variable cost function as
Its total fixed cost is $500.
-The marginal cost function associated with this AVC function is
SMC = ________________.
Its total fixed cost is $500.-The marginal cost function associated with this AVC function is
SMC = ________________.
فتح الحزمة
افتح القفل للوصول البطاقات البالغ عددها 58 في هذه المجموعة.
فتح الحزمة
k this deck
48
A competitive firm has estimated its average variable cost function as
Its total fixed cost is $500.
-AVC reaches its minimum at _________ units of output at which AVC = $__________.
The forecasted price is P = $23.60.
Its total fixed cost is $500.-AVC reaches its minimum at _________ units of output at which AVC = $__________.
The forecasted price is P = $23.60.
فتح الحزمة
افتح القفل للوصول البطاقات البالغ عددها 58 في هذه المجموعة.
فتح الحزمة
k this deck
49
A competitive firm has estimated its average variable cost function as
Its total fixed cost is $500.
-To maximize its profit the firm should produce ___________ units of output. Profit (loss) is $____________.
Suppose the forecasted price is P = $14.94.
Its total fixed cost is $500.-To maximize its profit the firm should produce ___________ units of output. Profit (loss) is $____________.
Suppose the forecasted price is P = $14.94.
فتح الحزمة
افتح القفل للوصول البطاقات البالغ عددها 58 في هذه المجموعة.
فتح الحزمة
k this deck
50
A competitive firm has estimated its average variable cost function as
Its total fixed cost is $500.
-To maximize its profit, the firm should produce ___________ units of output. Profit (loss) is $__________.
Suppose the forecasted price is P = $10.
Its total fixed cost is $500.-To maximize its profit, the firm should produce ___________ units of output. Profit (loss) is $__________.
Suppose the forecasted price is P = $10.
فتح الحزمة
افتح القفل للوصول البطاقات البالغ عددها 58 في هذه المجموعة.
فتح الحزمة
k this deck
51
A competitive firm has estimated its average variable cost function as
Its total fixed cost is $500.
-The firm should produce ____________ units of output for a profit (loss) of $____________.
Its total fixed cost is $500.-The firm should produce ____________ units of output for a profit (loss) of $____________.
فتح الحزمة
افتح القفل للوصول البطاقات البالغ عددها 58 في هذه المجموعة.
فتح الحزمة
k this deck
52
The figure below shows a long-run industry supply curve (SLR) and the demand curve (D) facing the competitive industry. The firms in this industry employ inputs of varying quality and productivity.
-The long-run marginal cost of producing the 20,000th unit of output is $________.
-The long-run marginal cost of producing the 20,000th unit of output is $________.
فتح الحزمة
افتح القفل للوصول البطاقات البالغ عددها 58 في هذه المجموعة.
فتح الحزمة
k this deck
53
The figure below shows a long-run industry supply curve (SLR) and the demand curve (D) facing the competitive industry. The firms in this industry employ inputs of varying quality and productivity.
-If the firms in this industry produce a total industry output of 20,000 units, every firm produces at the minimum long-run average cost of $_______ per unit and earns $________ of economic profit.
-If the firms in this industry produce a total industry output of 20,000 units, every firm produces at the minimum long-run average cost of $_______ per unit and earns $________ of economic profit.
فتح الحزمة
افتح القفل للوصول البطاقات البالغ عددها 58 في هذه المجموعة.
فتح الحزمة
k this deck
54
The figure below shows a long-run industry supply curve (SLR) and the demand curve (D) facing the competitive industry. The firms in this industry employ inputs of varying quality and productivity.
-In long-run competitive equilibrium, the industry will produce ________ units of the good and sell these units at the market-clearing price of $______ per unit.
-In long-run competitive equilibrium, the industry will produce ________ units of the good and sell these units at the market-clearing price of $______ per unit.
فتح الحزمة
افتح القفل للوصول البطاقات البالغ عددها 58 في هذه المجموعة.
فتح الحزمة
k this deck
55
The figure below shows a long-run industry supply curve (SLR) and the demand curve (D) facing the competitive industry. The firms in this industry employ inputs of varying quality and productivity.
-The long-run marginal cost at the equilibrium output in part c is $_______, and the long-run average cost at the equilibrium output is $_______.
-The long-run marginal cost at the equilibrium output in part c is $_______, and the long-run average cost at the equilibrium output is $_______.
فتح الحزمة
افتح القفل للوصول البطاقات البالغ عددها 58 في هذه المجموعة.
فتح الحزمة
k this deck
56
The figure below shows a long-run industry supply curve (SLR) and the demand curve (D) facing the competitive industry. The firms in this industry employ inputs of varying quality and productivity.
-"The firms employing the superior inputs have lower costs than their rivals, but they still cannot earn any profit." Is this statement true or false?
-"The firms employing the superior inputs have lower costs than their rivals, but they still cannot earn any profit." Is this statement true or false?
فتح الحزمة
افتح القفل للوصول البطاقات البالغ عددها 58 في هذه المجموعة.
فتح الحزمة
k this deck
57
The figure below shows a long-run industry supply curve (SLR) and the demand curve (D) facing the competitive industry. The firms in this industry employ inputs of varying quality and productivity.
-Total producer surplus in long-run competitive equilibrium is $_________ for this industry.
-Total producer surplus in long-run competitive equilibrium is $_________ for this industry.
فتح الحزمة
افتح القفل للوصول البطاقات البالغ عددها 58 في هذه المجموعة.
فتح الحزمة
k this deck
58
The figure below shows a long-run industry supply curve (SLR) and the demand curve (D) facing the competitive industry. The firms in this industry employ inputs of varying quality and productivity.
-______________________ get the producer surplus calculated in part f.
-______________________ get the producer surplus calculated in part f.
فتح الحزمة
افتح القفل للوصول البطاقات البالغ عددها 58 في هذه المجموعة.
فتح الحزمة
k this deck
فتح الحزمة
افتح القفل للوصول البطاقات البالغ عددها 58 في هذه المجموعة.


