Deck 7: Introduction to Descriptive Methods
ملء الشاشة (f)
سؤال
سؤال
سؤال
سؤال
سؤال
سؤال
سؤال
سؤال
سؤال
سؤال
سؤال
سؤال
سؤال
سؤال
سؤال
سؤال
سؤال
سؤال
سؤال
سؤال
سؤال
سؤال
سؤال
سؤال
سؤال
سؤال
سؤال
سؤال
سؤال
Which scatterplot suggests that there is no relationship between variables X and Y?
A)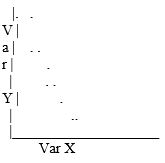
B)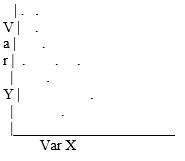
C)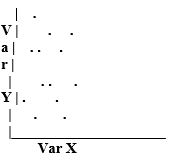
D)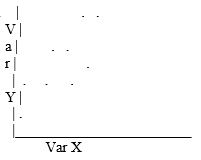
A)
B)
C)
D)
سؤال
Which scatterplot indicates a positive correlation between variables X and Y?
A)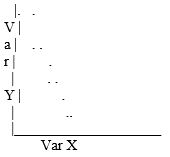
B)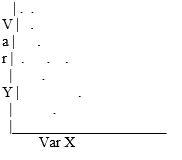
C)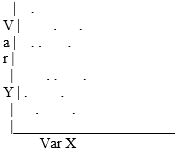
D)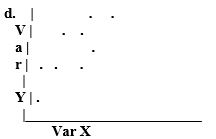
A)
B)
C)
D)
سؤال
سؤال
سؤال
سؤال
سؤال
سؤال
سؤال
سؤال
سؤال
سؤال
Which scatterplot demonstrates the strongest relationship between variables X and Y?
A)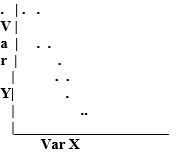
B)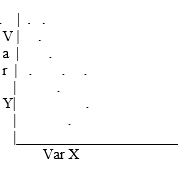
C)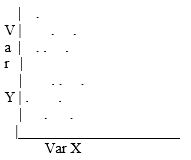
D)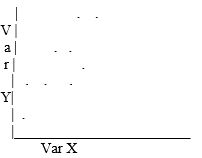
A)
B)
C)
D)
سؤال
سؤال
سؤال
سؤال
سؤال
سؤال
سؤال
سؤال
سؤال
سؤال
سؤال
سؤال
سؤال
سؤال
سؤال
سؤال
سؤال
سؤال
سؤال
سؤال
سؤال
سؤال
سؤال
سؤال

فتح الحزمة
قم بالتسجيل لفتح البطاقات في هذه المجموعة!
Unlock Deck
Unlock Deck
1/64
العب
ملء الشاشة (f)
Deck 7: Introduction to Descriptive Methods
1
A correlation between two events allows us to say
A) that one event caused another
B) that two events are related
C) no relationship exists between the two events
D) the events are highly likely to occur together
A) that one event caused another
B) that two events are related
C) no relationship exists between the two events
D) the events are highly likely to occur together
that two events are related
2
Correlation does not imply
A) description
B) causation
C) prediction
D) relationship
A) description
B) causation
C) prediction
D) relationship
causation
3
_______ studies allow us to attribute causality to a relationship, whereas ______ studies allow us to determine the existence of a relationship.
A) experimental; correlational
B) statistical; experimental
C) correlational; statistical
D) correlational; experimental
A) experimental; correlational
B) statistical; experimental
C) correlational; statistical
D) correlational; experimental
experimental; correlational
4
Which of the following goals of science is the first step to all of the remaining goals?
A) understanding
B) explanation
C) prediction
D) description
A) understanding
B) explanation
C) prediction
D) description
فتح الحزمة
افتح القفل للوصول البطاقات البالغ عددها 64 في هذه المجموعة.
فتح الحزمة
k this deck
5
Descriptive research can do which of the following?
A) stimulate causal hypotheses
B) increase our ability to predict behavior
C) establish causality
D) a and b
A) stimulate causal hypotheses
B) increase our ability to predict behavior
C) establish causality
D) a and b
فتح الحزمة
افتح القفل للوصول البطاقات البالغ عددها 64 في هذه المجموعة.
فتح الحزمة
k this deck
6
Which of the following is NOT an important goal of science?
A) description
B) prediction
C) explanation
D) none of the above; all are important goals
A) description
B) prediction
C) explanation
D) none of the above; all are important goals
فتح الحزمة
افتح القفل للوصول البطاقات البالغ عددها 64 في هذه المجموعة.
فتح الحزمة
k this deck
7
Which of the following are difficult to do without using scientific methods?
A) accurately measuring psychological variables
B) determining the extent to which variables are related
C) accurately generalizing from a sample to a population
D) all of the above
A) accurately measuring psychological variables
B) determining the extent to which variables are related
C) accurately generalizing from a sample to a population
D) all of the above
فتح الحزمة
افتح القفل للوصول البطاقات البالغ عددها 64 في هذه المجموعة.
فتح الحزمة
k this deck
8
If we find a positive correlation between going to therapy and mental health, we know that
A) therapy increases mental health.
B) being well-adjusted causes one to go to therapy.
C) more affluent people go to therapy
D) people in therapy are in better mental health than those who do not go to therapy.
A) therapy increases mental health.
B) being well-adjusted causes one to go to therapy.
C) more affluent people go to therapy
D) people in therapy are in better mental health than those who do not go to therapy.
فتح الحزمة
افتح القفل للوصول البطاقات البالغ عددها 64 في هذه المجموعة.
فتح الحزمة
k this deck
9
Illusory correlation refers to a
A) correlation that is not statistically significant
B) correlation that exceeds the value of +1.00
C) cluster of points on a scatterplot that suggests a correlation between two variables
D) perception of a relationship between two variables when none actually exists
A) correlation that is not statistically significant
B) correlation that exceeds the value of +1.00
C) cluster of points on a scatterplot that suggests a correlation between two variables
D) perception of a relationship between two variables when none actually exists
فتح الحزمة
افتح القفل للوصول البطاقات البالغ عددها 64 في هذه المجموعة.
فتح الحزمة
k this deck
10
In looking at two variables, people may
A) see a relationship even though none exists
B) see a negative correlation when a positive correlation exists
C) see a positive correlation when a negative correlation exists
D) all of the above
A) see a relationship even though none exists
B) see a negative correlation when a positive correlation exists
C) see a positive correlation when a negative correlation exists
D) all of the above
فتح الحزمة
افتح القفل للوصول البطاقات البالغ عددها 64 في هذه المجموعة.
فتح الحزمة
k this deck
11
In generalizing from their experience to the world as a whole,
A) people have trouble because their experience is only a small sample of experience
B) people have trouble because their experience is not a random sample of experience
C) people have trouble because they can't discount the role of coincidence
D) all of the above
A) people have trouble because their experience is only a small sample of experience
B) people have trouble because their experience is not a random sample of experience
C) people have trouble because they can't discount the role of coincidence
D) all of the above
فتح الحزمة
افتح القفل للوصول البطاقات البالغ عددها 64 في هذه المجموعة.
فتح الحزمة
k this deck
12
If you do ex post facto research, your data will probably have which of the following advantages over collected and previously tabulated archival research?
A) higher internal validity
B) higher external validity
C) higher construct validity
D) a and b
A) higher internal validity
B) higher external validity
C) higher construct validity
D) a and b
فتح الحزمة
افتح القفل للوصول البطاقات البالغ عددها 64 في هذه المجموعة.
فتح الحزمة
k this deck
13
Ex post facto research is weakest in terms of:
A) internal validity
B) external validity
C) construct validity
D) b and c
A) internal validity
B) external validity
C) construct validity
D) b and c
فتح الحزمة
افتح القفل للوصول البطاقات البالغ عددها 64 في هذه المجموعة.
فتح الحزمة
k this deck
14
Archival research is considered to be a nonreactive method of data collection because
A) the compilers of the archives will be deceased at the time of the archival analysis
B) most often the records were kept for reasons unrelated to behavioral research
C) archival records may be assumed to be error free
D) studying public records never poses questions of ethics or values
A) the compilers of the archives will be deceased at the time of the archival analysis
B) most often the records were kept for reasons unrelated to behavioral research
C) archival records may be assumed to be error free
D) studying public records never poses questions of ethics or values
فتح الحزمة
افتح القفل للوصول البطاقات البالغ عددها 64 في هذه المجموعة.
فتح الحزمة
k this deck
15
Which of the following is least likely to be a weakness of collected and tabulated archival data?
A) Data may be about groups (aggregated data) rather than data about individuals.
B) Data may lack construct validity.
C) Data may lack external validity.
D) Data may be tainted by the instrumentation bias.
A) Data may be about groups (aggregated data) rather than data about individuals.
B) Data may lack construct validity.
C) Data may lack external validity.
D) Data may be tainted by the instrumentation bias.
فتح الحزمة
افتح القفل للوصول البطاقات البالغ عددها 64 في هذه المجموعة.
فتح الحزمة
k this deck
16
Trying to categorize a wide range of free responses in an objective manner, such as looking for the amount of sexism in writtendocuments is referred to as
A) the archival method
B) narrative analysis
C) ex post facto research
D) content analysis
A) the archival method
B) narrative analysis
C) ex post facto research
D) content analysis
فتح الحزمة
افتح القفل للوصول البطاقات البالغ عددها 64 في هذه المجموعة.
فتح الحزمة
k this deck
17
Which of the following is true of content analysis?
A) it can be done by computer
B) it is perfectly objective
C) when it is objective, it is valid
D) good content analysis helps a study's internal validity
A) it can be done by computer
B) it is perfectly objective
C) when it is objective, it is valid
D) good content analysis helps a study's internal validity
فتح الحزمة
افتح القفل للوصول البطاقات البالغ عددها 64 في هذه المجموعة.
فتح الحزمة
k this deck
18
Which of the following is NOT good advice for doing a content analysis?
A) before developing a content analysis scheme, do a mini-study to determine the type of material you will be coding
B) review the research literature to see if there are pre-existing coding schemes that you could modify
C) provide raters with examples of behavior that would fall into each category
D) do not try to control raters by training them or restricting their freedom to make subjective judgments
فتح الحزمة
افتح القفل للوصول البطاقات البالغ عددها 64 في هذه المجموعة.
فتح الحزمة
k this deck
19
The construct validity of archival data that is already coded (e.g., government data) is LEAST likely to be weak because of
A) reactivity
B) instrumentation bias
C) poor match between the measure and the construct
D) both a and b
A) reactivity
B) instrumentation bias
C) poor match between the measure and the construct
D) both a and b
فتح الحزمة
افتح القفل للوصول البطاقات البالغ عددها 64 في هذه المجموعة.
فتح الحزمة
k this deck
20
Content analyzed archival data, relative to archival data coded by others, should be less vulnerable to
A) reactivity
B) instrumentation bias
C) poor match between the measure and the construct
D) both b and c
A) reactivity
B) instrumentation bias
C) poor match between the measure and the construct
D) both b and c
فتح الحزمة
افتح القفل للوصول البطاقات البالغ عددها 64 في هذه المجموعة.
فتح الحزمة
k this deck
21
With observation, you run into the problem of
A) the observer having an effect on the observed
B) objectively coding your data
C) both a and b
D) neither a nor b; these are not problems in observational research
A) the observer having an effect on the observed
B) objectively coding your data
C) both a and b
D) neither a nor b; these are not problems in observational research
فتح الحزمة
افتح القفل للوصول البطاقات البالغ عددها 64 في هذه المجموعة.
فتح الحزمة
k this deck
22
A researcher spends several weeks suspended underwater so that he can study shark behavior. Initially the sharks attack the cage, but later the sharks ignore it. This is an example of
A) a true experiment
B) a quasi-experiment
C) participant observation
D) naturalistic observation
A) a true experiment
B) a quasi-experiment
C) participant observation
D) naturalistic observation
فتح الحزمة
افتح القفل للوصول البطاقات البالغ عددها 64 في هذه المجموعة.
فتح الحزمة
k this deck
23
If you enter several bars and lounges over a period of weeks, and secretly observe and take notes on male-female interactions, you are using the ________ method of research.
A) archival
B) experimental
C) ex post facto
D) naturalistic observation
A) archival
B) experimental
C) ex post facto
D) naturalistic observation
فتح الحزمة
افتح القفل للوصول البطاقات البالغ عددها 64 في هذه المجموعة.
فتح الحزمة
k this deck
24
With testing, ____ is usually less of a problem than with other descriptive methods.
A) construct validity
B) internal validity
C) external validity
D) a and b
A) construct validity
B) internal validity
C) external validity
D) a and b
فتح الحزمة
افتح القفل للوصول البطاقات البالغ عددها 64 في هذه المجموعة.
فتح الحزمة
k this deck
25
Reactivity is least likely to be a problem in _____ research.
A) ex post facto
B) archival
C) observational
D) testing
A) ex post facto
B) archival
C) observational
D) testing
فتح الحزمة
افتح القفل للوصول البطاقات البالغ عددها 64 في هذه المجموعة.
فتح الحزمة
k this deck
26
Objectivity is most likely to be a problem in _____ research.
A) ex post facto
B) archival
C) observational
D) testing
A) ex post facto
B) archival
C) observational
D) testing
فتح الحزمة
افتح القفل للوصول البطاقات البالغ عددها 64 في هذه المجموعة.
فتح الحزمة
k this deck
27
Scatterplots
A) depict relationships as a cluster of dots
B) provide a preview of the fully measured relationship
C) show any pronounced curvilinearity in the data
D) both a and c
A) depict relationships as a cluster of dots
B) provide a preview of the fully measured relationship
C) show any pronounced curvilinearity in the data
D) both a and c
فتح الحزمة
افتح القفل للوصول البطاقات البالغ عددها 64 في هذه المجموعة.
فتح الحزمة
k this deck
28
A dot cluster that tilts from upper left to lower right reflects
A) little or no correlation
B) a positive correlation
C) a negative correlation
D) a curvilinear correlation
A) little or no correlation
B) a positive correlation
C) a negative correlation
D) a curvilinear correlation
فتح الحزمة
افتح القفل للوصول البطاقات البالغ عددها 64 في هذه المجموعة.
فتح الحزمة
k this deck
29
Which scatterplot suggests that there is no relationship between variables X and Y?
A)
B)
C)
D)
A)
B)
C)
D)
فتح الحزمة
افتح القفل للوصول البطاقات البالغ عددها 64 في هذه المجموعة.
فتح الحزمة
k this deck
30
Which scatterplot indicates a positive correlation between variables X and Y?
A)
B)
C)
D)
A)
B)
C)
D)
فتح الحزمة
افتح القفل للوصول البطاقات البالغ عددها 64 في هذه المجموعة.
فتح الحزمة
k this deck
31
A large and negative correlation coefficient means that
A) high scores on one variable are associated with high scores on the other
B) low scores on one variable are associated with low scores on the other
C) high scores on one variable are associated with low scores on the other
D) the variables are not related
A) high scores on one variable are associated with high scores on the other
B) low scores on one variable are associated with low scores on the other
C) high scores on one variable are associated with low scores on the other
D) the variables are not related
فتح الحزمة
افتح القفل للوصول البطاقات البالغ عددها 64 في هذه المجموعة.
فتح الحزمة
k this deck
32
Without doing any calculations, describe the relationship for the following pairs of observations.
A) positive
B) negative
C) little or no relationship
D) curvilinear
A) positive
B) negative
C) little or no relationship
D) curvilinear
فتح الحزمة
افتح القفل للوصول البطاقات البالغ عددها 64 في هذه المجموعة.
فتح الحزمة
k this deck
33
Pearson's r can range from
A) .00 to +1.00
B) -2.00 to +2.00
C) -.50 to +1.00
D) -1.00 to +1.00
A) .00 to +1.00
B) -2.00 to +2.00
C) -.50 to +1.00
D) -1.00 to +1.00
فتح الحزمة
افتح القفل للوصول البطاقات البالغ عددها 64 في هذه المجموعة.
فتح الحزمة
k this deck
34
If you measured the relationship between weight and intelligence, and found the correlation coefficient to be equal to +2.47, you would conclude that
A) the higher the weight, the greater the intelligence
B) the lower the weight, the greater the intelligence
C) you must have a bad sample; weight and intelligence cannot be correlated
D) you made an arithmetic error
A) the higher the weight, the greater the intelligence
B) the lower the weight, the greater the intelligence
C) you must have a bad sample; weight and intelligence cannot be correlated
D) you made an arithmetic error
فتح الحزمة
افتح القفل للوصول البطاقات البالغ عددها 64 في هذه المجموعة.
فتح الحزمة
k this deck
35
If there is no relationship between two variables, the value of the correlation coefficient should be closest to
A) -1.00
B) 0.00
C) .50
D) +1.00
A) -1.00
B) 0.00
C) .50
D) +1.00
فتح الحزمة
افتح القفل للوصول البطاقات البالغ عددها 64 في هذه المجموعة.
فتح الحزمة
k this deck
36
If two variables are perfectly correlated, the correlation coefficient will have a value of
A) +1.00
B) -1.00
C) 0.00
D) +1.00 or -1.00
A) +1.00
B) -1.00
C) 0.00
D) +1.00 or -1.00
فتح الحزمة
افتح القفل للوصول البطاقات البالغ عددها 64 في هذه المجموعة.
فتح الحزمة
k this deck
37
A correlation coefficient of -.87 means that there is
A) a strong but not perfect relationship
B) a perfect relationship
C) a very weak relationship
D) no relationship
A) a strong but not perfect relationship
B) a perfect relationship
C) a very weak relationship
D) no relationship
فتح الحزمة
افتح القفل للوصول البطاقات البالغ عددها 64 في هذه المجموعة.
فتح الحزمة
k this deck
38
Which of the following correlation coefficients indicates the strongest relationship between two variables?
A) +.42
B) +.89
C) +1.26
D) -.91
A) +.42
B) +.89
C) +1.26
D) -.91
فتح الحزمة
افتح القفل للوصول البطاقات البالغ عددها 64 في هذه المجموعة.
فتح الحزمة
k this deck
39
Which of the following correlations represents the strongest relationship?
A) +0.90
B) +0.45
C) -0.37
D) -0.93
A) +0.90
B) +0.45
C) -0.37
D) -0.93
فتح الحزمة
افتح القفل للوصول البطاقات البالغ عددها 64 في هذه المجموعة.
فتح الحزمة
k this deck
40
Which scatterplot demonstrates the strongest relationship between variables X and Y?
A)
B)
C)
D)
A)
B)
C)
D)
فتح الحزمة
افتح القفل للوصول البطاقات البالغ عددها 64 في هذه المجموعة.
فتح الحزمة
k this deck
41
The strength of the relationship between two variables is best described by the size of the
A) observational coefficient
B) correlational coefficient
C) experimental coefficient
D) coefficient of determination
A) observational coefficient
B) correlational coefficient
C) experimental coefficient
D) coefficient of determination
فتح الحزمة
افتح القفل للوصول البطاقات البالغ عددها 64 في هذه المجموعة.
فتح الحزمة
k this deck
42
When the correlation coefficient is squared, the resulting number supplies
A) a direct measure of the strength of the relationship
B) an indirect measure of the strength of the relationship
C) information about the direction of the relationship
D) all of the above
A) a direct measure of the strength of the relationship
B) an indirect measure of the strength of the relationship
C) information about the direction of the relationship
D) all of the above
فتح الحزمة
افتح القفل للوصول البطاقات البالغ عددها 64 في هذه المجموعة.
فتح الحزمة
k this deck
43
A correlation between two hypothetical measures is +.80. What percentage of the variability in one measure is accounted for by its relationship with the other measure?
A) 80%
B) 64%
C) 36%
D) 89%
A) 80%
B) 64%
C) 36%
D) 89%
فتح الحزمة
افتح القفل للوصول البطاقات البالغ عددها 64 في هذه المجموعة.
فتح الحزمة
k this deck
44
A correlation of -0.6 indicates that _______ of the variation in Y is explained by X.
A) 6%
B) 12%
C) 36%
D) 60%
A) 6%
B) 12%
C) 36%
D) 60%
فتح الحزمة
افتح القفل للوصول البطاقات البالغ عددها 64 في هذه المجموعة.
فتح الحزمة
k this deck
45
If the correlation between X and Y is -.70, then the percentage ofvariation in Y accounted for by variation in X is
A) 7
B) 35
C) 49
D) 70
A) 7
B) 35
C) 49
D) 70
فتح الحزمة
افتح القفل للوصول البطاقات البالغ عددها 64 في هذه المجموعة.
فتح الحزمة
k this deck
46
If the correlation between X and Y is -.50, then the coefficient of determination is
A) .50
B) -.50
C) .25
D) .10
A) .50
B) -.50
C) .25
D) .10
فتح الحزمة
افتح القفل للوصول البطاقات البالغ عددها 64 في هذه المجموعة.
فتح الحزمة
k this deck
47
Find the median for the following observations 6,4,8,1,2.
A) 3
B) 4
C) 5
D) 8
A) 3
B) 4
C) 5
D) 8
فتح الحزمة
افتح القفل للوصول البطاقات البالغ عددها 64 في هذه المجموعة.
فتح الحزمة
k this deck
48
Using inferential statistics on correlational data
A) is impossible
B) is totally unnecessary
C) allows you to make causal inferences from a random sample
D) allows you to generalize from a random sample to its population
A) is impossible
B) is totally unnecessary
C) allows you to make causal inferences from a random sample
D) allows you to generalize from a random sample to its population
فتح الحزمة
افتح القفل للوصول البطاقات البالغ عددها 64 في هذه المجموعة.
فتح الحزمة
k this deck
49
Strictly speaking, you should use inferential statistics on correlational data
A) never
B) only when you are interested in inferring causality
C) only when you have a random sample of a population
D) always, as long as your data is valid
A) never
B) only when you are interested in inferring causality
C) only when you have a random sample of a population
D) always, as long as your data is valid
فتح الحزمة
افتح القفل للوصول البطاقات البالغ عددها 64 في هذه المجموعة.
فتح الحزمة
k this deck
50
Using median splits so that one can do a t test on correlational data is:
A) a common practice
B) less powerful than testing the significance of the correlation coefficient
C) better than testing the significance of the correlation coefficient because it allows the investigator to determine if a variable caused a certain effect
D) both a and b
A) a common practice
B) less powerful than testing the significance of the correlation coefficient
C) better than testing the significance of the correlation coefficient because it allows the investigator to determine if a variable caused a certain effect
D) both a and b
فتح الحزمة
افتح القفل للوصول البطاقات البالغ عددها 64 في هذه المجموعة.
فتح الحزمة
k this deck
51
If your data is nominal rather than interval, conventional wisdom suggests you should use
A) ANOVAs
B) Chi-square tests
C) median splits
D) Pearson rs
A) ANOVAs
B) Chi-square tests
C) median splits
D) Pearson rs
فتح الحزمة
افتح القفل للوصول البطاقات البالغ عددها 64 في هذه المجموعة.
فتح الحزمة
k this deck
52
. Statistically significant results mean that:
A) the results are important, provided the data are a random sample of some population
B) a causal relationship exists in the sample, provided the data are a random sample of some population
C) a causal relationship exists in the population
D) the results would generalize to the population, provided the data are a random sample of some population
فتح الحزمة
افتح القفل للوصول البطاقات البالغ عددها 64 في هذه المجموعة.
فتح الحزمة
k this deck
53
With a restricted range, the researcher
A) may obtain a very low correlation
B) may not have a broad range of scores
C) may mistakenly assume no relationship among variables
D) all of the above
A) may obtain a very low correlation
B) may not have a broad range of scores
C) may mistakenly assume no relationship among variables
D) all of the above
فتح الحزمة
افتح القفل للوصول البطاقات البالغ عددها 64 في هذه المجموعة.
فتح الحزمة
k this deck
54
Null results may be due to all of the following EXCEPT:
A) conducting too many statistical tests
B) restriction of range
C) too few observations
D) a nonlinear relationship among the variables
A) conducting too many statistical tests
B) restriction of range
C) too few observations
D) a nonlinear relationship among the variables
فتح الحزمة
افتح القفل للوصول البطاقات البالغ عددها 64 في هذه المجموعة.
فتح الحزمة
k this deck
55
A researcher is likely to obtain statistically significant results even when variables aren't related if
A) the researcher conducts too many statistical tests
B) there is restriction of range.
C) there is a nonlinear relationship among the variables
D) the researcher fails to collect enough observations.
A) the researcher conducts too many statistical tests
B) there is restriction of range.
C) there is a nonlinear relationship among the variables
D) the researcher fails to collect enough observations.
فتح الحزمة
افتح القفل للوصول البطاقات البالغ عددها 64 في هذه المجموعة.
فتح الحزمة
k this deck
56
Descriptive research allows you to explain behavior.
فتح الحزمة
افتح القفل للوصول البطاقات البالغ عددها 64 في هذه المجموعة.
فتح الحزمة
k this deck
57
In order to accurately describe behavior, you must use a representative sample of the population you are studying.
فتح الحزمة
افتح القفل للوصول البطاقات البالغ عددها 64 في هذه المجموعة.
فتح الحزمة
k this deck
58
Before you can predict behavior accurately, you need to be able to describe it.
فتح الحزمة
افتح القفل للوصول البطاقات البالغ عددها 64 في هذه المجموعة.
فتح الحزمة
k this deck
59
Archival research uses data that you collected before you came up with your hypothesis.
فتح الحزمة
افتح القفل للوصول البطاقات البالغ عددها 64 في هذه المجموعة.
فتح الحزمة
k this deck
60
Observational techniques are only used in correlational research.
فتح الحزمة
افتح القفل للوصول البطاقات البالغ عددها 64 في هذه المجموعة.
فتح الحزمة
k this deck
61
If you want to increase the construct validity of your correlational research, it is often best to use validated tests.
فتح الحزمة
افتح القفل للوصول البطاقات البالغ عددها 64 في هذه المجموعة.
فتح الحزمة
k this deck
62
A positive correlation of .57 is stronger than a negative correlation of -.63.
فتح الحزمة
افتح القفل للوصول البطاقات البالغ عددها 64 في هذه المجموعة.
فتح الحزمة
k this deck
63
The coefficient of determination tells you the strength of the relationship between two variables.
فتح الحزمة
افتح القفل للوصول البطاقات البالغ عددها 64 في هذه المجموعة.
فتح الحزمة
k this deck
64
If you uncover a relationship that is statistically significant at the .001 level, you can conclude that your variables are most likely causally linked.
فتح الحزمة
افتح القفل للوصول البطاقات البالغ عددها 64 في هذه المجموعة.
فتح الحزمة
k this deck
فتح الحزمة
افتح القفل للوصول البطاقات البالغ عددها 64 في هذه المجموعة.


