Deck 3: Relationships Between Quantitative Variables
ملء الشاشة (f)
سؤال
سؤال
سؤال
سؤال
سؤال
سؤال
Describe the type of association shown in the scatterplot below: 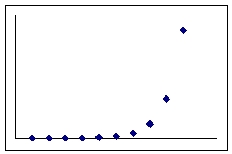
A) Positive linear association
B) Negative linear association
C) Positive curvilinear association
D) Negative curvilinear association
A) Positive linear association
B) Negative linear association
C) Positive curvilinear association
D) Negative curvilinear association
سؤال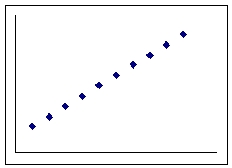
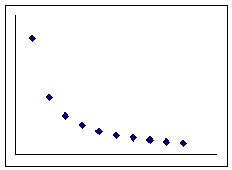
Describe the type of association shown in the scatterplot below: 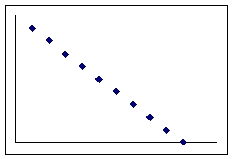
A) Positive linear association
B) Negative linear association
C) Positive curvilinear association
D) Negative curvilinear association
A) Positive linear association
B) Negative linear association
C) Positive curvilinear association
D) Negative curvilinear association
سؤال
سؤال
سؤال
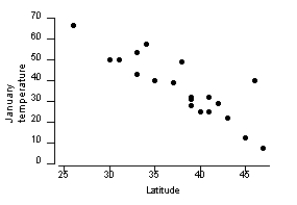
A scatterplot of geographic latitude (X) and average January temperature (Y) for 20 cities in the United States is given below. Is there a positive association or a negative association? Explain what such an association means in the context of this situation.
سؤال
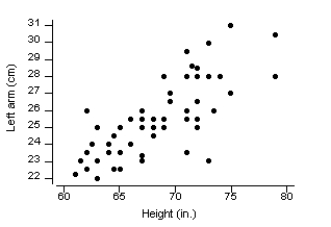
A scatterplot of y = height and x = left forearm length (cm) for 55 college students is given below. Is there a positive association or a negative association? Explain what this association means in the context of this situation.
سؤال
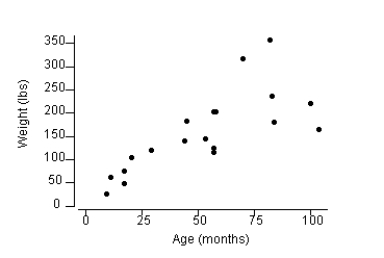
The following plot shows the association between weight (pounds) and age (months) for 19 female bears. Write an interpretation of this plot. Is the association negative or positive? Linear or curvilinear? Are there any outliers?
سؤال
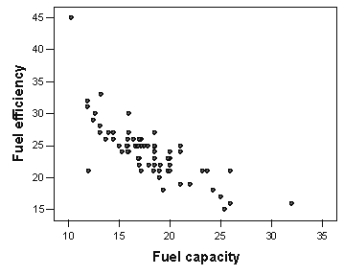
A car salesman is curious if he can predict the fuel efficiency of a car (in MPG) if he knows the fuel capacity of the car (in gallons). He collects data on a variety of makes and models of cars. The scatterplot below shows the association between fuel capacity and fuel efficiency for a sample of 78 cars. Is the association negative or positive? Linear or curvilinear? Are there any outliers?
سؤال
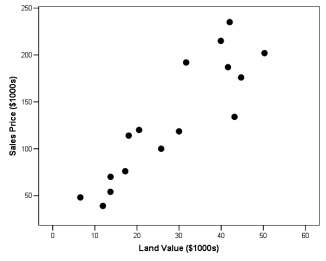
In an attempt to model the relationship between sales price and assessed land value, a realtor has taken a simple random sample of houses recently sold in the area and obtained the following data (both are expressed in thousands of dollars). The scatterplot below shows the association between fuel capacity and fuel efficiency for a sample of 78 cars. Is the association negative or positive? Linear or curvilinear? Are there any outliers?
سؤال
Which graph shows a pattern that would be appropriately described by the equation = + ?
A)
B)
C)

D)
A)
B)
C)
D)
سؤال
سؤال
سؤال
سؤال
سؤال
سؤال
سؤال
سؤال
سؤال
سؤال
سؤال
سؤال
سؤال
سؤال
The following scatterplot shows the relationship between the left and right forearm lengths (cm) for 55 college students along with the regression line, where y = left forearm length x = right forearm length. (Source: physical dataset on the CD.) 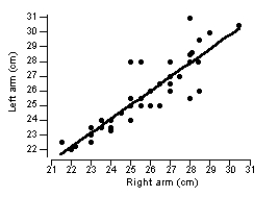 Which is the appropriate equation for the regression line in the plot?
A) = 1.22 + 0.95x
B) = 1.22 -0.95x
C) = 1.22 + 0.95y
D) = 1.22 - 0.95y
Which is the appropriate equation for the regression line in the plot?A) = 1.22 + 0.95x
B) = 1.22 -0.95x
C) = 1.22 + 0.95y
D) = 1.22 - 0.95y
سؤال
سؤال
سؤال
سؤال
سؤال
سؤال
سؤال
سؤال
سؤال
سؤال
سؤال
A regression analysis done with Minitab for left foot length (y variable) and right foot length (x variable) for 55 college students gave the following output. 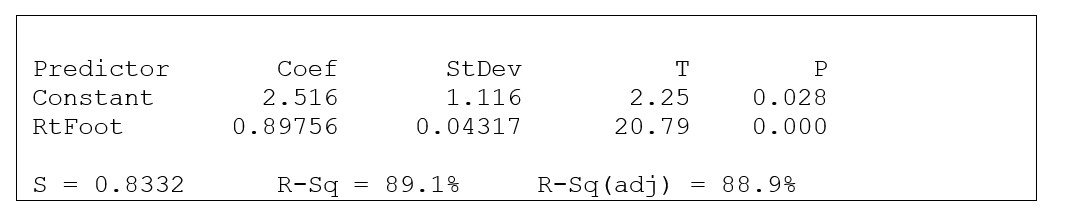 The regression equation for left foot length (y variable) and right foot length (x variable) is
A) = 0.89756 + 2.516x
B) = 1.116 + 0.04217x
C) = 2.25 + 20.797x
D) = 2.516 + 0.89756x
The regression equation for left foot length (y variable) and right foot length (x variable) isA) = 0.89756 + 2.516x
B) = 1.116 + 0.04217x
C) = 2.25 + 20.797x
D) = 2.516 + 0.89756x
سؤال
In a certain study the relationship between (social) mobility of female foreign American residents and the number of years they have lived in the U.S. is examined. The researcher hopes to predict the mobility of these women based on their length of stay. Part of the SPSS output is shown below:  What is the correct regression equation for summarizing this linear relationship?
A) = -3.799 + 7.745 years
B) = 7.745 + 0.778. years
C) = -3.799 + 0.778 mobility
D) = 7.745 + -3.799 mobility
What is the correct regression equation for summarizing this linear relationship?A) = -3.799 + 7.745 years
B) = 7.745 + 0.778. years
C) = -3.799 + 0.778 mobility
D) = 7.745 + -3.799 mobility
سؤال
Use the following information for questions:
A graduate student is doing a research project on stress among recent immigrants. She focused on parents of young children. All parents answered questions on a questionnaire (with the help of a translator if necessary). A stress score was calculated for all participants. SPSS was used to run a simple linear regression in which y = stress of the parent and x = age of the parent.
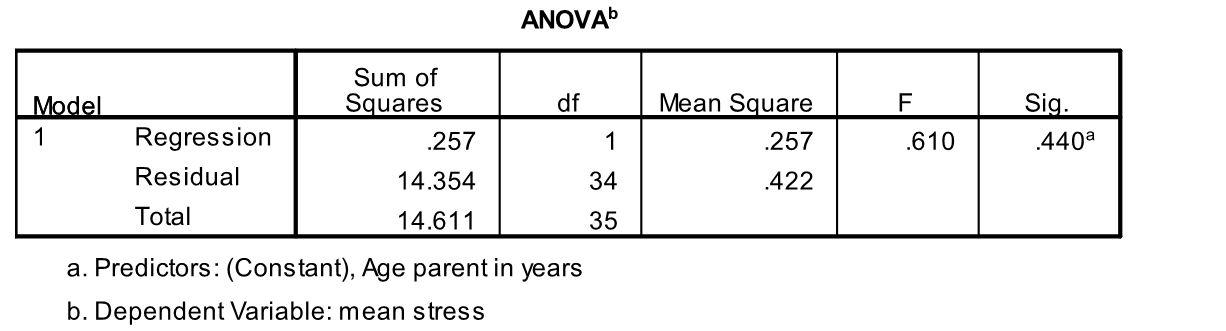
-What is the predicted stress score for a 35 year old parent?
A) 84.76
B) 0.48
C) 4.64
D) 2.04
A graduate student is doing a research project on stress among recent immigrants. She focused on parents of young children. All parents answered questions on a questionnaire (with the help of a translator if necessary). A stress score was calculated for all participants. SPSS was used to run a simple linear regression in which y = stress of the parent and x = age of the parent.
-What is the predicted stress score for a 35 year old parent?
A) 84.76
B) 0.48
C) 4.64
D) 2.04
سؤال
Use the following information for questions:
A graduate student is doing a research project on stress among recent immigrants. She focused on parents of young children. All parents answered questions on a questionnaire (with the help of a translator if necessary). A stress score was calculated for all participants. SPSS was used to run a simple linear regression in which y = stress of the parent and x = age of the parent.
-What is an estimate for the average stress score for parents who are 28 years old?
A) 2.114
B) 67.805
C) 15.918
D) 27.692
سؤال
Use the following information for questions:
A graduate student is doing a research project on stress among recent immigrants. She focused on parents of young children. All parents answered questions on a questionnaire (with the help of a translator if necessary). A stress score was calculated for all participants. SPSS was used to run a simple linear regression in which y = stress of the parent and x = age of the parent.
-Madeline is a 30-year old mother of young children who just emigrated from Germany. She scored a 1.9 on the stress test. What is the value of Madeline's residual?
A) 0.192
B) 42.649
C) -14.982
D) -0.192
سؤال
Use the following information for questions:
A graduate student is doing a research project on stress among recent immigrants. She focused on parents of young children. All parents answered questions on a questionnaire (with the help of a translator if necessary). A stress score was calculated for all participants. SPSS was used to run a simple linear regression in which y = stress of the parent and x = age of the parent.
-A least squares line or least squares regression line has the property that the sum of squared differences between the observed values of y and the predicted values is smaller for that line than it is for any other line. What is the value of the SSE for this regression line?
A) 0.257
B) 14.354
C) 14.611
D) 0.422
سؤال
سؤال
سؤال
سؤال
سؤال
سؤال
سؤال
سؤال
The scatterplot below shows students' heights (y) versus father's heights (x) for a sample of 173 college students. The symbol "+" represents a male student and the symbol "o" represents a female student.
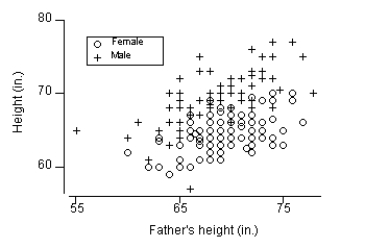 A linear regression equation is determined for the relationship between female students' heights and their father's heights and, separately, one for male students and their fathers. How do the y-intercepts compare for these two regression equations?
A linear regression equation is determined for the relationship between female students' heights and their father's heights and, separately, one for male students and their fathers. How do the y-intercepts compare for these two regression equations? سؤال
Use the following information for questions:
The following output is for a simple regression in which y = grade point average (GPA) and x = number of classes skipped in a typical week. The results were determined using self-reported data for a sample of n = 1,673 students at a large northeastern university.
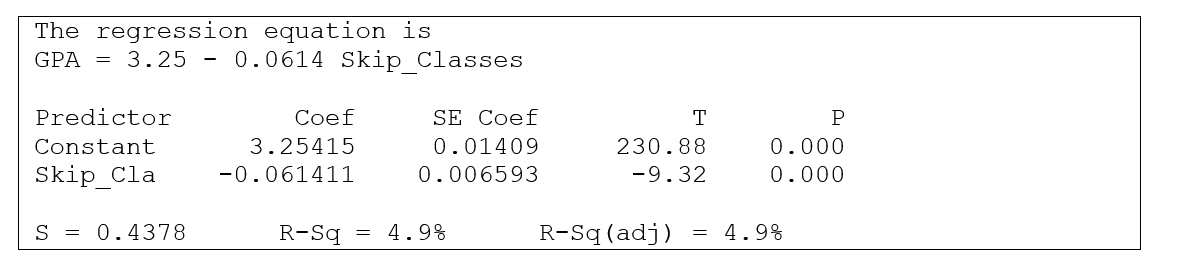
-What is the value of the slope of the sample regression line? Write a sentence that interprets this slope in the context of this situation.
The following output is for a simple regression in which y = grade point average (GPA) and x = number of classes skipped in a typical week. The results were determined using self-reported data for a sample of n = 1,673 students at a large northeastern university.
-What is the value of the slope of the sample regression line? Write a sentence that interprets this slope in the context of this situation.
سؤال
Use the following information for questions:
The following output is for a simple regression in which y = grade point average (GPA) and x = number of classes skipped in a typical week. The results were determined using self-reported data for a sample of n = 1,673 students at a large northeastern university.
-What is the predicted grade point average for a student who skips 4 classes per typical week?
سؤال
Use the following information for questions:
The 25 item "Parenting Hassles Scale" asks parents questions about certain situations in their family. They are asked to rate these situations on (1) how often they occur (frequency), and (2) how much they bother them (intensity). The score system for the frequency was 0-4 points (0 = never, 4 = all the time) and for the intensity 1-5 (1 = not much at all, 5 = very much). If an item received a 0 (zero) for frequency, it automatically received a 0 (zero) for intensity. The two variables, frequency and intensity, were formed by taking the total of the corresponding scores from the two rating scales across the various situations. In a scatterplot, these two variables showed an approximate linear relationship. They were then used to run a linear regression to predict intensity based on frequency.
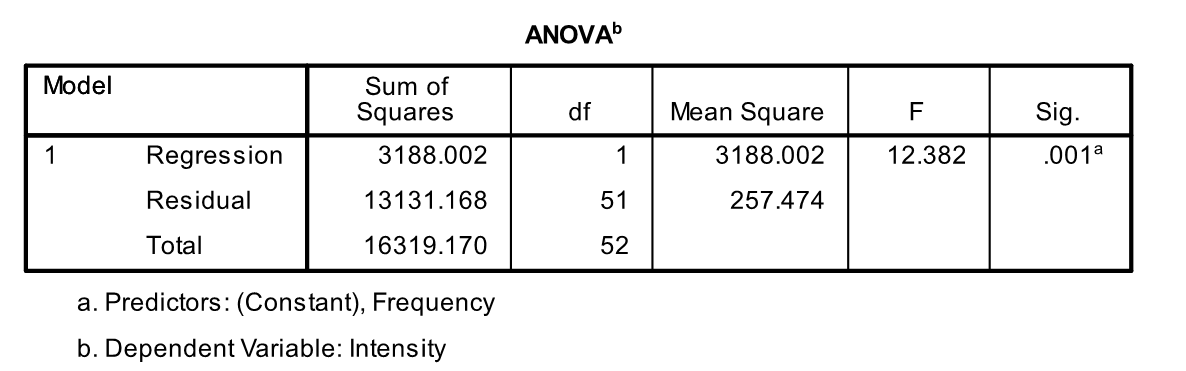
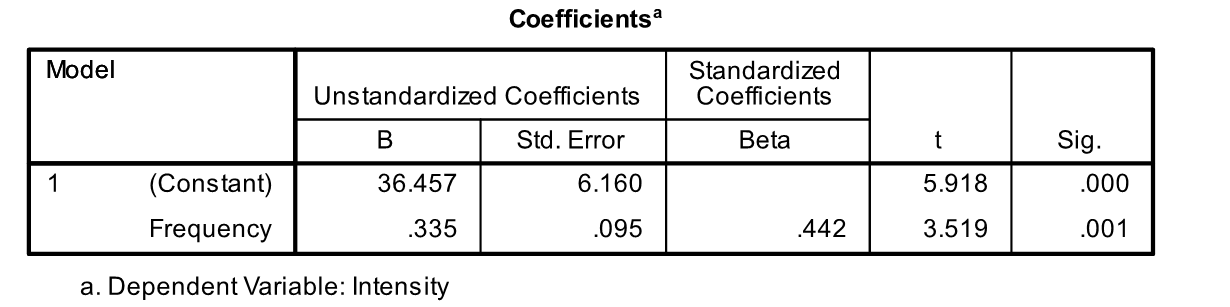
-What is the predicted intensity score for someone who scores a 45 on the frequency scale?
The 25 item "Parenting Hassles Scale" asks parents questions about certain situations in their family. They are asked to rate these situations on (1) how often they occur (frequency), and (2) how much they bother them (intensity). The score system for the frequency was 0-4 points (0 = never, 4 = all the time) and for the intensity 1-5 (1 = not much at all, 5 = very much). If an item received a 0 (zero) for frequency, it automatically received a 0 (zero) for intensity. The two variables, frequency and intensity, were formed by taking the total of the corresponding scores from the two rating scales across the various situations. In a scatterplot, these two variables showed an approximate linear relationship. They were then used to run a linear regression to predict intensity based on frequency.
-What is the predicted intensity score for someone who scores a 45 on the frequency scale?
سؤال
Use the following information for questions:
The 25 item "Parenting Hassles Scale" asks parents questions about certain situations in their family. They are asked to rate these situations on (1) how often they occur (frequency), and (2) how much they bother them (intensity). The score system for the frequency was 0-4 points (0 = never, 4 = all the time) and for the intensity 1-5 (1 = not much at all, 5 = very much). If an item received a 0 (zero) for frequency, it automatically received a 0 (zero) for intensity. The two variables, frequency and intensity, were formed by taking the total of the corresponding scores from the two rating scales across the various situations. In a scatterplot, these two variables showed an approximate linear relationship. They were then used to run a linear regression to predict intensity based on frequency.
-What is an estimate for the average intensity score for parents who score 33 on the frequency scale?
سؤال
Use the following information for questions:
The 25 item "Parenting Hassles Scale" asks parents questions about certain situations in their family. They are asked to rate these situations on (1) how often they occur (frequency), and (2) how much they bother them (intensity). The score system for the frequency was 0-4 points (0 = never, 4 = all the time) and for the intensity 1-5 (1 = not much at all, 5 = very much). If an item received a 0 (zero) for frequency, it automatically received a 0 (zero) for intensity. The two variables, frequency and intensity, were formed by taking the total of the corresponding scores from the two rating scales across the various situations. In a scatterplot, these two variables showed an approximate linear relationship. They were then used to run a linear regression to predict intensity based on frequency.
-Dan filled out the "Parenting Hassles Scale". He scored 25 on the frequency scale and 41 on the intensity scale. What is the value of Dan's residual?
سؤال
Use the following information for questions:
The 25 item "Parenting Hassles Scale" asks parents questions about certain situations in their family. They are asked to rate these situations on (1) how often they occur (frequency), and (2) how much they bother them (intensity). The score system for the frequency was 0-4 points (0 = never, 4 = all the time) and for the intensity 1-5 (1 = not much at all, 5 = very much). If an item received a 0 (zero) for frequency, it automatically received a 0 (zero) for intensity. The two variables, frequency and intensity, were formed by taking the total of the corresponding scores from the two rating scales across the various situations. In a scatterplot, these two variables showed an approximate linear relationship. They were then used to run a linear regression to predict intensity based on frequency.
-What is the value of the Sum of Squared Errors for this regression line?
سؤال
A scatterplot of X and Y is shown below. Which value of the correlation coefficient, r, best describes the relationship? 
A) r = 0.80
B) r = -0.95
C) r = -1.00
D) r = -2
A) r = 0.80
B) r = -0.95
C) r = -1.00
D) r = -2
سؤال
سؤال
سؤال
سؤال
سؤال
سؤال
سؤال
سؤال
سؤال
سؤال
سؤال
سؤال
سؤال
Consider the following graph: 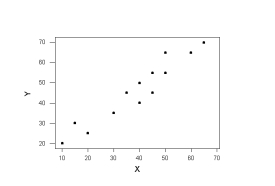 For these data, there is
A) positive correlation.
B) negative correlation.
C) biased correlation.
D) zero correlation.
For these data, there isA) positive correlation.
B) negative correlation.
C) biased correlation.
D) zero correlation.
سؤال
سؤال
سؤال
The following output is for a simple regression in which y = grade point average (GPA) and x = number of classes skipped in a typical week. The results were determined using self-reported data for a sample of n = 1,673 at a large northeastern university.
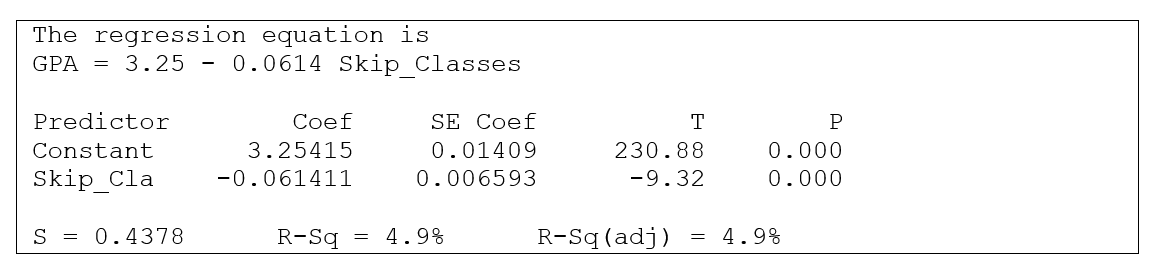 What value is given in the output for R2? Based on this value, explain whether the association between GPA and classes skipped per week is a strong association or a weak association.
What value is given in the output for R2? Based on this value, explain whether the association between GPA and classes skipped per week is a strong association or a weak association. سؤال
سؤال

فتح الحزمة
قم بالتسجيل لفتح البطاقات في هذه المجموعة!
Unlock Deck
Unlock Deck
1/99
العب
ملء الشاشة (f)
Deck 3: Relationships Between Quantitative Variables
1
Which one of the following is not appropriate for studying the relationship between two quantitative variables?
A) Scatterplot
B) Bar chart
C) Correlation
D) Regression
A) Scatterplot
B) Bar chart
C) Correlation
D) Regression
Bar chart
2
Which one of the following is a variable that we usually put on the horizontal axis of a scatterplot?
A) y variable
B) explanatory variable
C) response variable
D) dependent variable
A) y variable
B) explanatory variable
C) response variable
D) dependent variable
explanatory variable
3
Which one of the following cannot be determined from a scatterplot?
A) a positive relationship
B) a negative relationship
C) a cause and effect relationship
D) a curvilinear relationship
A) a positive relationship
B) a negative relationship
C) a cause and effect relationship
D) a curvilinear relationship
a cause and effect relationship
4
A scatterplot is a
A) one-dimensional graph of randomly scattered data.
B) two-dimensional graph of a straight line.
C) two-dimensional graph of a curved line.
D) two-dimensional graph of data values.
A) one-dimensional graph of randomly scattered data.
B) two-dimensional graph of a straight line.
C) two-dimensional graph of a curved line.
D) two-dimensional graph of data values.
فتح الحزمة
افتح القفل للوصول البطاقات البالغ عددها 99 في هذه المجموعة.
فتح الحزمة
k this deck
5
Two variables have a positive association when
A) the values of one variable tend to increase as the values of the other variable increase.
B) the values of one variable tend to decrease as the values of the other variable increase.
C) the values of one variable tend to increase regardless of how the values of the other variable change.
D) the values of both variables are always positive.
فتح الحزمة
افتح القفل للوصول البطاقات البالغ عددها 99 في هذه المجموعة.
فتح الحزمة
k this deck
6
Describe the type of association shown in the scatterplot below:
A) Positive linear association
B) Negative linear association
C) Positive curvilinear association
D) Negative curvilinear association
A) Positive linear association
B) Negative linear association
C) Positive curvilinear association
D) Negative curvilinear association
فتح الحزمة
افتح القفل للوصول البطاقات البالغ عددها 99 في هذه المجموعة.
فتح الحزمة
k this deck
7
Describe the type of association shown in the scatterplot below:
A) Positive linear association
B) Negative linear association
C) Positive curvilinear association
D) Negative curvilinear association
A) Positive linear association
B) Negative linear association
C) Positive curvilinear association
D) Negative curvilinear association
فتح الحزمة
افتح القفل للوصول البطاقات البالغ عددها 99 في هذه المجموعة.
فتح الحزمة
k this deck
8
Describe the type of association shown in the scatterplot below:
A) Positive linear association
B) Negative linear association
C) Positive curvilinear association
D) Negative curvilinear association
A) Positive linear association
B) Negative linear association
C) Positive curvilinear association
D) Negative curvilinear association
فتح الحزمة
افتح القفل للوصول البطاقات البالغ عددها 99 في هذه المجموعة.
فتح الحزمة
k this deck
9
Describe the type of association shown in the scatterplot below:
A) Positive linear association
B) Negative linear association
C) Positive curvilinear association
D) Negative curvilinear association
A) Positive linear association
B) Negative linear association
C) Positive curvilinear association
D) Negative curvilinear association
فتح الحزمة
افتح القفل للوصول البطاقات البالغ عددها 99 في هذه المجموعة.
فتح الحزمة
k this deck
10
Which of the following sets of variables is most likely to have a negative association?
A) the height of the son and the height of the father
B) the age of the wife and the age of the husband
C) the age of the mother and the number of children in the family
D) the age of the mother and the ability to have children
A) the height of the son and the height of the father
B) the age of the wife and the age of the husband
C) the age of the mother and the number of children in the family
D) the age of the mother and the ability to have children
فتح الحزمة
افتح القفل للوصول البطاقات البالغ عددها 99 في هذه المجموعة.
فتح الحزمة
k this deck
11
Which of the following sets of variables is most likely to have a negative association?
A) the number of bedrooms and the number of bathrooms in a house
B) the number of rooms in a house and the time it takes to vacuum the house
C) the age of a house and the cleanliness of the carpets inside
D) the size of a house and its selling price
A) the number of bedrooms and the number of bathrooms in a house
B) the number of rooms in a house and the time it takes to vacuum the house
C) the age of a house and the cleanliness of the carpets inside
D) the size of a house and its selling price
فتح الحزمة
افتح القفل للوصول البطاقات البالغ عددها 99 في هذه المجموعة.
فتح الحزمة
k this deck
12
A scatterplot of geographic latitude (X) and average January temperature (Y) for 20 cities in the United States is given below. Is there a positive association or a negative association? Explain what such an association means in the context of this situation.
فتح الحزمة
افتح القفل للوصول البطاقات البالغ عددها 99 في هذه المجموعة.
فتح الحزمة
k this deck
13
A scatterplot of y = height and x = left forearm length (cm) for 55 college students is given below. Is there a positive association or a negative association? Explain what this association means in the context of this situation.
فتح الحزمة
افتح القفل للوصول البطاقات البالغ عددها 99 في هذه المجموعة.
فتح الحزمة
k this deck
14
The following plot shows the association between weight (pounds) and age (months) for 19 female bears. Write an interpretation of this plot. Is the association negative or positive? Linear or curvilinear? Are there any outliers?
فتح الحزمة
افتح القفل للوصول البطاقات البالغ عددها 99 في هذه المجموعة.
فتح الحزمة
k this deck
15
A car salesman is curious if he can predict the fuel efficiency of a car (in MPG) if he knows the fuel capacity of the car (in gallons). He collects data on a variety of makes and models of cars. The scatterplot below shows the association between fuel capacity and fuel efficiency for a sample of 78 cars. Is the association negative or positive? Linear or curvilinear? Are there any outliers?
فتح الحزمة
افتح القفل للوصول البطاقات البالغ عددها 99 في هذه المجموعة.
فتح الحزمة
k this deck
16
In an attempt to model the relationship between sales price and assessed land value, a realtor has taken a simple random sample of houses recently sold in the area and obtained the following data (both are expressed in thousands of dollars). The scatterplot below shows the association between fuel capacity and fuel efficiency for a sample of 78 cars. Is the association negative or positive? Linear or curvilinear? Are there any outliers?
فتح الحزمة
افتح القفل للوصول البطاقات البالغ عددها 99 في هذه المجموعة.
فتح الحزمة
k this deck
17
Which graph shows a pattern that would be appropriately described by the equation = + ?
A)
B)
C)
D)
A)
B)
C)
D)
فتح الحزمة
افتح القفل للوصول البطاقات البالغ عددها 99 في هذه المجموعة.
فتح الحزمة
k this deck
18
Which of the following can not be answered from a regression equation?
A) Predict the value of y at a particular value of x.
B) Estimate the slope between y and x.
C) Estimate whether the linear association is positive or negative.
D) Estimate whether the association is linear or non-linear
A) Predict the value of y at a particular value of x.
B) Estimate the slope between y and x.
C) Estimate whether the linear association is positive or negative.
D) Estimate whether the association is linear or non-linear
فتح الحزمة
افتح القفل للوصول البطاقات البالغ عددها 99 في هذه المجموعة.
فتح الحزمة
k this deck
19
A regression line is a straight line that describes how values of a quantitative explanatory variable (y) are related, on average, to values of a quantitative response variable (x).
فتح الحزمة
افتح القفل للوصول البطاقات البالغ عددها 99 في هذه المجموعة.
فتح الحزمة
k this deck
20
The equation of a regression line is called the regression equation.
فتح الحزمة
افتح القفل للوصول البطاقات البالغ عددها 99 في هذه المجموعة.
فتح الحزمة
k this deck
21
A regression line can be used to estimate the average value of y at any specified value of x.
فتح الحزمة
افتح القفل للوصول البطاقات البالغ عددها 99 في هذه المجموعة.
فتح الحزمة
k this deck
22
A regression line can be used to predict the unknown value of x for an individual, given that individual's y value.
فتح الحزمة
افتح القفل للوصول البطاقات البالغ عددها 99 في هذه المجموعة.
فتح الحزمة
k this deck
23
Use the following information for questions:
The simple linear regression equation can be written as = +
-In the simple linear regression equation, the symbol represents the
A) average or predicted response.
B) estimated intercept.
C) estimated slope.
D) explanatory variable.
The simple linear regression equation can be written as = +
-In the simple linear regression equation, the symbol represents the
A) average or predicted response.
B) estimated intercept.
C) estimated slope.
D) explanatory variable.
فتح الحزمة
افتح القفل للوصول البطاقات البالغ عددها 99 في هذه المجموعة.
فتح الحزمة
k this deck
24
Use the following information for questions:
The simple linear regression equation can be written as = +
-In the simple linear regression equation, the term represents the
A) estimated or predicted response.
B) estimated intercept.
C) estimated slope.
D) explanatory variable.
The simple linear regression equation can be written as = +
-In the simple linear regression equation, the term represents the
A) estimated or predicted response.
B) estimated intercept.
C) estimated slope.
D) explanatory variable.
فتح الحزمة
افتح القفل للوصول البطاقات البالغ عددها 99 في هذه المجموعة.
فتح الحزمة
k this deck
25
Use the following information for questions:
The simple linear regression equation can be written as = +
-In the simple linear regression equation, the term represents the
A) estimated or predicted response.
B) estimated intercept.
C) estimated slope.
D) explanatory variable.
The simple linear regression equation can be written as = +
-In the simple linear regression equation, the term represents the
A) estimated or predicted response.
B) estimated intercept.
C) estimated slope.
D) explanatory variable.
فتح الحزمة
افتح القفل للوصول البطاقات البالغ عددها 99 في هذه المجموعة.
فتح الحزمة
k this deck
26
Use the following information for questions:
The simple linear regression equation can be written as = +
-In the simple linear regression equation, the symbol x represents the
A) estimated or predicted response.
B) estimated intercept.
C) estimated slope.
D) explanatory variable.
The simple linear regression equation can be written as = +
-In the simple linear regression equation, the symbol x represents the
A) estimated or predicted response.
B) estimated intercept.
C) estimated slope.
D) explanatory variable.
فتح الحزمة
افتح القفل للوصول البطاقات البالغ عددها 99 في هذه المجموعة.
فتح الحزمة
k this deck
27
Use the following information for questions:
The simple linear regression equation can be written as = +
-In the simple linear regression equation, represents the slope of the regression line. Which of the following gives the best interpretation of the slope?
A) It is an estimate of the average value of y at any specified value of x.
B) It indicates how much of a change there is for the predicted or average value of y when x increases by one unit.
C) It is the value of y, when x = 0.
D) It is the value of x, when y = 0.
فتح الحزمة
افتح القفل للوصول البطاقات البالغ عددها 99 في هذه المجموعة.
فتح الحزمة
k this deck
28
Use the following information for questions:
A regression between foot length (response variable in cm) and height (explanatory variable in inches) for 33 students resulted in the following regression equation: = 10.9 + 0.23x
-One student in the sample was 73 inches tall with a foot length of 29 cm. What is the predicted foot length for this student?
A) 17.57 cm
B) 27.69 cm
C) 29 cm
D) 33 cm
فتح الحزمة
افتح القفل للوصول البطاقات البالغ عددها 99 في هذه المجموعة.
فتح الحزمة
k this deck
29
Use the following information for questions:
A regression between foot length (response variable in cm) and height (explanatory variable in inches) for 33 students resulted in the following regression equation: = 10.9 + 0.23x
-One student in the sample was 73 inches tall with a foot length of 29 cm. What is the residual for this student?
A) 29 cm
B) 1.31 cm
C) 0.00 cm
D) -1.31 cm
فتح الحزمة
افتح القفل للوصول البطاقات البالغ عددها 99 في هذه المجموعة.
فتح الحزمة
k this deck
30
Use the following information for questions:
A regression between foot length (response variable in cm) and height (explanatory variable in inches) for 33 students resulted in the following regression equation: = 10.9 + 0.23x
-What is the estimated average foot length for students who are 70 inches tall?
A) 27 cm
B) 28 cm
C) 29 cm
D) 30 cm
A regression between foot length (response variable in cm) and height (explanatory variable in inches) for 33 students resulted in the following regression equation: = 10.9 + 0.23x
-What is the estimated average foot length for students who are 70 inches tall?
A) 27 cm
B) 28 cm
C) 29 cm
D) 30 cm
فتح الحزمة
افتح القفل للوصول البطاقات البالغ عددها 99 في هذه المجموعة.
فتح الحزمة
k this deck
31
The following scatterplot shows the relationship between the left and right forearm lengths (cm) for 55 college students along with the regression line, where y = left forearm length x = right forearm length. (Source: physical dataset on the CD.) Which is the appropriate equation for the regression line in the plot?
A) = 1.22 + 0.95x
B) = 1.22 -0.95x
C) = 1.22 + 0.95y
D) = 1.22 - 0.95y
Which is the appropriate equation for the regression line in the plot?A) = 1.22 + 0.95x
B) = 1.22 -0.95x
C) = 1.22 + 0.95y
D) = 1.22 - 0.95y
فتح الحزمة
افتح القفل للوصول البطاقات البالغ عددها 99 في هذه المجموعة.
فتح الحزمة
k this deck
32
Use the following information for questions:
A group of adults aged 20 to 80 were tested to see how far away they could first hear an ambulance coming towards them. An equation describing the relationship between distance (in feet) and age was found to be:
Distance = 600 - 3 * Age.
-Estimate the distance for an individual who is 20 years old.
A) 11,940 feet
B) 597 feet
C) 540 feet
D) 20 feet
فتح الحزمة
افتح القفل للوصول البطاقات البالغ عددها 99 في هذه المجموعة.
فتح الحزمة
k this deck
33
Use the following information for questions:
A group of adults aged 20 to 80 were tested to see how far away they could first hear an ambulance coming towards them. An equation describing the relationship between distance (in feet) and age was found to be:
Distance = 600 - 3 * Age.
-How much does the estimated distance change when age is increased by 1?
A) It goes down by 1 foot.
B) It goes down by 3 feet.
C) It goes up by 1 foot.
D) It goes up by 3 feet.
فتح الحزمة
افتح القفل للوصول البطاقات البالغ عددها 99 في هذه المجموعة.
فتح الحزمة
k this deck
34
Use the following information for questions:
A group of adults aged 20 to 80 were tested to see how far away they could first hear an ambulance coming towards them. An equation describing the relationship between distance (in feet) and age was found to be:
Distance = 600 - 3 * Age.
-Based on the equation, what is the direction of the association between distance and age?
A) Positive
B) Negative
C) Zero
D) Direction can't be determined from the equation.
فتح الحزمة
افتح القفل للوصول البطاقات البالغ عددها 99 في هذه المجموعة.
فتح الحزمة
k this deck
35
For which one of these relationships could we use a regression analysis? Only one choice is correct.
A) Relationship between weight and height.
B) Relationship between political party membership and opinion about abortion.
C) Relationship between gender and whether person has a tattoo.
D) Relationship between eye color (blue, brown, etc.) and hair color (blond, etc.).
A) Relationship between weight and height.
B) Relationship between political party membership and opinion about abortion.
C) Relationship between gender and whether person has a tattoo.
D) Relationship between eye color (blue, brown, etc.) and hair color (blond, etc.).
فتح الحزمة
افتح القفل للوصول البطاقات البالغ عددها 99 في هذه المجموعة.
فتح الحزمة
k this deck
36
The regression line for a set of points is given by = 12 - 6x. What is the slope of the line?
A) -12
B)-6
C) +6
D) +12
A) -12
B)-6
C) +6
D) +12
فتح الحزمة
افتح القفل للوصول البطاقات البالغ عددها 99 في هذه المجموعة.
فتح الحزمة
k this deck
37
A scatter plot and regression line can be used for all of the following except
A) to determine if any (x, y) pairs are outliers.
B) to predict y at a specific value of x.
C) to estimate the average y at a specific value of x.
D) to determine if a change in x causes a change in y.
A) to determine if any (x, y) pairs are outliers.
B) to predict y at a specific value of x.
C) to estimate the average y at a specific value of x.
D) to determine if a change in x causes a change in y.
فتح الحزمة
افتح القفل للوصول البطاقات البالغ عددها 99 في هذه المجموعة.
فتح الحزمة
k this deck
38
Use the following information for questions:
Past data has shown that the regression line relating the final exam score and the midterm exam score for students who take statistics from a certain professor is:
final exam = 50 + 0.5 * midterm
-What is the predicted final exam score for a student with a midterm score of 50?
A) 50
B) 50.5
C) 75
D) 100
فتح الحزمة
افتح القفل للوصول البطاقات البالغ عددها 99 في هذه المجموعة.
فتح الحزمة
k this deck
39
Use the following information for questions:
Past data has shown that the regression line relating the final exam score and the midterm exam score for students who take statistics from a certain professor is:
final exam = 50 + 0.5 * midterm
-Which of the following gives a correct interpretation of the intercept?
A) A student who scored 0 on the midterm would be predicted to score 50 on the final exam.
B) A student who scored 0 on the final exam would be predicted to score 50 on the midterm exam.
C) A student who scored 2 points higher than another student on the midterm would be predicted to score 1 point higher than the other student on the final exam.
D) None of the interpretations above are correct interpretations of the intercept.
فتح الحزمة
افتح القفل للوصول البطاقات البالغ عددها 99 في هذه المجموعة.
فتح الحزمة
k this deck
40
Use the following information for questions:
Past data has shown that the regression line relating the final exam score and the midterm exam score for students who take statistics from a certain professor is:
final exam = 50 + 0.5 * midterm
-Which of the following gives a correct interpretation of the slope?
A) A student who scored 0 on the midterm would be predicted to score 50 on the final exam.
B) A student who scored 0 on the final exam would be predicted to score 50 on the midterm exam.
C) A student who scored 2 points higher than another student on the midterm would be predicted to score 1 point higher than the other student on the final exam.
D) None of the interpretations above are correct interpretations of the slope.
فتح الحزمة
افتح القفل للوصول البطاقات البالغ عددها 99 في هذه المجموعة.
فتح الحزمة
k this deck
41
Use the following information for questions:
Past data has shown that the regression line relating the final exam score and the midterm exam score for students who take statistics from a certain professor is:
final exam = 50 + 0.5 * midterm
-Midterm exam scores could range from 0 to 100. Based on the equation, final exam scores are predicted to range from
A) 0 to 100.
B) 50 to 100.
C) 50 to 75.
D) 0 to 75.
فتح الحزمة
افتح القفل للوصول البطاقات البالغ عددها 99 في هذه المجموعة.
فتح الحزمة
k this deck
42
A regression analysis done with Minitab for left foot length (y variable) and right foot length (x variable) for 55 college students gave the following output. The regression equation for left foot length (y variable) and right foot length (x variable) is
A) = 0.89756 + 2.516x
B) = 1.116 + 0.04217x
C) = 2.25 + 20.797x
D) = 2.516 + 0.89756x
The regression equation for left foot length (y variable) and right foot length (x variable) isA) = 0.89756 + 2.516x
B) = 1.116 + 0.04217x
C) = 2.25 + 20.797x
D) = 2.516 + 0.89756x
فتح الحزمة
افتح القفل للوصول البطاقات البالغ عددها 99 في هذه المجموعة.
فتح الحزمة
k this deck
43
In a certain study the relationship between (social) mobility of female foreign American residents and the number of years they have lived in the U.S. is examined. The researcher hopes to predict the mobility of these women based on their length of stay. Part of the SPSS output is shown below: What is the correct regression equation for summarizing this linear relationship?
A) = -3.799 + 7.745 years
B) = 7.745 + 0.778. years
C) = -3.799 + 0.778 mobility
D) = 7.745 + -3.799 mobility
What is the correct regression equation for summarizing this linear relationship?A) = -3.799 + 7.745 years
B) = 7.745 + 0.778. years
C) = -3.799 + 0.778 mobility
D) = 7.745 + -3.799 mobility
فتح الحزمة
افتح القفل للوصول البطاقات البالغ عددها 99 في هذه المجموعة.
فتح الحزمة
k this deck
44
Use the following information for questions:
A graduate student is doing a research project on stress among recent immigrants. She focused on parents of young children. All parents answered questions on a questionnaire (with the help of a translator if necessary). A stress score was calculated for all participants. SPSS was used to run a simple linear regression in which y = stress of the parent and x = age of the parent.
-What is the predicted stress score for a 35 year old parent?
A) 84.76
B) 0.48
C) 4.64
D) 2.04
فتح الحزمة
افتح القفل للوصول البطاقات البالغ عددها 99 في هذه المجموعة.
فتح الحزمة
k this deck
45
Use the following information for questions:
A graduate student is doing a research project on stress among recent immigrants. She focused on parents of young children. All parents answered questions on a questionnaire (with the help of a translator if necessary). A stress score was calculated for all participants. SPSS was used to run a simple linear regression in which y = stress of the parent and x = age of the parent.
-What is an estimate for the average stress score for parents who are 28 years old?
A) 2.114
B) 67.805
C) 15.918
D) 27.692
فتح الحزمة
افتح القفل للوصول البطاقات البالغ عددها 99 في هذه المجموعة.
فتح الحزمة
k this deck
46
Use the following information for questions:
A graduate student is doing a research project on stress among recent immigrants. She focused on parents of young children. All parents answered questions on a questionnaire (with the help of a translator if necessary). A stress score was calculated for all participants. SPSS was used to run a simple linear regression in which y = stress of the parent and x = age of the parent.
-Madeline is a 30-year old mother of young children who just emigrated from Germany. She scored a 1.9 on the stress test. What is the value of Madeline's residual?
A) 0.192
B) 42.649
C) -14.982
D) -0.192
فتح الحزمة
افتح القفل للوصول البطاقات البالغ عددها 99 في هذه المجموعة.
فتح الحزمة
k this deck
47
Use the following information for questions:
A graduate student is doing a research project on stress among recent immigrants. She focused on parents of young children. All parents answered questions on a questionnaire (with the help of a translator if necessary). A stress score was calculated for all participants. SPSS was used to run a simple linear regression in which y = stress of the parent and x = age of the parent.
-A least squares line or least squares regression line has the property that the sum of squared differences between the observed values of y and the predicted values is smaller for that line than it is for any other line. What is the value of the SSE for this regression line?
A) 0.257
B) 14.354
C) 14.611
D) 0.422
فتح الحزمة
افتح القفل للوصول البطاقات البالغ عددها 99 في هذه المجموعة.
فتح الحزمة
k this deck
48
A basketball coach of a youth team wishes to predict the number of points the players will score in their first season as a junior (y) based on the number of points they scored in their last season as youth players (x). The average number of points the team scored as youth players was =7.9 and the average number of points they scored in their first year as junior players was = 10.2. The slope is b1 = 0.79. What is the predicted number of goals for a player who scored 7 goals in his last season as a youth player?
A) 7.78
B) 9.49
C) 11.46
D) 15.58
A) 7.78
B) 9.49
C) 11.46
D) 15.58
فتح الحزمة
افتح القفل للوصول البطاقات البالغ عددها 99 في هذه المجموعة.
فتح الحزمة
k this deck
49
Use the following information for questions:
A regression was done for 20 cities with latitude as the explanatory variable (x) and average January temperature as the response variable (y). The latitude is measured in degrees and average January temperature in degrees Fahrenheit. The latitudes ranged from 26 (Miami) to 47 (Duluth) The regression equation is = 49.4 - 0.313x
-The city of Pittsburgh, PA has latitude 40 degrees with average January temperature of 25 degrees Fahrenheit. What is the estimated average January temperature for Pittsburgh, based on the regression equation? What is the residual?
فتح الحزمة
افتح القفل للوصول البطاقات البالغ عددها 99 في هذه المجموعة.
فتح الحزمة
k this deck
50
Use the following information for questions:
A regression was done for 20 cities with latitude as the explanatory variable (x) and average January temperature as the response variable (y). The latitude is measured in degrees and average January temperature in degrees Fahrenheit. The latitudes ranged from 26 (Miami) to 47 (Duluth) The regression equation is = 49.4 - 0.313x
-The city of Miami, Florida has latitude 26 degrees with average January temperature of 67 degrees Fahrenheit. What is the estimated average January temperature for Miami, based on the regression equation? What is the residual?
فتح الحزمة
افتح القفل للوصول البطاقات البالغ عددها 99 في هذه المجموعة.
فتح الحزمة
k this deck
51
Use the following information for questions:
A regression was done for 20 cities with latitude as the explanatory variable (x) and average January temperature as the response variable (y). The latitude is measured in degrees and average January temperature in degrees Fahrenheit. The latitudes ranged from 26 (Miami) to 47 (Duluth) The regression equation is = 49.4 - 0.313x
-Mexico City has latitude 20 degrees. What is the problem with using the regression equation to estimate the average January temperature for Mexico City?
فتح الحزمة
افتح القفل للوصول البطاقات البالغ عددها 99 في هذه المجموعة.
فتح الحزمة
k this deck
52
Use the following information for questions:
The next three questions are based on a regression equation for 55 college students with x = left forearm length (cm) and y = height. The forearm lengths ranged from 22 cm to 31 cm. The regression equation is = 30.3 + 1.49x
-One student's left forearm length was 27 cm, and his height was 75 inches. What is the estimated height for this student, based on the regression equation? What is the residual?
فتح الحزمة
افتح القفل للوصول البطاقات البالغ عددها 99 في هذه المجموعة.
فتح الحزمة
k this deck
53
Use the following information for questions:
The next three questions are based on a regression equation for 55 college students with x = left forearm length (cm) and y = height. The forearm lengths ranged from 22 cm to 31 cm. The regression equation is = 30.3 + 1.49x
-One student's left forearm length was 22 cm, and her height was 63 inches. What is the estimated height for this student, based on the regression equation? What is the residual?
فتح الحزمة
افتح القفل للوصول البطاقات البالغ عددها 99 في هذه المجموعة.
فتح الحزمة
k this deck
54
Use the following information for questions:
The next three questions are based on a regression equation for 55 college students with x = left forearm length (cm) and y = height. The forearm lengths ranged from 22 cm to 31 cm. The regression equation is = 30.3 + 1.49x
-The instructor's left forearm length is 35 cm. Is there any problem with using the regression equation to estimate the instructor's height?
فتح الحزمة
افتح القفل للوصول البطاقات البالغ عددها 99 في هذه المجموعة.
فتح الحزمة
k this deck
55
The scatterplot below shows students' heights (y) versus father's heights (x) for a sample of 173 college students. The symbol "+" represents a male student and the symbol "o" represents a female student.
A linear regression equation is determined for the relationship between female students' heights and their father's heights and, separately, one for male students and their fathers. How do the y-intercepts compare for these two regression equations?
A linear regression equation is determined for the relationship between female students' heights and their father's heights and, separately, one for male students and their fathers. How do the y-intercepts compare for these two regression equations? فتح الحزمة
افتح القفل للوصول البطاقات البالغ عددها 99 في هذه المجموعة.
فتح الحزمة
k this deck
56
Use the following information for questions:
The following output is for a simple regression in which y = grade point average (GPA) and x = number of classes skipped in a typical week. The results were determined using self-reported data for a sample of n = 1,673 students at a large northeastern university.
-What is the value of the slope of the sample regression line? Write a sentence that interprets this slope in the context of this situation.
فتح الحزمة
افتح القفل للوصول البطاقات البالغ عددها 99 في هذه المجموعة.
فتح الحزمة
k this deck
57
Use the following information for questions:
The following output is for a simple regression in which y = grade point average (GPA) and x = number of classes skipped in a typical week. The results were determined using self-reported data for a sample of n = 1,673 students at a large northeastern university.
-What is the predicted grade point average for a student who skips 4 classes per typical week?
فتح الحزمة
افتح القفل للوصول البطاقات البالغ عددها 99 في هذه المجموعة.
فتح الحزمة
k this deck
58
Use the following information for questions:
The 25 item "Parenting Hassles Scale" asks parents questions about certain situations in their family. They are asked to rate these situations on (1) how often they occur (frequency), and (2) how much they bother them (intensity). The score system for the frequency was 0-4 points (0 = never, 4 = all the time) and for the intensity 1-5 (1 = not much at all, 5 = very much). If an item received a 0 (zero) for frequency, it automatically received a 0 (zero) for intensity. The two variables, frequency and intensity, were formed by taking the total of the corresponding scores from the two rating scales across the various situations. In a scatterplot, these two variables showed an approximate linear relationship. They were then used to run a linear regression to predict intensity based on frequency.
-What is the predicted intensity score for someone who scores a 45 on the frequency scale?
فتح الحزمة
افتح القفل للوصول البطاقات البالغ عددها 99 في هذه المجموعة.
فتح الحزمة
k this deck
59
Use the following information for questions:
The 25 item "Parenting Hassles Scale" asks parents questions about certain situations in their family. They are asked to rate these situations on (1) how often they occur (frequency), and (2) how much they bother them (intensity). The score system for the frequency was 0-4 points (0 = never, 4 = all the time) and for the intensity 1-5 (1 = not much at all, 5 = very much). If an item received a 0 (zero) for frequency, it automatically received a 0 (zero) for intensity. The two variables, frequency and intensity, were formed by taking the total of the corresponding scores from the two rating scales across the various situations. In a scatterplot, these two variables showed an approximate linear relationship. They were then used to run a linear regression to predict intensity based on frequency.
-What is an estimate for the average intensity score for parents who score 33 on the frequency scale?
فتح الحزمة
افتح القفل للوصول البطاقات البالغ عددها 99 في هذه المجموعة.
فتح الحزمة
k this deck
60
Use the following information for questions:
The 25 item "Parenting Hassles Scale" asks parents questions about certain situations in their family. They are asked to rate these situations on (1) how often they occur (frequency), and (2) how much they bother them (intensity). The score system for the frequency was 0-4 points (0 = never, 4 = all the time) and for the intensity 1-5 (1 = not much at all, 5 = very much). If an item received a 0 (zero) for frequency, it automatically received a 0 (zero) for intensity. The two variables, frequency and intensity, were formed by taking the total of the corresponding scores from the two rating scales across the various situations. In a scatterplot, these two variables showed an approximate linear relationship. They were then used to run a linear regression to predict intensity based on frequency.
-Dan filled out the "Parenting Hassles Scale". He scored 25 on the frequency scale and 41 on the intensity scale. What is the value of Dan's residual?
فتح الحزمة
افتح القفل للوصول البطاقات البالغ عددها 99 في هذه المجموعة.
فتح الحزمة
k this deck
61
Use the following information for questions:
The 25 item "Parenting Hassles Scale" asks parents questions about certain situations in their family. They are asked to rate these situations on (1) how often they occur (frequency), and (2) how much they bother them (intensity). The score system for the frequency was 0-4 points (0 = never, 4 = all the time) and for the intensity 1-5 (1 = not much at all, 5 = very much). If an item received a 0 (zero) for frequency, it automatically received a 0 (zero) for intensity. The two variables, frequency and intensity, were formed by taking the total of the corresponding scores from the two rating scales across the various situations. In a scatterplot, these two variables showed an approximate linear relationship. They were then used to run a linear regression to predict intensity based on frequency.
-What is the value of the Sum of Squared Errors for this regression line?
فتح الحزمة
افتح القفل للوصول البطاقات البالغ عددها 99 في هذه المجموعة.
فتح الحزمة
k this deck
62
A scatterplot of X and Y is shown below. Which value of the correlation coefficient, r, best describes the relationship?
A) r = 0.80
B) r = -0.95
C) r = -1.00
D) r = -2
A) r = 0.80
B) r = -0.95
C) r = -1.00
D) r = -2
فتح الحزمة
افتح القفل للوصول البطاقات البالغ عددها 99 في هذه المجموعة.
فتح الحزمة
k this deck
63
You wish to describe the relationship between exam grades and the amount of time students watch the Discovery Channel. The correlation turns out to be r = +0.30. What does this mean?
A) The more a student watches the Discovery Channel, the higher his or her exam grades tend to be.
B) The more a student watches the Discovery Channel, the lower his or her exam grades tend to be.
C) In order to increase your exam grades, it is recommended that you spend more time watching the Discovery Channel.
D) 30% of the variation in exam grades is explained by the linear relationship with time spent watching the Discovery Channel.
فتح الحزمة
افتح القفل للوصول البطاقات البالغ عددها 99 في هذه المجموعة.
فتح الحزمة
k this deck
64
A regression equation for left palm length (y variable) and right palm length (x variable) for 55 college students gave an error sum of squares (SSE) of 10.7 and a total sum of squares (SSTO) of 85.2. What proportion of the variation in y is explained by x?
A) 11.2%.
B) 12.6%.
C) 87.4%.
D) 88.8%.
A) 11.2%.
B) 12.6%.
C) 87.4%.
D) 88.8%.
فتح الحزمة
افتح القفل للوصول البطاقات البالغ عددها 99 في هذه المجموعة.
فتح الحزمة
k this deck
65
A group of adults aged 20 to 80 were tested to see how far away they could first hear an ambulance coming towards them. An equation describing the relationship between distance (in feet) and age was found to be: Distance = 600 - 3 *Age
Based on the equation, what is the strength of the relationship between distance and age?
A) There is a strong relationship.
B) There is a weak relationship.
C) There is no relationship.
D) Strength can't be determined from the equation.
Based on the equation, what is the strength of the relationship between distance and age?
A) There is a strong relationship.
B) There is a weak relationship.
C) There is no relationship.
D) Strength can't be determined from the equation.
فتح الحزمة
افتح القفل للوصول البطاقات البالغ عددها 99 في هذه المجموعة.
فتح الحزمة
k this deck
66
Which of the following is a possible value of r2, and indicates the strongest linear relationship between two quantitative variables?
A) -90%
B) 0%
C) 80%
D) 120%.
A) -90%
B) 0%
C) 80%
D) 120%.
فتح الحزمة
افتح القفل للوصول البطاقات البالغ عددها 99 في هذه المجموعة.
فتح الحزمة
k this deck
67
The correlation between two variables is given by r = 0.0. What does this mean?
A) The best straight line through the data is horizontal.
B) There is a perfect positive relationship between the two variables
C) There is a perfect negative relationship between the two variables.
D) All of the points must fall exactly on a horizontal straight line.
A) The best straight line through the data is horizontal.
B) There is a perfect positive relationship between the two variables
C) There is a perfect negative relationship between the two variables.
D) All of the points must fall exactly on a horizontal straight line.
فتح الحزمة
افتح القفل للوصول البطاقات البالغ عددها 99 في هذه المجموعة.
فتح الحزمة
k this deck
68
If the correlation coefficient between two quantitative variables is positive, what conclusion can we draw?
A) High values on the first variable are associated with high values on the second variable.
B) Low values on the first variable are associated with low values on the second variable.
C) High values on the first variable are associated with low values on the second variable.
D) Both A and B are correct.
فتح الحزمة
افتح القفل للوصول البطاقات البالغ عددها 99 في هذه المجموعة.
فتح الحزمة
k this deck
69
Which of the following correlation values indicates the strongest linear relationship between two quantitative variables?
A) r = -0.65
B) r = -0.30
C) r = 0.00
D) r = 0.50
A) r = -0.65
B) r = -0.30
C) r = 0.00
D) r = 0.50
فتح الحزمة
افتح القفل للوصول البطاقات البالغ عددها 99 في هذه المجموعة.
فتح الحزمة
k this deck
70
The value of a correlation is reported by a researcher to be r = -0.5. Which of the following statements is correct?
A) The x-variable explains 50% of the variability in the y-variable.
B) The x-variable explains -50% of the variability in the y-variable.
C) The x-variable explains 25% of the variability in the y-variable.
D) The x-variable explains -25% of the variability in the y-variable.
A) The x-variable explains 50% of the variability in the y-variable.
B) The x-variable explains -50% of the variability in the y-variable.
C) The x-variable explains 25% of the variability in the y-variable.
D) The x-variable explains -25% of the variability in the y-variable.
فتح الحزمة
افتح القفل للوصول البطاقات البالغ عددها 99 في هذه المجموعة.
فتح الحزمة
k this deck
71
Which one of the following statements involving correlation is possible and reasonable?
A) The correlation between hair color and eye color is 0.80.
B) The correlation between the height of a father and the height of his first son is 0.6
C) The correlation between left foot length and right foot length is 2.35.
D) The correlation between hair color and age is positive.
A) The correlation between hair color and eye color is 0.80.
B) The correlation between the height of a father and the height of his first son is 0.6
C) The correlation between left foot length and right foot length is 2.35.
D) The correlation between hair color and age is positive.
فتح الحزمة
افتح القفل للوصول البطاقات البالغ عددها 99 في هذه المجموعة.
فتح الحزمة
k this deck
72
Correlation and regression are concerned with
A) the relationship between two categorical variables.
B) the relationship between two quantitative variables.
C) the relationship between a quantitative explanatory variable and a categorical response variable.
D) the relationship between a categorical explanatory variable and a quantitative response variable.
فتح الحزمة
افتح القفل للوصول البطاقات البالغ عددها 99 في هذه المجموعة.
فتح الحزمة
k this deck
73
A researcher reports that the correlation between two quantitative variables is r = 0.8. Which of the following statements is correct?
A) The average value of y changes by 0.8 when x is increased by 1.
B) The average value of x changes by 0.8 when y is increased by 1.
C) The explanatory variable (x) explains 0.8 or 80% of the variation in the response variable (y).
D) The explanatory variable (x) explains (0.8)2 = 0.64 or 64% of the variation in the response variable (y).
فتح الحزمة
افتح القفل للوصول البطاقات البالغ عددها 99 في هذه المجموعة.
فتح الحزمة
k this deck
74
A reviewer rated a sample of fifteen wines on a score from 1 (very poor) to 7 (excellent). A correlation of 0.92 was obtained between these ratings and the cost of the wines at a local store. In plain English, this means that
A) in general, the reviewer liked the cheaper wines better.
B) having to pay more caused the reviewer to give a higher rating.
C) wines with low ratings are likely to be more expensive (probably because fewer will be sold).
D) in general, as the cost went up so did the rating.
A) in general, the reviewer liked the cheaper wines better.
B) having to pay more caused the reviewer to give a higher rating.
C) wines with low ratings are likely to be more expensive (probably because fewer will be sold).
D) in general, as the cost went up so did the rating.
فتح الحزمة
افتح القفل للوصول البطاقات البالغ عددها 99 في هذه المجموعة.
فتح الحزمة
k this deck
75
Consider the following graph: For these data, there is
A) positive correlation.
B) negative correlation.
C) biased correlation.
D) zero correlation.
For these data, there isA) positive correlation.
B) negative correlation.
C) biased correlation.
D) zero correlation.
فتح الحزمة
افتح القفل للوصول البطاقات البالغ عددها 99 في هذه المجموعة.
فتح الحزمة
k this deck
76
Which of the following is a deterministic relationship?
A) The relationship between hair color and eye color.
B) The relationship between father's height and son's height.
C) The relationship between height in inches and height in centimeters.
D) The relationship between height as determined with a ruler and height as determined by a tape measure.
A) The relationship between hair color and eye color.
B) The relationship between father's height and son's height.
C) The relationship between height in inches and height in centimeters.
D) The relationship between height as determined with a ruler and height as determined by a tape measure.
فتح الحزمة
افتح القفل للوصول البطاقات البالغ عددها 99 في هذه المجموعة.
فتح الحزمة
k this deck
77
The correlation between father's heights and student's heights for a sample of 79 male students is r = 0.669. What is the proportion of variation in son's heights explained by the linear relationship with father's heights?
فتح الحزمة
افتح القفل للوصول البطاقات البالغ عددها 99 في هذه المجموعة.
فتح الحزمة
k this deck
78
The following output is for a simple regression in which y = grade point average (GPA) and x = number of classes skipped in a typical week. The results were determined using self-reported data for a sample of n = 1,673 at a large northeastern university.
What value is given in the output for R2? Based on this value, explain whether the association between GPA and classes skipped per week is a strong association or a weak association.
What value is given in the output for R2? Based on this value, explain whether the association between GPA and classes skipped per week is a strong association or a weak association. فتح الحزمة
افتح القفل للوصول البطاقات البالغ عددها 99 في هذه المجموعة.
فتح الحزمة
k this deck
79
Use the following information for questions:
The next two questions are based on a regression equation for 55 college students withx = left forearm length (cm) and y = height. The forearm lengths ranged from 22 cm to 31 cm. The regression equation is = 30.3 + 1.49x.
-The total sum of squares (SSTO) = 1054.8, and the error sum of squares (SSE) = 464.5. What is the value of r2, the proportion of variation in y explained by its linear relationship with x?
فتح الحزمة
افتح القفل للوصول البطاقات البالغ عددها 99 في هذه المجموعة.
فتح الحزمة
k this deck
80
Use the following information for questions:
The next two questions are based on a regression equation for 55 college students withx = left forearm length (cm) and y = height. The forearm lengths ranged from 22 cm to 31 cm. The regression equation is = 30.3 + 1.49x.
-What is the correlation between left forearm length and height?
The next two questions are based on a regression equation for 55 college students withx = left forearm length (cm) and y = height. The forearm lengths ranged from 22 cm to 31 cm. The regression equation is = 30.3 + 1.49x.
-What is the correlation between left forearm length and height?
فتح الحزمة
افتح القفل للوصول البطاقات البالغ عددها 99 في هذه المجموعة.
فتح الحزمة
k this deck
فتح الحزمة
افتح القفل للوصول البطاقات البالغ عددها 99 في هذه المجموعة.


