Deck 2: Turning Data Into Information
ملء الشاشة (f)
سؤال
سؤال
The table below summarizes observed data on the gender and party membership of 1000 individuals:
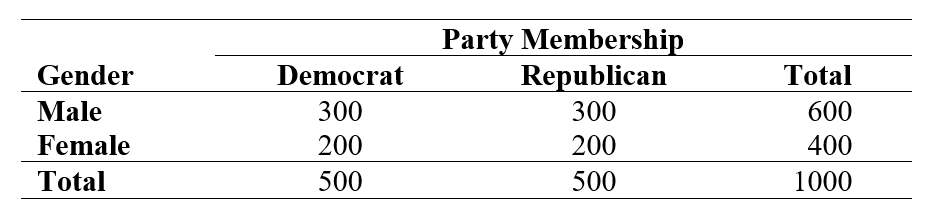
Which one of the following statements about the relationship between gender and party is suggested by the data in the table?
A) There is a relationship between gender and party membership.
B) There is no relationship between gender and party membership.
C) There is a relationship between gender and being a Democrat but not between gender and being a Republican.
D) There is a relationship between gender and party membership for males but not for females.
سؤال
سؤال
سؤال
سؤال
Listed below is the number of Congressional Medals of Honor awarded in wars fought by the United States.
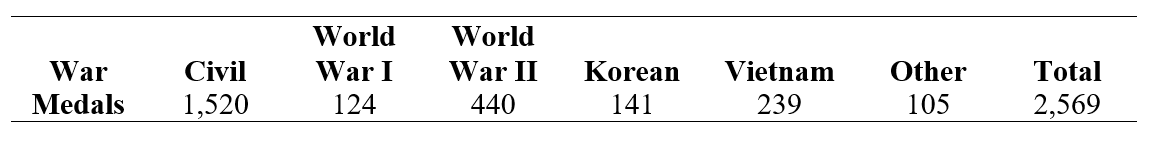
What percent of all medals given were awarded during World War I and World War II?
A) 4.83%
B) 17.13%
C) 21.95%
D) 78.01%
What percent of all medals given were awarded during World War I and World War II?
A) 4.83%
B) 17.13%
C) 21.95%
D) 78.01%
سؤال
Use the following information for questions:
In a survey of 1000 adults, respondents were asked about the expense of a college education and the relative necessity of financial assistance. The correspondents were classified as to whether they currently had a child in college or not (college status), and whether they thought the loan obligation for most college students was too high, about right, or too little (loan obligation opinion). The table below summarizes some of the survey results. Use these results to answer the following questions.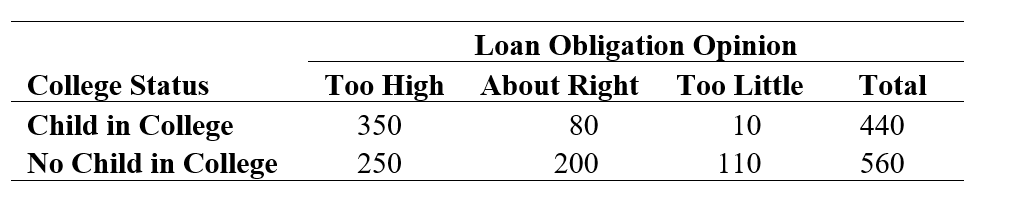
-Which type of variable is Loan Obligation Opinion?
A) Categorical
B) Quantitative
C) Continuous
D) Measurement
سؤال
Use the following information for questions:
In a survey of 1000 adults, respondents were asked about the expense of a college education and the relative necessity of financial assistance. The correspondents were classified as to whether they currently had a child in college or not (college status), and whether they thought the loan obligation for most college students was too high, about right, or too little (loan obligation opinion). The table below summarizes some of the survey results. Use these results to answer the following questions.
-What role does the variable Loan Obligation Opinion play in this study?
A) Explanatory
B) Response
C) Confounding
D) It plays no role in the study.
سؤال
Use the following information for questions:
In a survey of 1000 adults, respondents were asked about the expense of a college education and the relative necessity of financial assistance. The correspondents were classified as to whether they currently had a child in college or not (college status), and whether they thought the loan obligation for most college students was too high, about right, or too little (loan obligation opinion). The table below summarizes some of the survey results. Use these results to answer the following questions.
-Which group had the greatest percentage of adults who thought loan obligations are too high?
A) Those adults that have a child in college
B) Those adults that do not have a child in college
C) Both groups have the same percent thinking loan obligations are too high
سؤال
Use the following information for questions:
The pie chart below shows the U.S. Energy Consumption by Energy Source for the year 2009.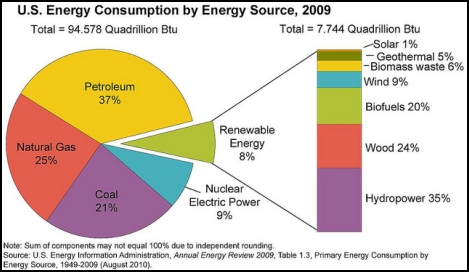
-The source with the highest consumption was
A) petroleum.
B) natural gas.
C) coal.
D) renewable energy.
The pie chart below shows the U.S. Energy Consumption by Energy Source for the year 2009.
-The source with the highest consumption was
A) petroleum.
B) natural gas.
C) coal.
D) renewable energy.
سؤال
Use the following information for questions:
The pie chart below shows the U.S. Energy Consumption by Energy Source for the year 2009.
-The combined percent of petroleum and natural gas was
A) less than 25% of the total energy consumption.
B) between 25% and 50% of the total energy consumption.
C) between 50% and 75% of the total energy consumption.
D) more than 75% of the total energy consumption.
سؤال
Use the following information for questions:
The pie chart below shows the U.S. Energy Consumption by Energy Source for the year 2009.
-The consumption of natural gas in the United States totaled approximately how many quadrillion Btu?
A) approximately 94.578 quadrillion Btu.
B) approximately 25 quadrillion Btu.
C) approximately 0.25 quadrillion Btu.
D) approximately 23.6 quadrillion Btu.
سؤال
Use the following information for questions:
The pie chart below shows the U.S. Energy Consumption by Energy Source for the year 2009.
-The consumption of renewable sources in the United States totaled approximately 7.7 quadrillion Btu or about 8% of all energy used nationally. Over one-third of the consumption of renewable sources was from
A) solar, geothermal, biomass waste, and wind combined.
B) biofuels.
C) wood.
D) hydropower.
سؤال
سؤال
سؤال
Use the following information for questions:
A USA TODAY/CNN/Gallup Poll conducted April 19, 2005, was based on telephone interviews with 616 U.S. Catholics. One question asked was "When you think about your commitment to the Catholic Church, how much is your commitment affected by who the pope is -- a great deal, a moderate amount, not much, or not at all? The percentages are provided in the table below.
-The response variable being measured for this question could be called the Commitment Status. State what type of variable commitment status is and suggest an appropriate graph that could be made to display the distribution of this variable.
سؤال
Use the following information for questions:
A USA TODAY/CNN/Gallup Poll conducted April 19, 2005, was based on telephone interviews with 616 U.S. Catholics. One question asked was "When you think about your commitment to the Catholic Church, how much is your commitment affected by who the pope is -- a great deal, a moderate amount, not much, or not at all? The percentages are provided in the table below.
-Approximately how many respondents stated that their commitment is not affected much?
سؤال
سؤال
سؤال
سؤال
سؤال
سؤال
سؤال
سؤال
Use the following information for questions:
The following histogram is for the weights (lbs) of 119 female college students.(Source: idealwtwomen dataset on the CD.)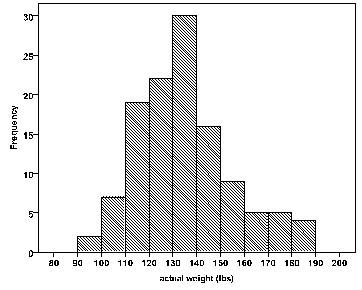
-What is the approximate shape of the distribution?
A) Nearly symmetric.
B) Skewed to the left.
C) Skewed to the right.
D) Bimodal (has more than one peak).
The following histogram is for the weights (lbs) of 119 female college students.(Source: idealwtwomen dataset on the CD.)
-What is the approximate shape of the distribution?
A) Nearly symmetric.
B) Skewed to the left.
C) Skewed to the right.
D) Bimodal (has more than one peak).
سؤال
Use the following information for questions:
The following histogram is for the weights (lbs) of 119 female college students.(Source: idealwtwomen dataset on the CD.)
-The best choice for the median weight for the 119 women based on the histogram is approximately
A) 100 pounds.
B) 110 pounds.
C) 135 pounds.
D) 160 pounds.
The following histogram is for the weights (lbs) of 119 female college students.(Source: idealwtwomen dataset on the CD.)
-The best choice for the median weight for the 119 women based on the histogram is approximately
A) 100 pounds.
B) 110 pounds.
C) 135 pounds.
D) 160 pounds.
سؤال
Use the following information for questions:
The following histogram shows the distribution of the difference between the actual and "ideal" weights for 119 female college students. Ideal weights are responses to the question "What is your ideal weight"? The difference = actual -ideal. (Source: idealwtwomen dataset on the CD.)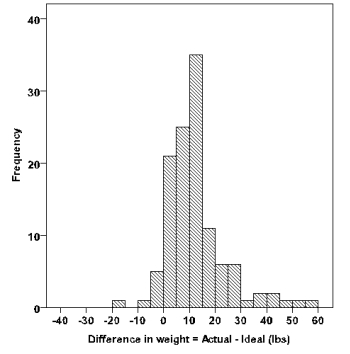
-What is the approximate shape of the distribution?
A) Nearly symmetric.
B) Skewed to the left.
C) Skewed to the right.
D) Bimodal (has more than one peak).
سؤال
Use the following information for questions:
The following histogram shows the distribution of the difference between the actual and "ideal" weights for 119 female college students. Ideal weights are responses to the question "What is your ideal weight"? The difference = actual -ideal. (Source: idealwtwomen dataset on the CD.)
-The median of the distribution is approximately
A) -10 pounds.
B) 10 pounds.
C) 30 pounds.
D) 50 pounds.
سؤال
Use the following information for questions:
The following histogram shows the distribution of the difference between the actual and "ideal" weights for 119 female college students. Ideal weights are responses to the question "What is your ideal weight"? The difference = actual -ideal. (Source: idealwtwomen dataset on the CD.)
-Most of the women in this sample felt that their actual weight was
A) about the same as their ideal weight.
B) less than their ideal weight.
C) greater than their ideal weight.
D) no more than 2 pounds different from their ideal weight.
سؤال
Use the following information for questions:
The following histogram is for the weights (lbs) of 63 male college students.(Source: idealwtmen dataset on the CD.)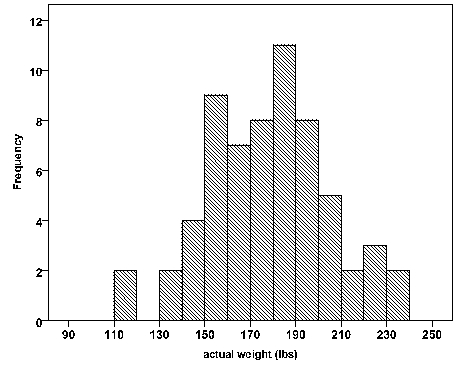
-What is the best description for the approximate shape of this distribution?
A) Nearly symmetric.
B) Skewed to the left.
C) Skewed to the right.
D) Bimodal (has more than one peak).
The following histogram is for the weights (lbs) of 63 male college students.(Source: idealwtmen dataset on the CD.)
-What is the best description for the approximate shape of this distribution?
A) Nearly symmetric.
B) Skewed to the left.
C) Skewed to the right.
D) Bimodal (has more than one peak).
سؤال
Use the following information for questions:
The following histogram is for the weights (lbs) of 63 male college students.(Source: idealwtmen dataset on the CD.)
-The median weight for the 63 men is approximately
A) 130 pounds.
B) 150 pounds.
C) 180 pounds.
D) 220 pounds.
The following histogram is for the weights (lbs) of 63 male college students.(Source: idealwtmen dataset on the CD.)
-The median weight for the 63 men is approximately
A) 130 pounds.
B) 150 pounds.
C) 180 pounds.
D) 220 pounds.
سؤال
Use the following information for questions:
The following histogram gives the distribution of the difference between the actual and ideal weights for a sample of male college students. Ideal weights are responses to the question "What is your ideal weight"? The difference = actual -ideal.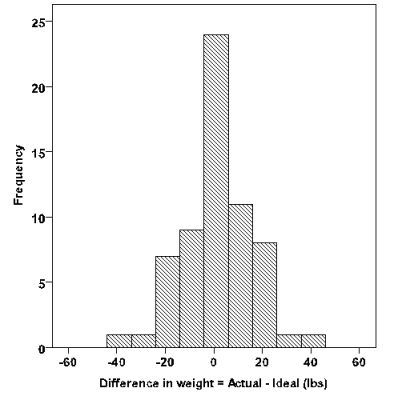
-What is the approximate shape of the distribution?
A) Nearly symmetric.
B) Skewed to the left.
C) Skewed to the right.
D) Bimodal (has more than one peak).
سؤال
Use the following information for questions:
The following histogram gives the distribution of the difference between the actual and ideal weights for a sample of male college students. Ideal weights are responses to the question "What is your ideal weight"? The difference = actual -ideal.
-The median of the distribution is approximately
A)-10 pounds.
B) 0 pounds.
C) 10 pounds.
D) 20 pounds.
سؤال
Use the following information for questions:
The following histogram gives the distribution of the difference between the actual and ideal weights for a sample of male college students. Ideal weights are responses to the question "What is your ideal weight"? The difference = actual -ideal.
-Most of the men in this sample felt that their actual weight was
A) about the same as their ideal weight.
B) less than their ideal weight.
C) greater than their ideal weight.
D) no more than 2 pounds different from their ideal weight.
سؤال
The following boxplot is for the results of the women's 400-meter dash final race during the 2000 Olympics in Sydney, Australia. Cathy Freeman won in 49.11 seconds. Choose the correct statement about the boxplot. 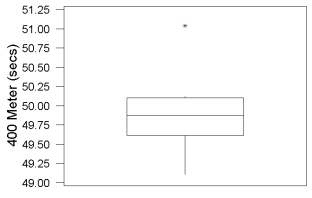
A) The median time is more than 50 seconds.
B) The median time is less than 49.75 seconds.
C) The fastest time of 49.11 seconds is an outlier.
D) The slowest time of 51.04 seconds is an outlier.
A) The median time is more than 50 seconds.
B) The median time is less than 49.75 seconds.
C) The fastest time of 49.11 seconds is an outlier.
D) The slowest time of 51.04 seconds is an outlier.
سؤال
سؤال
سؤال
سؤال
سؤال
Use the following information for questions:
A psychologist has developed a new technique intended to improve rote memory. To test the method against other standard methods, 45 high school students are selected at random and each is taught the new technique. The data on the number of words memorized correctly by the students were used to create the following histogram. Note the first class represents the interval [70, 72).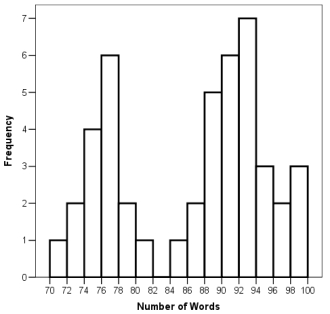
-What proportion of students memorized correctly at least 94 words?
سؤال
Use the following information for questions:
A psychologist has developed a new technique intended to improve rote memory. To test the method against other standard methods, 45 high school students are selected at random and each is taught the new technique. The data on the number of words memorized correctly by the students were used to create the following histogram. Note the first class represents the interval [70, 72).
-What is the overall shape of the distribution of the number of memorized words for these students?
سؤال
Use the following information for questions:
A psychologist has developed a new technique intended to improve rote memory. To test the method against other standard methods, 45 high school students are selected at random and each is taught the new technique. The data on the number of words memorized correctly by the students were used to create the following histogram. Note the first class represents the interval [70, 72).
-Can we calculate the exact range of the 45 responses? If yes, calculate it. If no, explain why not.
سؤال
سؤال
سؤال
سؤال
سؤال
سؤال
سؤال
سؤال
سؤال
Use the following information for questions:
The table below provides a statistical summary of the number of CDs owned as reported by students in a class survey done at Penn State University.
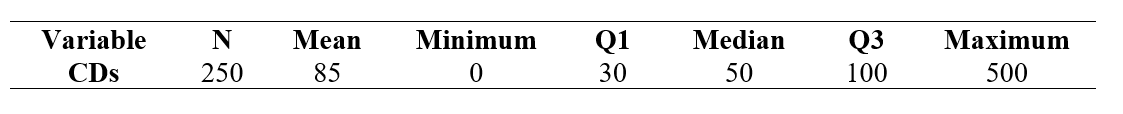
-Approximately what percent of students own somewhere between 30 and 50 CDs?
A) 50%
B) 25%
C) 20%
D) 4%
The table below provides a statistical summary of the number of CDs owned as reported by students in a class survey done at Penn State University.
-Approximately what percent of students own somewhere between 30 and 50 CDs?
A) 50%
B) 25%
C) 20%
D) 4%
سؤال
Use the following information for questions:
The table below provides a statistical summary of the number of CDs owned as reported by students in a class survey done at Penn State University.
-What is the interquartile range for these data?
A) 500
B) 100
C) 70
D) 30
The table below provides a statistical summary of the number of CDs owned as reported by students in a class survey done at Penn State University.
-What is the interquartile range for these data?
A) 500
B) 100
C) 70
D) 30
سؤال
Use the following information for questions:
The table below provides a statistical summary of the number of CDs owned as reported by students in a class survey done at Penn State University.
-Based on the summary shown, which of the following statements most likely describes the shape of the CDs owned dataset?
A) The summary is evidence that the data are symmetric and bell-shaped.
B) The summary is evidence that the data are symmetric but not bell-shaped.
C) The summary is evidence that the data are skewed to the left.
D) The summary is evidence that the data are skewed to the right.
سؤال
Use the following information for questions:
The following boxplot gives the distribution of the ratings of a new brand of peanut butter for 50 randomly selected consumers (100 points possible with higher points corresponding to a more favorable rating).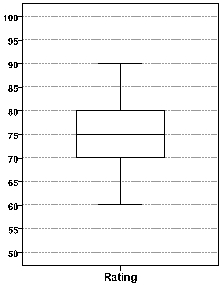
-Based on the boxplot,
A) the distribution appears to be skewed to the left.
B) the distribution appears to be skewed to the right.
C) there appear to be outliers at about 60 and 90.
D) there do not appear to be any outliers.
سؤال
Use the following information for questions:
The following boxplot gives the distribution of the ratings of a new brand of peanut butter for 50 randomly selected consumers (100 points possible with higher points corresponding to a more favorable rating).
-The lower quartile is between
A) 50 to 60 points.
B) 60 to 70 points.
C) 70 to 75 points.
D) 80 to 90 points.
سؤال
Use the following information for questions:
The following boxplot gives the distribution of the ratings of a new brand of peanut butter for 50 randomly selected consumers (100 points possible with higher points corresponding to a more favorable rating).
-The median is
A) 60 points.
B) 70 points.
C) 75 points.
D) 80 points.
The following boxplot gives the distribution of the ratings of a new brand of peanut butter for 50 randomly selected consumers (100 points possible with higher points corresponding to a more favorable rating).
-The median is
A) 60 points.
B) 70 points.
C) 75 points.
D) 80 points.
سؤال
Use the following information for questions:
The following boxplot gives the distribution of the ratings of a new brand of peanut butter for 50 randomly selected consumers (100 points possible with higher points corresponding to a more favorable rating).
-The upper quartile is between
A) 50 to 60 points.
B) 60 to 70 points.
C) 70 to 75 points.
D) 80 to 90 points.
سؤال
A recent study was conducted to compare the age of vehicles in a student parking lot versus those in a faculty parking lot at a major university. A random sample of 15 cars was taken from each lot and the age of the car was recorded by taking the current year and subtracting the model year from it. The two boxplots are shown below to summarize these results.
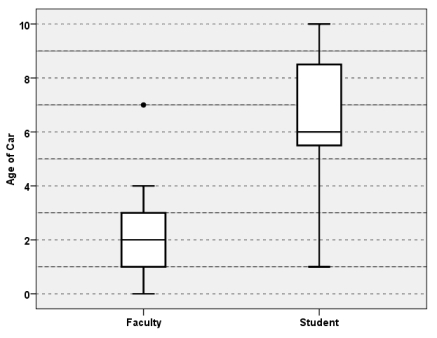 Compare the two distributions based on these side-by-side boxplots.
Compare the two distributions based on these side-by-side boxplots. سؤال
سؤال
سؤال
سؤال
سؤال
سؤال
سؤال
سؤال
سؤال
سؤال
سؤال
سؤال
سؤال
سؤال
سؤال
سؤال
سؤال
سؤال
سؤال
سؤال
سؤال
سؤال

فتح الحزمة
قم بالتسجيل لفتح البطاقات في هذه المجموعة!
Unlock Deck
Unlock Deck
1/94
العب
ملء الشاشة (f)
Deck 2: Turning Data Into Information
1
Tallies and cross-tabulations are used to summarize which of these variable types?
A) Quantitative
B) Mathematical
C) Continuous
D) Categorical
A) Quantitative
B) Mathematical
C) Continuous
D) Categorical
Categorical
2
The table below summarizes observed data on the gender and party membership of 1000 individuals:
Which one of the following statements about the relationship between gender and party is suggested by the data in the table?
A) There is a relationship between gender and party membership.
B) There is no relationship between gender and party membership.
C) There is a relationship between gender and being a Democrat but not between gender and being a Republican.
D) There is a relationship between gender and party membership for males but not for females.
There is no relationship between gender and party membership.
3
Which one of these variables is a categorical variable?
A) Number of ear pierces a person has
B) Height of a person
C) Weight of a person
D) Opinion about legalization of marijuana
A) Number of ear pierces a person has
B) Height of a person
C) Weight of a person
D) Opinion about legalization of marijuana
Opinion about legalization of marijuana
4
Which one of the following variables is not categorical?
A) Age of a person.
B) Gender of a person: male or female.
C) Choice on a test item: true or false.
D) Marital status of a person (single, married, divorced, other)
A) Age of a person.
B) Gender of a person: male or female.
C) Choice on a test item: true or false.
D) Marital status of a person (single, married, divorced, other)
فتح الحزمة
افتح القفل للوصول البطاقات البالغ عددها 94 في هذه المجموعة.
فتح الحزمة
k this deck
5
Which of the following is not a term used for a quantitative variable?
A) Measurement variable
B) Numerical variable
C) Continuous variable
D) Categorical variable
A) Measurement variable
B) Numerical variable
C) Continuous variable
D) Categorical variable
فتح الحزمة
افتح القفل للوصول البطاقات البالغ عددها 94 في هذه المجموعة.
فتح الحزمة
k this deck
6
Listed below is the number of Congressional Medals of Honor awarded in wars fought by the United States.
What percent of all medals given were awarded during World War I and World War II?
A) 4.83%
B) 17.13%
C) 21.95%
D) 78.01%
What percent of all medals given were awarded during World War I and World War II?
A) 4.83%
B) 17.13%
C) 21.95%
D) 78.01%
فتح الحزمة
افتح القفل للوصول البطاقات البالغ عددها 94 في هذه المجموعة.
فتح الحزمة
k this deck
7
Use the following information for questions:
In a survey of 1000 adults, respondents were asked about the expense of a college education and the relative necessity of financial assistance. The correspondents were classified as to whether they currently had a child in college or not (college status), and whether they thought the loan obligation for most college students was too high, about right, or too little (loan obligation opinion). The table below summarizes some of the survey results. Use these results to answer the following questions.
-Which type of variable is Loan Obligation Opinion?
A) Categorical
B) Quantitative
C) Continuous
D) Measurement
فتح الحزمة
افتح القفل للوصول البطاقات البالغ عددها 94 في هذه المجموعة.
فتح الحزمة
k this deck
8
Use the following information for questions:
In a survey of 1000 adults, respondents were asked about the expense of a college education and the relative necessity of financial assistance. The correspondents were classified as to whether they currently had a child in college or not (college status), and whether they thought the loan obligation for most college students was too high, about right, or too little (loan obligation opinion). The table below summarizes some of the survey results. Use these results to answer the following questions.
-What role does the variable Loan Obligation Opinion play in this study?
A) Explanatory
B) Response
C) Confounding
D) It plays no role in the study.
فتح الحزمة
افتح القفل للوصول البطاقات البالغ عددها 94 في هذه المجموعة.
فتح الحزمة
k this deck
9
Use the following information for questions:
In a survey of 1000 adults, respondents were asked about the expense of a college education and the relative necessity of financial assistance. The correspondents were classified as to whether they currently had a child in college or not (college status), and whether they thought the loan obligation for most college students was too high, about right, or too little (loan obligation opinion). The table below summarizes some of the survey results. Use these results to answer the following questions.
-Which group had the greatest percentage of adults who thought loan obligations are too high?
A) Those adults that have a child in college
B) Those adults that do not have a child in college
C) Both groups have the same percent thinking loan obligations are too high
فتح الحزمة
افتح القفل للوصول البطاقات البالغ عددها 94 في هذه المجموعة.
فتح الحزمة
k this deck
10
Use the following information for questions:
The pie chart below shows the U.S. Energy Consumption by Energy Source for the year 2009.
-The source with the highest consumption was
A) petroleum.
B) natural gas.
C) coal.
D) renewable energy.
The pie chart below shows the U.S. Energy Consumption by Energy Source for the year 2009.
-The source with the highest consumption was
A) petroleum.
B) natural gas.
C) coal.
D) renewable energy.
فتح الحزمة
افتح القفل للوصول البطاقات البالغ عددها 94 في هذه المجموعة.
فتح الحزمة
k this deck
11
Use the following information for questions:
The pie chart below shows the U.S. Energy Consumption by Energy Source for the year 2009.
-The combined percent of petroleum and natural gas was
A) less than 25% of the total energy consumption.
B) between 25% and 50% of the total energy consumption.
C) between 50% and 75% of the total energy consumption.
D) more than 75% of the total energy consumption.
فتح الحزمة
افتح القفل للوصول البطاقات البالغ عددها 94 في هذه المجموعة.
فتح الحزمة
k this deck
12
Use the following information for questions:
The pie chart below shows the U.S. Energy Consumption by Energy Source for the year 2009.
-The consumption of natural gas in the United States totaled approximately how many quadrillion Btu?
A) approximately 94.578 quadrillion Btu.
B) approximately 25 quadrillion Btu.
C) approximately 0.25 quadrillion Btu.
D) approximately 23.6 quadrillion Btu.
فتح الحزمة
افتح القفل للوصول البطاقات البالغ عددها 94 في هذه المجموعة.
فتح الحزمة
k this deck
13
Use the following information for questions:
The pie chart below shows the U.S. Energy Consumption by Energy Source for the year 2009.
-The consumption of renewable sources in the United States totaled approximately 7.7 quadrillion Btu or about 8% of all energy used nationally. Over one-third of the consumption of renewable sources was from
A) solar, geothermal, biomass waste, and wind combined.
B) biofuels.
C) wood.
D) hydropower.
فتح الحزمة
افتح القفل للوصول البطاقات البالغ عددها 94 في هذه المجموعة.
فتح الحزمة
k this deck
14
Among 300 fatal car accidents, 135 were single-car crashes, 66 were two-car crashes, and 99 involved three or more cars. Calculate the relative frequency and percent of fatal car accidents by the number of cars involved.
فتح الحزمة
افتح القفل للوصول البطاقات البالغ عددها 94 في هذه المجموعة.
فتح الحزمة
k this deck
15
The EPA sends out a survey to learn about people's water usage habits. Some of the questions included in the survey are given below.
Q1. How many times a week do you take a shower?
Q2. Do you leave the water running when you brush your teeth?
Q3. When you water your lawn, how long do you let the water run?
For each question, determine if it leads to categorical responses or quantitative responses.
Q1. How many times a week do you take a shower?
Q2. Do you leave the water running when you brush your teeth?
Q3. When you water your lawn, how long do you let the water run?
For each question, determine if it leads to categorical responses or quantitative responses.
فتح الحزمة
افتح القفل للوصول البطاقات البالغ عددها 94 في هذه المجموعة.
فتح الحزمة
k this deck
16
Use the following information for questions:
A USA TODAY/CNN/Gallup Poll conducted April 19, 2005, was based on telephone interviews with 616 U.S. Catholics. One question asked was "When you think about your commitment to the Catholic Church, how much is your commitment affected by who the pope is -- a great deal, a moderate amount, not much, or not at all? The percentages are provided in the table below.
-The response variable being measured for this question could be called the Commitment Status. State what type of variable commitment status is and suggest an appropriate graph that could be made to display the distribution of this variable.
فتح الحزمة
افتح القفل للوصول البطاقات البالغ عددها 94 في هذه المجموعة.
فتح الحزمة
k this deck
17
Use the following information for questions:
A USA TODAY/CNN/Gallup Poll conducted April 19, 2005, was based on telephone interviews with 616 U.S. Catholics. One question asked was "When you think about your commitment to the Catholic Church, how much is your commitment affected by who the pope is -- a great deal, a moderate amount, not much, or not at all? The percentages are provided in the table below.
-Approximately how many respondents stated that their commitment is not affected much?
فتح الحزمة
افتح القفل للوصول البطاقات البالغ عددها 94 في هذه المجموعة.
فتح الحزمة
k this deck
18
The percent of data which lie between the lower and upper quartiles is
A) 10%.
B) 25%.
C) 50%.
D) 75%.
A) 10%.
B) 25%.
C) 50%.
D) 75%.
فتح الحزمة
افتح القفل للوصول البطاقات البالغ عددها 94 في هذه المجموعة.
فتح الحزمة
k this deck
19
A five-number summary for a data set is 35, 50, 60, 70, 90. About what percent of the observations are between 35 and 90?
A) 25%
B) 50%
C) 95%
D) 100%
A) 25%
B) 50%
C) 95%
D) 100%
فتح الحزمة
افتح القفل للوصول البطاقات البالغ عددها 94 في هذه المجموعة.
فتح الحزمة
k this deck
20
Use the following information for questions:
A five-number summary given in Case Study 1.1 for the fastest ever driving speeds reported by 102 women was: 30, 80, 89, 95, 130.
-What is the interquartile range of these data?
A) 6
B) 9
C) 15
D) 100
A five-number summary given in Case Study 1.1 for the fastest ever driving speeds reported by 102 women was: 30, 80, 89, 95, 130.
-What is the interquartile range of these data?
A) 6
B) 9
C) 15
D) 100
فتح الحزمة
افتح القفل للوصول البطاقات البالغ عددها 94 في هذه المجموعة.
فتح الحزمة
k this deck
21
Use the following information for questions:
A five-number summary given in Case Study 1.1 for the fastest ever driving speeds reported by 102 women was: 30, 80, 89, 95, 130.
-Fill in the blank in the following sentence: Approximately 25% of the women reported a fastest ever driving speed of at least _____ mph.
A) 25
B) 80
C) 89
D) 95
A five-number summary given in Case Study 1.1 for the fastest ever driving speeds reported by 102 women was: 30, 80, 89, 95, 130.
-Fill in the blank in the following sentence: Approximately 25% of the women reported a fastest ever driving speed of at least _____ mph.
A) 25
B) 80
C) 89
D) 95
فتح الحزمة
افتح القفل للوصول البطاقات البالغ عددها 94 في هذه المجموعة.
فتح الحزمة
k this deck
22
Use the following information for questions:
A five-number summary given in Case Study 1.1 for the fastest ever driving speeds reported by 102 women was: 30, 80, 89, 95, 130.
-Fill in the blank in the following sentence: Approximately 25% of the women reported a fastest ever driving speed of at most _____ mph.
A) 30
B) 80
C) 89
D) 95
A five-number summary given in Case Study 1.1 for the fastest ever driving speeds reported by 102 women was: 30, 80, 89, 95, 130.
-Fill in the blank in the following sentence: Approximately 25% of the women reported a fastest ever driving speed of at most _____ mph.
A) 30
B) 80
C) 89
D) 95
فتح الحزمة
افتح القفل للوصول البطاقات البالغ عددها 94 في هذه المجموعة.
فتح الحزمة
k this deck
23
Use the following information for questions:
In a survey, students are asked how many hours they study in a typical week. A five-number summary of the responses is: 2, 9, 14, 20, 60.
-Which interval describes the number of hours spent studying in a typical week for about 50% of the students sampled?
A) 2 to 9
B) 9 to 14
C) 9 to 20
D) 14 to 20
In a survey, students are asked how many hours they study in a typical week. A five-number summary of the responses is: 2, 9, 14, 20, 60.
-Which interval describes the number of hours spent studying in a typical week for about 50% of the students sampled?
A) 2 to 9
B) 9 to 14
C) 9 to 20
D) 14 to 20
فتح الحزمة
افتح القفل للوصول البطاقات البالغ عددها 94 في هذه المجموعة.
فتح الحزمة
k this deck
24
Use the following information for questions:
In a survey, students are asked how many hours they study in a typical week. A five-number summary of the responses is: 2, 9, 14, 20, 60.
-Fill in the blank in the following sentence. About 75% of the students spent at least ____ hours studying in a typical week.
A) 9
B) 14
C) 20
D) 45
In a survey, students are asked how many hours they study in a typical week. A five-number summary of the responses is: 2, 9, 14, 20, 60.
-Fill in the blank in the following sentence. About 75% of the students spent at least ____ hours studying in a typical week.
A) 9
B) 14
C) 20
D) 45
فتح الحزمة
افتح القفل للوصول البطاقات البالغ عددها 94 في هذه المجموعة.
فتح الحزمة
k this deck
25
Use the following information for questions:
The following histogram is for the weights (lbs) of 119 female college students.(Source: idealwtwomen dataset on the CD.)
-What is the approximate shape of the distribution?
A) Nearly symmetric.
B) Skewed to the left.
C) Skewed to the right.
D) Bimodal (has more than one peak).
The following histogram is for the weights (lbs) of 119 female college students.(Source: idealwtwomen dataset on the CD.)
-What is the approximate shape of the distribution?
A) Nearly symmetric.
B) Skewed to the left.
C) Skewed to the right.
D) Bimodal (has more than one peak).
فتح الحزمة
افتح القفل للوصول البطاقات البالغ عددها 94 في هذه المجموعة.
فتح الحزمة
k this deck
26
Use the following information for questions:
The following histogram is for the weights (lbs) of 119 female college students.(Source: idealwtwomen dataset on the CD.)
-The best choice for the median weight for the 119 women based on the histogram is approximately
A) 100 pounds.
B) 110 pounds.
C) 135 pounds.
D) 160 pounds.
The following histogram is for the weights (lbs) of 119 female college students.(Source: idealwtwomen dataset on the CD.)
-The best choice for the median weight for the 119 women based on the histogram is approximately
A) 100 pounds.
B) 110 pounds.
C) 135 pounds.
D) 160 pounds.
فتح الحزمة
افتح القفل للوصول البطاقات البالغ عددها 94 في هذه المجموعة.
فتح الحزمة
k this deck
27
Use the following information for questions:
The following histogram shows the distribution of the difference between the actual and "ideal" weights for 119 female college students. Ideal weights are responses to the question "What is your ideal weight"? The difference = actual -ideal. (Source: idealwtwomen dataset on the CD.)
-What is the approximate shape of the distribution?
A) Nearly symmetric.
B) Skewed to the left.
C) Skewed to the right.
D) Bimodal (has more than one peak).
فتح الحزمة
افتح القفل للوصول البطاقات البالغ عددها 94 في هذه المجموعة.
فتح الحزمة
k this deck
28
Use the following information for questions:
The following histogram shows the distribution of the difference between the actual and "ideal" weights for 119 female college students. Ideal weights are responses to the question "What is your ideal weight"? The difference = actual -ideal. (Source: idealwtwomen dataset on the CD.)
-The median of the distribution is approximately
A) -10 pounds.
B) 10 pounds.
C) 30 pounds.
D) 50 pounds.
فتح الحزمة
افتح القفل للوصول البطاقات البالغ عددها 94 في هذه المجموعة.
فتح الحزمة
k this deck
29
Use the following information for questions:
The following histogram shows the distribution of the difference between the actual and "ideal" weights for 119 female college students. Ideal weights are responses to the question "What is your ideal weight"? The difference = actual -ideal. (Source: idealwtwomen dataset on the CD.)
-Most of the women in this sample felt that their actual weight was
A) about the same as their ideal weight.
B) less than their ideal weight.
C) greater than their ideal weight.
D) no more than 2 pounds different from their ideal weight.
فتح الحزمة
افتح القفل للوصول البطاقات البالغ عددها 94 في هذه المجموعة.
فتح الحزمة
k this deck
30
Use the following information for questions:
The following histogram is for the weights (lbs) of 63 male college students.(Source: idealwtmen dataset on the CD.)
-What is the best description for the approximate shape of this distribution?
A) Nearly symmetric.
B) Skewed to the left.
C) Skewed to the right.
D) Bimodal (has more than one peak).
The following histogram is for the weights (lbs) of 63 male college students.(Source: idealwtmen dataset on the CD.)
-What is the best description for the approximate shape of this distribution?
A) Nearly symmetric.
B) Skewed to the left.
C) Skewed to the right.
D) Bimodal (has more than one peak).
فتح الحزمة
افتح القفل للوصول البطاقات البالغ عددها 94 في هذه المجموعة.
فتح الحزمة
k this deck
31
Use the following information for questions:
The following histogram is for the weights (lbs) of 63 male college students.(Source: idealwtmen dataset on the CD.)
-The median weight for the 63 men is approximately
A) 130 pounds.
B) 150 pounds.
C) 180 pounds.
D) 220 pounds.
The following histogram is for the weights (lbs) of 63 male college students.(Source: idealwtmen dataset on the CD.)
-The median weight for the 63 men is approximately
A) 130 pounds.
B) 150 pounds.
C) 180 pounds.
D) 220 pounds.
فتح الحزمة
افتح القفل للوصول البطاقات البالغ عددها 94 في هذه المجموعة.
فتح الحزمة
k this deck
32
Use the following information for questions:
The following histogram gives the distribution of the difference between the actual and ideal weights for a sample of male college students. Ideal weights are responses to the question "What is your ideal weight"? The difference = actual -ideal.
-What is the approximate shape of the distribution?
A) Nearly symmetric.
B) Skewed to the left.
C) Skewed to the right.
D) Bimodal (has more than one peak).
فتح الحزمة
افتح القفل للوصول البطاقات البالغ عددها 94 في هذه المجموعة.
فتح الحزمة
k this deck
33
Use the following information for questions:
The following histogram gives the distribution of the difference between the actual and ideal weights for a sample of male college students. Ideal weights are responses to the question "What is your ideal weight"? The difference = actual -ideal.
-The median of the distribution is approximately
A)-10 pounds.
B) 0 pounds.
C) 10 pounds.
D) 20 pounds.
فتح الحزمة
افتح القفل للوصول البطاقات البالغ عددها 94 في هذه المجموعة.
فتح الحزمة
k this deck
34
Use the following information for questions:
The following histogram gives the distribution of the difference between the actual and ideal weights for a sample of male college students. Ideal weights are responses to the question "What is your ideal weight"? The difference = actual -ideal.
-Most of the men in this sample felt that their actual weight was
A) about the same as their ideal weight.
B) less than their ideal weight.
C) greater than their ideal weight.
D) no more than 2 pounds different from their ideal weight.
فتح الحزمة
افتح القفل للوصول البطاقات البالغ عددها 94 في هذه المجموعة.
فتح الحزمة
k this deck
35
The following boxplot is for the results of the women's 400-meter dash final race during the 2000 Olympics in Sydney, Australia. Cathy Freeman won in 49.11 seconds. Choose the correct statement about the boxplot.
A) The median time is more than 50 seconds.
B) The median time is less than 49.75 seconds.
C) The fastest time of 49.11 seconds is an outlier.
D) The slowest time of 51.04 seconds is an outlier.
A) The median time is more than 50 seconds.
B) The median time is less than 49.75 seconds.
C) The fastest time of 49.11 seconds is an outlier.
D) The slowest time of 51.04 seconds is an outlier.
فتح الحزمة
افتح القفل للوصول البطاقات البالغ عددها 94 في هذه المجموعة.
فتح الحزمة
k this deck
36
Which of the following provides the most information about the shape of a data set?
A) Boxplot
B) Pie chart
C) Five number summary
D) Stem-and-leaf plot
A) Boxplot
B) Pie chart
C) Five number summary
D) Stem-and-leaf plot
فتح الحزمة
افتح القفل للوصول البطاقات البالغ عددها 94 في هذه المجموعة.
فتح الحزمة
k this deck
37
Use the following information for questions:
According to a national sleep foundation survey, around 31 million Americans are sleep deprived. They also say women need more sleep than men and are being short-changed. Below are the five number summaries for the number of hours of sleep at night based on a survey of American men and women.
Men: 5.5, 6, 6.5, 7.5, 9
Women: 4.5, 5, 6, 7, 8
-Write a sentence to compare men versus women in terms of the median amount of sleep at night
فتح الحزمة
افتح القفل للوصول البطاقات البالغ عددها 94 في هذه المجموعة.
فتح الحزمة
k this deck
38
Use the following information for questions:
According to a national sleep foundation survey, around 31 million Americans are sleep deprived. They also say women need more sleep than men and are being short-changed. Below are the five number summaries for the number of hours of sleep at night based on a survey of American men and women.
Men: 5.5, 6, 6.5, 7.5, 9
Women: 4.5, 5, 6, 7, 8
-Write a sentence to compare men versus women in terms of the interquartile range for the amount of sleep at night.
فتح الحزمة
افتح القفل للوصول البطاقات البالغ عددها 94 في هذه المجموعة.
فتح الحزمة
k this deck
39
Use the following information for questions:
According to a national sleep foundation survey, around 31 million Americans are sleep deprived. They also say women need more sleep than men and are being short-changed. Below are the five number summaries for the number of hours of sleep at night based on a survey of American men and women.
Men: 5.5, 6, 6.5, 7.5, 9
Women: 4.5, 5, 6, 7, 8
-What percent of women sleep at least 6 hours at night? What percent of men do so?
فتح الحزمة
افتح القفل للوصول البطاقات البالغ عددها 94 في هذه المجموعة.
فتح الحزمة
k this deck
40
Use the following information for questions:
A psychologist has developed a new technique intended to improve rote memory. To test the method against other standard methods, 45 high school students are selected at random and each is taught the new technique. The data on the number of words memorized correctly by the students were used to create the following histogram. Note the first class represents the interval [70, 72).
-What proportion of students memorized correctly at least 94 words?
فتح الحزمة
افتح القفل للوصول البطاقات البالغ عددها 94 في هذه المجموعة.
فتح الحزمة
k this deck
41
Use the following information for questions:
A psychologist has developed a new technique intended to improve rote memory. To test the method against other standard methods, 45 high school students are selected at random and each is taught the new technique. The data on the number of words memorized correctly by the students were used to create the following histogram. Note the first class represents the interval [70, 72).
-What is the overall shape of the distribution of the number of memorized words for these students?
فتح الحزمة
افتح القفل للوصول البطاقات البالغ عددها 94 في هذه المجموعة.
فتح الحزمة
k this deck
42
Use the following information for questions:
A psychologist has developed a new technique intended to improve rote memory. To test the method against other standard methods, 45 high school students are selected at random and each is taught the new technique. The data on the number of words memorized correctly by the students were used to create the following histogram. Note the first class represents the interval [70, 72).
-Can we calculate the exact range of the 45 responses? If yes, calculate it. If no, explain why not.
فتح الحزمة
افتح القفل للوصول البطاقات البالغ عددها 94 في هذه المجموعة.
فتح الحزمة
k this deck
43
What is the proper notation for the mean of a sample?
A)
B)
C)
D) s
A)
B)
C)
D) s
فتح الحزمة
افتح القفل للوصول البطاقات البالغ عددها 94 في هذه المجموعة.
فتح الحزمة
k this deck
44
A list of 5 pulse rates is: 70, 64, 80, 74, 92. What is the median for this list?
A) 74
B) 76
C) 77
D) 80
A) 74
B) 76
C) 77
D) 80
فتح الحزمة
افتح القفل للوصول البطاقات البالغ عددها 94 في هذه المجموعة.
فتح الحزمة
k this deck
45
Which one of the following statements is most correct about a skewed dataset?
A) The mean and median will usually be different.
B) The mean and median will usually be the same.
C) The mean will always be higher than the median.
D) Whether the mean and median are the same depends on whether the data set is skewed to the right or to the left.
A) The mean and median will usually be different.
B) The mean and median will usually be the same.
C) The mean will always be higher than the median.
D) Whether the mean and median are the same depends on whether the data set is skewed to the right or to the left.
فتح الحزمة
افتح القفل للوصول البطاقات البالغ عددها 94 في هذه المجموعة.
فتح الحزمة
k this deck
46
Use the following information for questions:
Listed below is a stem-and-leaf plot of the times it took 13 students to drink a 12 ounce beverage. Values for stems represent seconds and values for leaves represent tenths of a second.
3| 1234
3| 5
4| 0
5| 6
6| 11379
7|
8| 2
-What was the median time to drink the beverage?
A) 3.5 seconds.
B) 4.0 seconds.
C) 5.6 seconds.
D) 6.9 seconds.
فتح الحزمة
افتح القفل للوصول البطاقات البالغ عددها 94 في هذه المجموعة.
فتح الحزمة
k this deck
47
Use the following information for questions:
Listed below is a stem-and-leaf plot of the times it took 13 students to drink a 12 ounce beverage. Values for stems represent seconds and values for leaves represent tenths of a second.
3| 1234
3| 5
4| 0
5| 6
6| 11379
7|
8| 2
-The lower quartile is
A) 3.1 seconds.
B) 3.35 seconds.
C) 3.4 seconds.
D) 3.5 seconds.
فتح الحزمة
افتح القفل للوصول البطاقات البالغ عددها 94 في هذه المجموعة.
فتح الحزمة
k this deck
48
Use the following information for questions:
Listed below is a stem-and-leaf plot of the times it took 13 students to drink a 12 ounce beverage. Values for stems represent seconds and values for leaves represent tenths of a second.
3| 1234
3| 5
4| 0
5| 6
6| 11379
7|
8| 2
-The upper quartile is
A) 6.9 seconds.
B) 6.5 seconds.
C) 6.1 seconds.
D) 5.6 seconds.
فتح الحزمة
افتح القفل للوصول البطاقات البالغ عددها 94 في هذه المجموعة.
فتح الحزمة
k this deck
49
Which of the following would indicate that a dataset is skewed to the right?
A) The interquartile range is larger than the range.
B) The range is larger than the interquartile range.
C) The mean is much larger than the median.
D) The mean is much smaller than the median.
A) The interquartile range is larger than the range.
B) The range is larger than the interquartile range.
C) The mean is much larger than the median.
D) The mean is much smaller than the median.
فتح الحزمة
افتح القفل للوصول البطاقات البالغ عددها 94 في هذه المجموعة.
فتح الحزمة
k this deck
50
If an exam was worth 100 points, and your score was at the 80th percentile, then
A) your score was 80 out of 100.
B) 80% of the class had scores at or above your score.
C) 20% of the class had scores at or above your score.
D) 20% of the class had scores at or below your score.
A) your score was 80 out of 100.
B) 80% of the class had scores at or above your score.
C) 20% of the class had scores at or above your score.
D) 20% of the class had scores at or below your score.
فتح الحزمة
افتح القفل للوصول البطاقات البالغ عددها 94 في هذه المجموعة.
فتح الحزمة
k this deck
51
Use the following information for questions:
The table below provides a statistical summary of the number of CDs owned as reported by students in a class survey done at Penn State University.
-Approximately what percent of students own somewhere between 30 and 50 CDs?
A) 50%
B) 25%
C) 20%
D) 4%
The table below provides a statistical summary of the number of CDs owned as reported by students in a class survey done at Penn State University.
-Approximately what percent of students own somewhere between 30 and 50 CDs?
A) 50%
B) 25%
C) 20%
D) 4%
فتح الحزمة
افتح القفل للوصول البطاقات البالغ عددها 94 في هذه المجموعة.
فتح الحزمة
k this deck
52
Use the following information for questions:
The table below provides a statistical summary of the number of CDs owned as reported by students in a class survey done at Penn State University.
-What is the interquartile range for these data?
A) 500
B) 100
C) 70
D) 30
The table below provides a statistical summary of the number of CDs owned as reported by students in a class survey done at Penn State University.
-What is the interquartile range for these data?
A) 500
B) 100
C) 70
D) 30
فتح الحزمة
افتح القفل للوصول البطاقات البالغ عددها 94 في هذه المجموعة.
فتح الحزمة
k this deck
53
Use the following information for questions:
The table below provides a statistical summary of the number of CDs owned as reported by students in a class survey done at Penn State University.
-Based on the summary shown, which of the following statements most likely describes the shape of the CDs owned dataset?
A) The summary is evidence that the data are symmetric and bell-shaped.
B) The summary is evidence that the data are symmetric but not bell-shaped.
C) The summary is evidence that the data are skewed to the left.
D) The summary is evidence that the data are skewed to the right.
فتح الحزمة
افتح القفل للوصول البطاقات البالغ عددها 94 في هذه المجموعة.
فتح الحزمة
k this deck
54
Use the following information for questions:
The following boxplot gives the distribution of the ratings of a new brand of peanut butter for 50 randomly selected consumers (100 points possible with higher points corresponding to a more favorable rating).
-Based on the boxplot,
A) the distribution appears to be skewed to the left.
B) the distribution appears to be skewed to the right.
C) there appear to be outliers at about 60 and 90.
D) there do not appear to be any outliers.
فتح الحزمة
افتح القفل للوصول البطاقات البالغ عددها 94 في هذه المجموعة.
فتح الحزمة
k this deck
55
Use the following information for questions:
The following boxplot gives the distribution of the ratings of a new brand of peanut butter for 50 randomly selected consumers (100 points possible with higher points corresponding to a more favorable rating).
-The lower quartile is between
A) 50 to 60 points.
B) 60 to 70 points.
C) 70 to 75 points.
D) 80 to 90 points.
فتح الحزمة
افتح القفل للوصول البطاقات البالغ عددها 94 في هذه المجموعة.
فتح الحزمة
k this deck
56
Use the following information for questions:
The following boxplot gives the distribution of the ratings of a new brand of peanut butter for 50 randomly selected consumers (100 points possible with higher points corresponding to a more favorable rating).
-The median is
A) 60 points.
B) 70 points.
C) 75 points.
D) 80 points.
The following boxplot gives the distribution of the ratings of a new brand of peanut butter for 50 randomly selected consumers (100 points possible with higher points corresponding to a more favorable rating).
-The median is
A) 60 points.
B) 70 points.
C) 75 points.
D) 80 points.
فتح الحزمة
افتح القفل للوصول البطاقات البالغ عددها 94 في هذه المجموعة.
فتح الحزمة
k this deck
57
Use the following information for questions:
The following boxplot gives the distribution of the ratings of a new brand of peanut butter for 50 randomly selected consumers (100 points possible with higher points corresponding to a more favorable rating).
-The upper quartile is between
A) 50 to 60 points.
B) 60 to 70 points.
C) 70 to 75 points.
D) 80 to 90 points.
فتح الحزمة
افتح القفل للوصول البطاقات البالغ عددها 94 في هذه المجموعة.
فتح الحزمة
k this deck
58
A recent study was conducted to compare the age of vehicles in a student parking lot versus those in a faculty parking lot at a major university. A random sample of 15 cars was taken from each lot and the age of the car was recorded by taking the current year and subtracting the model year from it. The two boxplots are shown below to summarize these results.
Compare the two distributions based on these side-by-side boxplots.
Compare the two distributions based on these side-by-side boxplots. فتح الحزمة
افتح القفل للوصول البطاقات البالغ عددها 94 في هذه المجموعة.
فتح الحزمة
k this deck
59
An outlier is a data value that
A) is larger than 1 million.
B) equals the minimum value in a set of data.
C) equals the maximum value in a set of data.
D) is not consistent with the bulk of the data.
A) is larger than 1 million.
B) equals the minimum value in a set of data.
C) equals the maximum value in a set of data.
D) is not consistent with the bulk of the data.
فتح الحزمة
افتح القفل للوصول البطاقات البالغ عددها 94 في هذه المجموعة.
فتح الحزمة
k this deck
60
Which statistic is not resistant to an outlier in the data?
A) Lower quartile
B) Upper quartile
C) Median
D) Mean
A) Lower quartile
B) Upper quartile
C) Median
D) Mean
فتح الحزمة
افتح القفل للوصول البطاقات البالغ عددها 94 في هذه المجموعة.
فتح الحزمة
k this deck
61
Which one of these statistics is unaffected by outliers?
A) Interquartile range
B) Mean
C) Standard deviation
D) Range
A) Interquartile range
B) Mean
C) Standard deviation
D) Range
فتح الحزمة
افتح القفل للوصول البطاقات البالغ عددها 94 في هذه المجموعة.
فتح الحزمة
k this deck
62
Which one of the following statistics would be affected by an outlier?
A) Median
B) Standard deviation
C) Lower quartile
D) Upper quartile
A) Median
B) Standard deviation
C) Lower quartile
D) Upper quartile
فتح الحزمة
افتح القفل للوصول البطاقات البالغ عددها 94 في هذه المجموعة.
فتح الحزمة
k this deck
63
Which of the following could account for an outlier in a dataset?
A) Natural variability in the measurement of interest.
B) Recording the wrong category for an individual's value of a categorical variable.
C) A symmetric distribution for the measurement of interest.
D) Measuring more than one variable for each individual.
A) Natural variability in the measurement of interest.
B) Recording the wrong category for an individual's value of a categorical variable.
C) A symmetric distribution for the measurement of interest.
D) Measuring more than one variable for each individual.
فتح الحزمة
افتح القفل للوصول البطاقات البالغ عددها 94 في هذه المجموعة.
فتح الحزمة
k this deck
64
Outliers cause complications in all statistical analyses.
فتح الحزمة
افتح القفل للوصول البطاقات البالغ عددها 94 في هذه المجموعة.
فتح الحزمة
k this deck
65
Since outliers cause complications in statistical analyses, they should be discarded before computing summaries such as the mean and the standard deviation.
فتح الحزمة
افتح القفل للوصول البطاقات البالغ عددها 94 في هذه المجموعة.
فتح الحزمة
k this deck
66
What is a reasonable action if an outlier is a legitimate data value and represents natural variability for the group and variable measured?
فتح الحزمة
افتح القفل للوصول البطاقات البالغ عددها 94 في هذه المجموعة.
فتح الحزمة
k this deck
67
What is a reasonable action if an outlier was a mistake made in measuring the object?
فتح الحزمة
افتح القفل للوصول البطاقات البالغ عددها 94 في هذه المجموعة.
فتح الحزمة
k this deck
68
What is a reasonable action if an outlier is the value for the only young subject in a sample where all of the other values were for older subjects?
فتح الحزمة
افتح القفل للوصول البطاقات البالغ عددها 94 في هذه المجموعة.
فتح الحزمة
k this deck
69
Which choice lists two statistics that give information only about the location of a dataset and not the spread?
A) IQR and standard deviation
B) Mean and standard deviation
C) Median and range
D) Mean and median
A) IQR and standard deviation
B) Mean and standard deviation
C) Median and range
D) Mean and median
فتح الحزمة
افتح القفل للوصول البطاقات البالغ عددها 94 في هذه المجموعة.
فتح الحزمة
k this deck
70
Which of the following measures is not a measure of spread?
A) Variance
B) Standard deviation
C) Interquartile range
D) Median
A) Variance
B) Standard deviation
C) Interquartile range
D) Median
فتح الحزمة
افتح القفل للوصول البطاقات البالغ عددها 94 في هذه المجموعة.
فتح الحزمة
k this deck
71
Which one of the following summary statistics is not a measure of the variation (spread) in a data set?
A) Median
B) Standard deviation
C) Range
D) Interquartile range
A) Median
B) Standard deviation
C) Range
D) Interquartile range
فتح الحزمة
افتح القفل للوصول البطاقات البالغ عددها 94 في هذه المجموعة.
فتح الحزمة
k this deck
72
The head circumference (in centimeters) of 15 college-age males was obtained, resulting in the following measurements: 55, 56, 56, 56.5, 57, 57, 57, 57.5, 58, 58, 58, 58.5, 59, 59, 63. If the last measurement (63 cm's) were incorrectly recorded as 73, which one of the following statistics would change?
A) Q1 (1st quartile)
B) Standard deviation
C) Median
D) Q3 (3rd quartile)
A) Q1 (1st quartile)
B) Standard deviation
C) Median
D) Q3 (3rd quartile)
فتح الحزمة
افتح القفل للوصول البطاقات البالغ عددها 94 في هذه المجموعة.
فتح الحزمة
k this deck
73
Which of the following is true about the relationship between the standard deviation s and the range for a large bell-shaped data set?
A) The range is approximately 1/2 of a standard deviation.
B) The range is approximately 2 standard deviations.
C) The range is approximately 6 standard deviations.
D) The range is approximately 1/6 of a standard deviation
A) The range is approximately 1/2 of a standard deviation.
B) The range is approximately 2 standard deviations.
C) The range is approximately 6 standard deviations.
D) The range is approximately 1/6 of a standard deviation
فتح الحزمة
افتح القفل للوصول البطاقات البالغ عددها 94 في هذه المجموعة.
فتح الحزمة
k this deck
74
By inspection, determine which of the following sets of numbers has the smallest standard deviation.
A) 2, 3, 4, 5
B) 4, 4, 4, 5
C) 0, 0, 5, 5
D) 5, 5, 5, 5
A) 2, 3, 4, 5
B) 4, 4, 4, 5
C) 0, 0, 5, 5
D) 5, 5, 5, 5
فتح الحزمة
افتح القفل للوصول البطاقات البالغ عددها 94 في هذه المجموعة.
فتح الحزمة
k this deck
75
The mean hours of sleep that students get per night is 7 hours, the standard deviation of hours of sleep is 1.7 hours, and the distribution is approximately normal. Complete the following sentence. For about 95% of students, nightly amount of sleep is between ______.
A) 5.3 and 8.7 hrs
B) 5 and 9 hrs
C) 3.6 and 10.4 hrs
D) 1.9 and 12.1 hrs
A) 5.3 and 8.7 hrs
B) 5 and 9 hrs
C) 3.6 and 10.4 hrs
D) 1.9 and 12.1 hrs
فتح الحزمة
افتح القفل للوصول البطاقات البالغ عددها 94 في هذه المجموعة.
فتح الحزمة
k this deck
76
For a large sample of blood pressure values, the mean is 120 and the standard deviation is 10. Assuming a bell-shaped curve, which interval is likely to be about the interval that contains 95% of the blood pressures in the sample?
A) 110 to 130
B) 100 to 140
C) 90 to 150
D) 50 to 190
A) 110 to 130
B) 100 to 140
C) 90 to 150
D) 50 to 190
فتح الحزمة
افتح القفل للوصول البطاقات البالغ عددها 94 في هذه المجموعة.
فتح الحزمة
k this deck
77
For a large sample of blood pressure values, the mean is 120 and the standard deviation is 10. Assuming a bell-shaped curve, which interval is likely to be about the interval from the minimum to maximum blood pressures in the sample?
A) 120 to 150
B) 110 to 130
C) 90 to 150
D) 50 to 190
A) 120 to 150
B) 110 to 130
C) 90 to 150
D) 50 to 190
فتح الحزمة
افتح القفل للوصول البطاقات البالغ عددها 94 في هذه المجموعة.
فتح الحزمة
k this deck
78
Which of the following would indicate that a dataset is not bell-shaped?
A) The range is equal to 5 standard deviations.
B) The range is larger than the interquartile range.
C) The mean is much smaller than the median.
D) There are no outliers.
A) The range is equal to 5 standard deviations.
B) The range is larger than the interquartile range.
C) The mean is much smaller than the median.
D) There are no outliers.
فتح الحزمة
افتح القفل للوصول البطاقات البالغ عددها 94 في هذه المجموعة.
فتح الحزمة
k this deck
79
The possible values for a standardized score (z-score)
A) can be any number: positive, negative, or 0.
B) must be within the range from -3 to 3
C) must be non-negative.
D) must be strictly positive.
A) can be any number: positive, negative, or 0.
B) must be within the range from -3 to 3
C) must be non-negative.
D) must be strictly positive.
فتح الحزمة
افتح القفل للوصول البطاقات البالغ عددها 94 في هذه المجموعة.
فتح الحزمة
k this deck
80
Which of the following best describes the standardized (z) score for an observation?
A) It is the number of standard deviations the observation falls from the mean.
B) It is the most common score for that type of observation.
C) It is one standard deviation more than the observation.
D) It is the center of the list of scores from which the observation was taken.
A) It is the number of standard deviations the observation falls from the mean.
B) It is the most common score for that type of observation.
C) It is one standard deviation more than the observation.
D) It is the center of the list of scores from which the observation was taken.
فتح الحزمة
افتح القفل للوصول البطاقات البالغ عددها 94 في هذه المجموعة.
فتح الحزمة
k this deck
فتح الحزمة
افتح القفل للوصول البطاقات البالغ عددها 94 في هذه المجموعة.


