Deck 16: Regression
ملء الشاشة (f)
سؤال
سؤال
سؤال
سؤال
سؤال
سؤال
سؤال
سؤال
سؤال
سؤال
سؤال
The advertising expense and profit of a company in thousands of dollars for each of five years is given below:
 a. Solve the normal equations to find the equation of the least-squares line which will allow us to predict profit from advertising expense.
b. Check your values of and using the "solutions of normal equation."
c. If advertising expense is to be for a particular year, predict the profit for that year.
a. Solve the normal equations to find the equation of the least-squares line which will allow us to predict profit from advertising expense.b. Check your values of and using the "solutions of normal equation."
c. If advertising expense is to be for a particular year, predict the profit for that year.
سؤال
A personnel manager wants to predict the salary (in thousands of dollars) of a systems analyst based on number of years of experience. A random sample of 12 systems analysts produces the following results:
a. Find the least-squares line which predicts salary based on years of experience.
b. Predict the salary of a system analyst with five years experience.
a. Find the least-squares line which predicts salary based on years of experience.
b. Predict the salary of a system analyst with five years experience.
سؤال
Table 16.1
The table below shows annual profit figures (in thousands of dollars) for a company.
-Fit an exponential trend to the data in Table 16.1.
The table below shows annual profit figures (in thousands of dollars) for a company.
-Fit an exponential trend to the data in Table 16.1.
سؤال
Table 16.1
The table below shows annual profit figures (in thousands of dollars) for a company.
-Fit a power curve to the data in Table 16.1.
The table below shows annual profit figures (in thousands of dollars) for a company.
-Fit a power curve to the data in Table 16.1.
سؤال
The following data gives the demand of a product (in hundreds of units) for five different price levels (in dollars):
 Fit a parabola to this data.
Fit a parabola to this data. سؤال
Table 16.2
The data gives the number of year olds (for the given years) whose families earn between per year and the number of U.S. college students for the given year ( ).
-Use the data in Table 16.2 to:
a. Find the least-squares regression equation which predicts from .
b. Find the standard error of estimate.
c. Predict if .
سؤال
Table 16.3
A study is supposed to examine the relationship between the amount spent on advertising a new product and consumer awareness of the product ( ) based on the proportion of people who have heard of it. Suppose a sample shows the data below for four different products.
-Use the data in Table 16.3 to solve the following:
a. Find the equation of the least-squares line that will allow us to predict consumer awareness from the advertising expense.
b. Calculate the standard error of estimate.
c. Can the equation found in part (a) be used for an advertising expense of 60 thousand dollars? Why or why not?
سؤال
سؤال
سؤال
سؤال
سؤال
سؤال
سؤال
سؤال
سؤال
سؤال
سؤال
سؤال
سؤال
سؤال
سؤال
سؤال
سؤال
سؤال
سؤال
سؤال
سؤال
سؤال

فتح الحزمة
قم بالتسجيل لفتح البطاقات في هذه المجموعة!
Unlock Deck
Unlock Deck
1/39
العب
ملء الشاشة (f)
Deck 16: Regression
1
The slope of the true regression line is given by
A) .
B) .
C) .
D) .
A) .
B) .
C) .
D) .
.
2
In regression analysis, the quantity that gives the amount by which changes for a unit change in is called the
A) -intercept.
B) slope.
C) standard error of estimates.
D) standard deviation.
A) -intercept.
B) slope.
C) standard error of estimates.
D) standard deviation.
slope.
3
The symbol used to indicate the values of points on a least-squares line is
A) .
B) .
C) .
D) .
A) .
B) .
C) .
D) .
.
4
The normal equations are obtained from minimizing
A) .
B) .
C) .
D) .
A) .
B) .
C) .
D) .
فتح الحزمة
افتح القفل للوصول البطاقات البالغ عددها 39 في هذه المجموعة.
فتح الحزمة
k this deck
5
The symbol in the least-squares equation is a sample estimate of
A) .
B) .
C) .
D) .
A) .
B) .
C) .
D) .
فتح الحزمة
افتح القفل للوصول البطاقات البالغ عددها 39 في هذه المجموعة.
فتح الحزمة
k this deck
6
If we are testing the hypothesis that against the alternative that when there are 12 data points and , the correct value to be used is
A) 1.812 .
B) 1.796 .
C) 2.228 .
D) 2.201 .
A) 1.812 .
B) 1.796 .
C) 2.228 .
D) 2.201 .
فتح الحزمة
افتح القفل للوصول البطاقات البالغ عددها 39 في هذه المجموعة.
فتح الحزمة
k this deck
7
The symbol in the least-squares equation is a sample estimate of
A) .
B) .
C) .
D) .
A) .
B) .
C) .
D) .
فتح الحزمة
افتح القفل للوصول البطاقات البالغ عددها 39 في هذه المجموعة.
فتح الحزمة
k this deck
8
Given the regression equation , the most central value in a confidence interval for the mean of , given is
A) 4 .
B) 31 .
C) 7 .
D) 3 .
A) 4 .
B) 31 .
C) 7 .
D) 3 .
فتح الحزمة
افتح القفل للوصول البطاقات البالغ عددها 39 في هذه المجموعة.
فتح الحزمة
k this deck
9
The symbol that represents the true regression line is
A) .
B) .
C) .
D) .
A) .
B) .
C) .
D) .
فتح الحزمة
افتح القفل للوصول البطاقات البالغ عددها 39 في هذه المجموعة.
فتح الحزمة
k this deck
10
The width of a confidence interval for will be increased if
A) is moved closer to .
B) is decreased.
C) is increased.
D) is increased.
A) is moved closer to .
B) is decreased.
C) is increased.
D) is increased.
فتح الحزمة
افتح القفل للوصول البطاقات البالغ عددها 39 في هذه المجموعة.
فتح الحزمة
k this deck
11
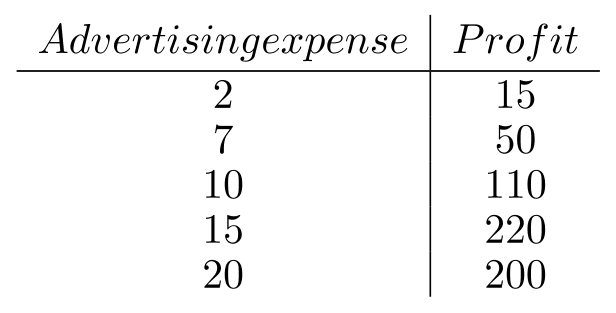
The advertising expense and profit of a company in thousands of dollars for each of five years is given below:
a. Solve the normal equations to find the equation of the least-squares line which will allow us to predict profit from advertising expense.
b. Check your values of and using the "solutions of normal equation."
c. If advertising expense is to be for a particular year, predict the profit for that year.
a. Solve the normal equations to find the equation of the least-squares line which will allow us to predict profit from advertising expense.b. Check your values of and using the "solutions of normal equation."
c. If advertising expense is to be for a particular year, predict the profit for that year.
فتح الحزمة
افتح القفل للوصول البطاقات البالغ عددها 39 في هذه المجموعة.
فتح الحزمة
k this deck
12
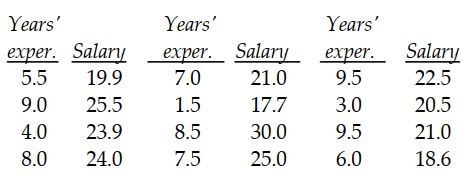
A personnel manager wants to predict the salary (in thousands of dollars) of a systems analyst based on number of years of experience. A random sample of 12 systems analysts produces the following results:
a. Find the least-squares line which predicts salary based on years of experience.
b. Predict the salary of a system analyst with five years experience.
a. Find the least-squares line which predicts salary based on years of experience.
b. Predict the salary of a system analyst with five years experience.
فتح الحزمة
افتح القفل للوصول البطاقات البالغ عددها 39 في هذه المجموعة.
فتح الحزمة
k this deck
13
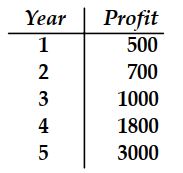
Table 16.1
The table below shows annual profit figures (in thousands of dollars) for a company.
-Fit an exponential trend to the data in Table 16.1.
The table below shows annual profit figures (in thousands of dollars) for a company.
-Fit an exponential trend to the data in Table 16.1.
فتح الحزمة
افتح القفل للوصول البطاقات البالغ عددها 39 في هذه المجموعة.
فتح الحزمة
k this deck
14
Table 16.1
The table below shows annual profit figures (in thousands of dollars) for a company.
-Fit a power curve to the data in Table 16.1.
The table below shows annual profit figures (in thousands of dollars) for a company.
-Fit a power curve to the data in Table 16.1.
فتح الحزمة
افتح القفل للوصول البطاقات البالغ عددها 39 في هذه المجموعة.
فتح الحزمة
k this deck
15
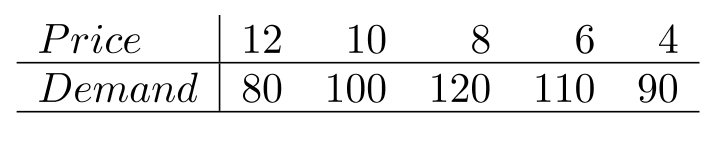
The following data gives the demand of a product (in hundreds of units) for five different price levels (in dollars):
Fit a parabola to this data.
Fit a parabola to this data. فتح الحزمة
افتح القفل للوصول البطاقات البالغ عددها 39 في هذه المجموعة.
فتح الحزمة
k this deck
16
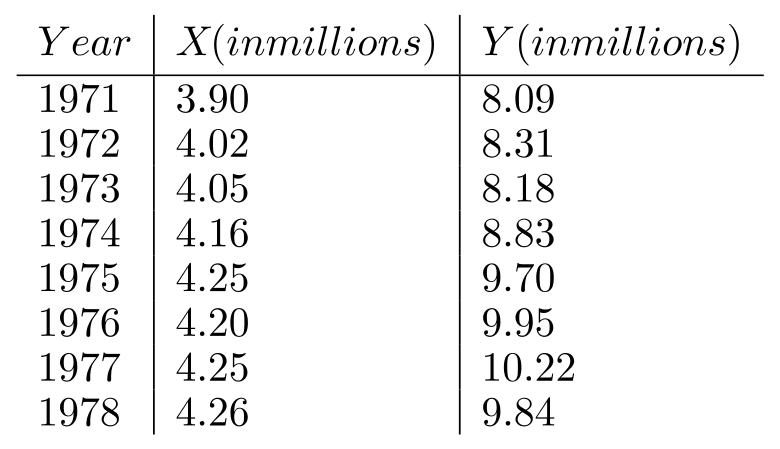
Table 16.2
The data gives the number of year olds (for the given years) whose families earn between per year and the number of U.S. college students for the given year ( ).
-Use the data in Table 16.2 to:
a. Find the least-squares regression equation which predicts from .
b. Find the standard error of estimate.
c. Predict if .
The data gives the number of year olds (for the given years) whose families earn between per year and the number of U.S. college students for the given year ( ).
-Use the data in Table 16.2 to:
a. Find the least-squares regression equation which predicts from .
b. Find the standard error of estimate.
c. Predict if .
فتح الحزمة
افتح القفل للوصول البطاقات البالغ عددها 39 في هذه المجموعة.
فتح الحزمة
k this deck
17
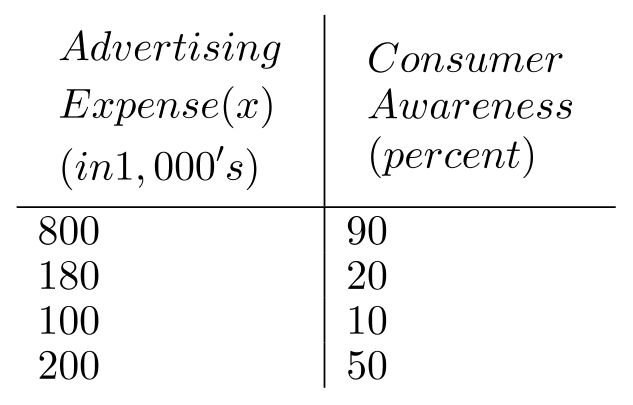
Table 16.3
A study is supposed to examine the relationship between the amount spent on advertising a new product and consumer awareness of the product ( ) based on the proportion of people who have heard of it. Suppose a sample shows the data below for four different products.
-Use the data in Table 16.3 to solve the following:
a. Find the equation of the least-squares line that will allow us to predict consumer awareness from the advertising expense.
b. Calculate the standard error of estimate.
c. Can the equation found in part (a) be used for an advertising expense of 60 thousand dollars? Why or why not?
A study is supposed to examine the relationship between the amount spent on advertising a new product and consumer awareness of the product ( ) based on the proportion of people who have heard of it. Suppose a sample shows the data below for four different products.
-Use the data in Table 16.3 to solve the following:
a. Find the equation of the least-squares line that will allow us to predict consumer awareness from the advertising expense.
b. Calculate the standard error of estimate.
c. Can the equation found in part (a) be used for an advertising expense of 60 thousand dollars? Why or why not?
فتح الحزمة
افتح القفل للوصول البطاقات البالغ عددها 39 في هذه المجموعة.
فتح الحزمة
k this deck
18
Using a 95% confidence level, construct an interval estimate of the mean consumer awareness of a single product, assuming is spent for its promotion.
فتح الحزمة
افتح القفل للوصول البطاقات البالغ عددها 39 في هذه المجموعة.
فتح الحزمة
k this deck
19
Using a significance level, test the hypothesis that advertising expenditure has no impact on consumer awareness of a single product, assuming is spent for its promotion.
فتح الحزمة
افتح القفل للوصول البطاقات البالغ عددها 39 في هذه المجموعة.
فتح الحزمة
k this deck
20
The estimated regression line is the line that minimizes the sum of the squares of the distances from the given points to the line.
فتح الحزمة
افتح القفل للوصول البطاقات البالغ عددها 39 في هذه المجموعة.
فتح الحزمة
k this deck
21
The symbol gives the true mean of for a given value of .
فتح الحزمة
افتح القفل للوصول البطاقات البالغ عددها 39 في هذه المجموعة.
فتح الحزمة
k this deck
22
The standard deviation measures the dispersion of the values about the estimated least-squares line.
فتح الحزمة
افتح القفل للوصول البطاقات البالغ عددها 39 في هذه المجموعة.
فتح الحزمة
k this deck
23
A confidence interval for a future individual value is wider than a confidence interval for a mean of when .
فتح الحزمة
افتح القفل للوصول البطاقات البالغ عددها 39 في هذه المجموعة.
فتح الحزمة
k this deck
24
In regression analysis, the variable that we are trying to predict is called the independent variable.
فتح الحزمة
افتح القفل للوصول البطاقات البالغ عددها 39 في هذه المجموعة.
فتح الحزمة
k this deck
25
Multiple regression involves at least two dependent variables.
فتح الحزمة
افتح القفل للوصول البطاقات البالغ عددها 39 في هذه المجموعة.
فتح الحزمة
k this deck
26
In general, the smaller the standard error of estimate the better the least-squares regression line.
فتح الحزمة
افتح القفل للوصول البطاقات البالغ عددها 39 في هذه المجموعة.
فتح الحزمة
k this deck
27
The estimated and true regression lines are always the same.
فتح الحزمة
افتح القفل للوصول البطاقات البالغ عددها 39 في هذه المجموعة.
فتح الحزمة
k this deck
28
If the slope of the true regression line is zero, then the slope of the sample regression line may be different from zero.
فتح الحزمة
افتح القفل للوصول البطاقات البالغ عددها 39 في هذه المجموعة.
فتح الحزمة
k this deck
29
If paired data plotted on log-log paper fall close to a straight line, we would expect a parabola to provide a good fit for the data.
فتح الحزمة
افتح القفل للوصول البطاقات البالغ عددها 39 في هذه المجموعة.
فتح الحزمة
k this deck
30
When we make inferences about the regression coefficients and , the number of degrees of freedom that is required to use the table is __________.
فتح الحزمة
افتح القفل للوصول البطاقات البالغ عددها 39 في هذه المجموعة.
فتح الحزمة
k this deck
31
The term which measures the dispersion of the values about the estimated least-squares line is called __________.
فتح الحزمة
افتح القفل للوصول البطاقات البالغ عددها 39 في هذه المجموعة.
فتح الحزمة
k this deck
32
In linear regression analysis, we assume that for each value of the variable to be predicted has a mean of __________.
فتح الحزمة
افتح القفل للوصول البطاقات البالغ عددها 39 في هذه المجموعة.
فتح الحزمة
k this deck
33
The symbols used for the estimated regression coefficients when there is one independent variable are __________ and __________
فتح الحزمة
افتح القفل للوصول البطاقات البالغ عددها 39 في هذه المجموعة.
فتح الحزمة
k this deck
34
In a test of the null hypothesis that against the alternative hypothesis that , the null hypothesis will be rejected if the obtained value is __________ the tabled value.
فتح الحزمة
افتح القفل للوصول البطاقات البالغ عددها 39 في هذه المجموعة.
فتح الحزمة
k this deck
35
When we use observed data to derive a mathematical equation and use it to predict the value of one variable from a given value of another, the procedure is known as __________.
فتح الحزمة
افتح القفل للوصول البطاقات البالغ عددها 39 في هذه المجموعة.
فتح الحزمة
k this deck
36
The symbol for the mean of when is __________.
فتح الحزمة
افتح القفل للوصول البطاقات البالغ عددها 39 في هذه المجموعة.
فتح الحزمة
k this deck
37
In a two-tailed hypothesis test that , the tabled values are -2.262 and 2.262 . If the obtained value is 1.83 , the null hypothesis __________ rejected.
فتح الحزمة
افتح القفل للوصول البطاقات البالغ عددها 39 في هذه المجموعة.
فتح الحزمة
k this deck
38
A multiple regression equation with three independent variables has the form __________.
فتح الحزمة
افتح القفل للوصول البطاقات البالغ عددها 39 في هذه المجموعة.
فتح الحزمة
k this deck
39
If paired data plotted on semi-log paper fall close to a straight line, then we would expect a (an) __________.
فتح الحزمة
افتح القفل للوصول البطاقات البالغ عددها 39 في هذه المجموعة.
فتح الحزمة
k this deck
فتح الحزمة
افتح القفل للوصول البطاقات البالغ عددها 39 في هذه المجموعة.


