Deck 17: Correlation
ملء الشاشة (f)
سؤال
سؤال
سؤال
سؤال
سؤال
سؤال
سؤال
Table 17.1
The mathematics S.A.T. scores and college grade point averages of eight students are given below.
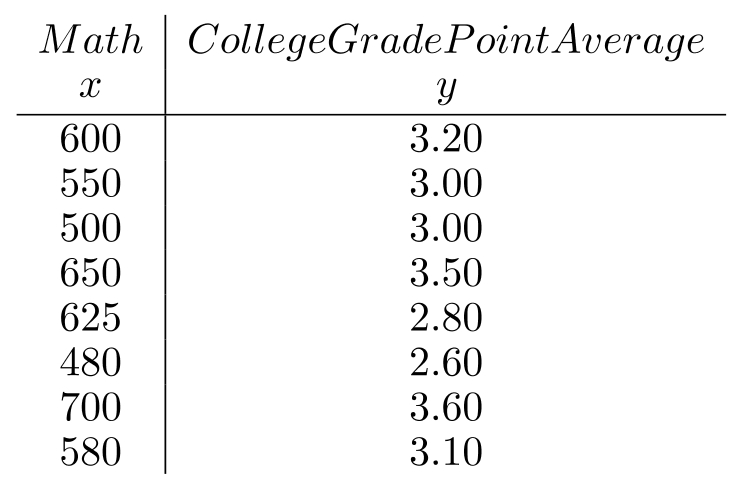
-Use Table 17.1 to solve the following:
a. Calculate the correlation coefficient .
b. What is the proportion of total variation in that is accounted for by ?
c. Test the null hypothesis of no relationship between the two variables at .
d. Calculate a confidence interval for .
The mathematics S.A.T. scores and college grade point averages of eight students are given below.
-Use Table 17.1 to solve the following:
a. Calculate the correlation coefficient .
b. What is the proportion of total variation in that is accounted for by ?
c. Test the null hypothesis of no relationship between the two variables at .
d. Calculate a confidence interval for .
سؤال
سؤال
Table 17.2
Below is a list of countries with their 1979 "excess monetary growth*" ( along with their mid -1980 inflation rate).
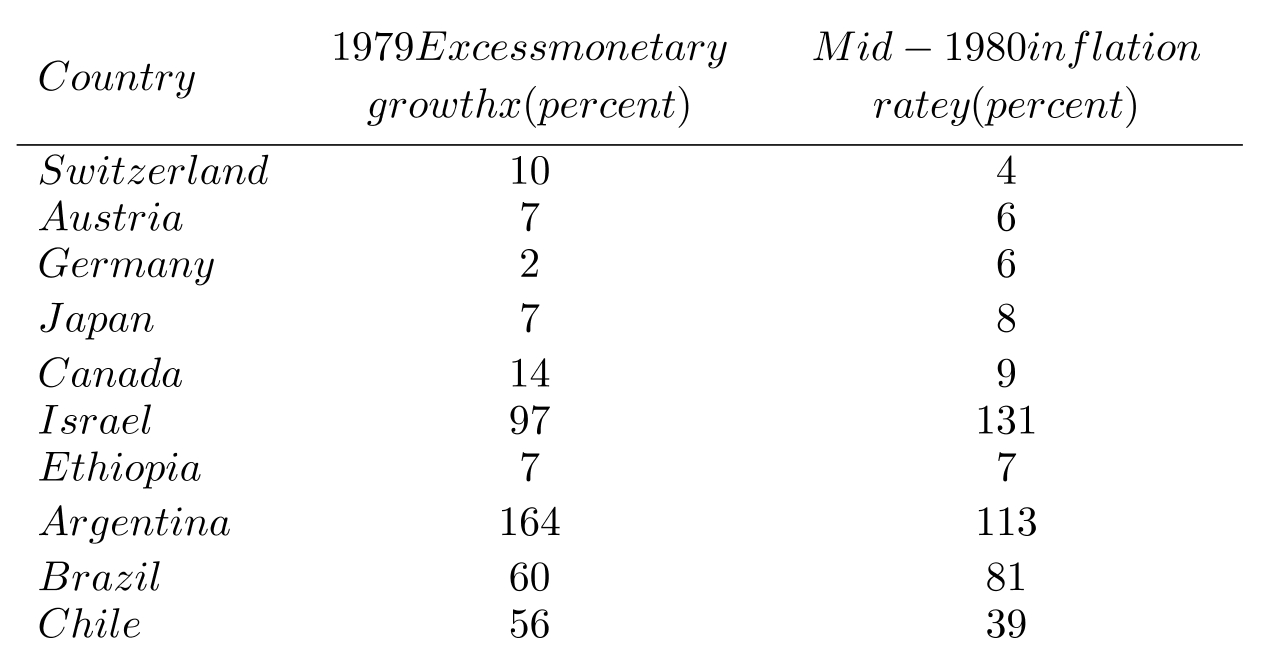 *Excess monetary growth is the extent to which money supply growth exceeds to the growth of constant dollar GNP; specifically, the ratio of 1979 M2 to 1978 M2 is divided by the ratio of 1979 real GNP to 1978 real GNP.
-Use Table 17.2 to solve the following:
a. Calculate the correlation coefficient.
b. What is the proportion of the total variation in inflation rate that is explained by excess monetary growth?
c. Test the null hypothesis that at .
d. Calculate a confidence interval for .
Below is a list of countries with their 1979 "excess monetary growth*" ( along with their mid -1980 inflation rate).
*Excess monetary growth is the extent to which money supply growth exceeds to the growth of constant dollar GNP; specifically, the ratio of 1979 M2 to 1978 M2 is divided by the ratio of 1979 real GNP to 1978 real GNP.-Use Table 17.2 to solve the following:
a. Calculate the correlation coefficient.
b. What is the proportion of the total variation in inflation rate that is explained by excess monetary growth?
c. Test the null hypothesis that at .
d. Calculate a confidence interval for .
سؤال
Table 17.3
The table below gives the number of housing starts and the unemployment rates for a sequence of quarters:
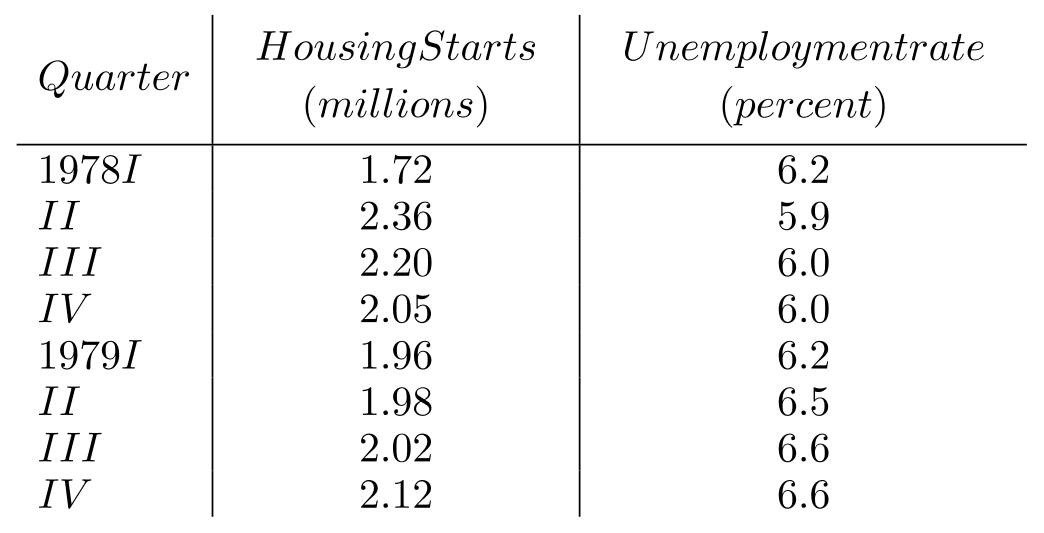
-Use Table 17.3 to solve the following:
a. Calculate the correlation coefficient.
b. What is the proportion of the total variation in unemployment rates that is explained by the number of housing starts?
c. Test the null hypothesis that at .
The table below gives the number of housing starts and the unemployment rates for a sequence of quarters:
-Use Table 17.3 to solve the following:
a. Calculate the correlation coefficient.
b. What is the proportion of the total variation in unemployment rates that is explained by the number of housing starts?
c. Test the null hypothesis that at .
سؤال
سؤال
سؤال
سؤال
سؤال
سؤال
سؤال
سؤال
سؤال
سؤال
سؤال
سؤال
سؤال
سؤال
سؤال
سؤال
سؤال
سؤال

فتح الحزمة
قم بالتسجيل لفتح البطاقات في هذه المجموعة!
Unlock Deck
Unlock Deck
1/28
العب
ملء الشاشة (f)
Deck 17: Correlation
1
A statistic that measures the relationship between variables while eliminating the effects of other variables is called the
A) correlation coefficient.
B) regression coefficient.
C) standard error of estimate.
D) partial correlation coefficient.
A) correlation coefficient.
B) regression coefficient.
C) standard error of estimate.
D) partial correlation coefficient.
partial correlation coefficient.
2
The sum is called the __________ sum of squares.
A) regression
B) total
C) at least
D) residual
A) regression
B) total
C) at least
D) residual
regression
3
The sum is called the __________ sum of squares.
A) regression
B) total
C) at least
D) residual
A) regression
B) total
C) at least
D) residual
total
4
In regression analysis, the quantity that gives the amount by which changes for a unit change in is called the
A) partial correlation coefficient.
B) slope of the regression line.
C) -intercept of the regression line.
D) correlation coefficient.
A) partial correlation coefficient.
B) slope of the regression line.
C) -intercept of the regression line.
D) correlation coefficient.
فتح الحزمة
افتح القفل للوصول البطاقات البالغ عددها 28 في هذه المجموعة.
فتح الحزمة
k this deck
5
The correlation coefficient is equal to
A) the total variation.
B) the unexplained variation.
C) one minus the proportion of unexplained variation.
D) the square root of the explained variation.
A) the total variation.
B) the unexplained variation.
C) one minus the proportion of unexplained variation.
D) the square root of the explained variation.
فتح الحزمة
افتح القفل للوصول البطاقات البالغ عددها 28 في هذه المجموعة.
فتح الحزمة
k this deck
6
If the hypothesis that is rejected, then
A) must be zero.
B) must be close to one.
C) the regression slope may be close to zero.
D) there is a strong relationship between and .
A) must be zero.
B) must be close to one.
C) the regression slope may be close to zero.
D) there is a strong relationship between and .
فتح الحزمة
افتح القفل للوصول البطاقات البالغ عددها 28 في هذه المجموعة.
فتح الحزمة
k this deck
7
Table 17.1
The mathematics S.A.T. scores and college grade point averages of eight students are given below.
-Use Table 17.1 to solve the following:
a. Calculate the correlation coefficient .
b. What is the proportion of total variation in that is accounted for by ?
c. Test the null hypothesis of no relationship between the two variables at .
d. Calculate a confidence interval for .
فتح الحزمة
افتح القفل للوصول البطاقات البالغ عددها 28 في هذه المجموعة.
فتح الحزمة
k this deck
8
In a multiple regression problem, the regression sum of squares is and the total sum of squares is . Find the value of the multiple correlation coefficient.
فتح الحزمة
افتح القفل للوصول البطاقات البالغ عددها 28 في هذه المجموعة.
فتح الحزمة
k this deck
9
Table 17.2
Below is a list of countries with their 1979 "excess monetary growth*" ( along with their mid -1980 inflation rate).
*Excess monetary growth is the extent to which money supply growth exceeds to the growth of constant dollar GNP; specifically, the ratio of 1979 M2 to 1978 M2 is divided by the ratio of 1979 real GNP to 1978 real GNP.
-Use Table 17.2 to solve the following:
a. Calculate the correlation coefficient.
b. What is the proportion of the total variation in inflation rate that is explained by excess monetary growth?
c. Test the null hypothesis that at .
d. Calculate a confidence interval for .
Below is a list of countries with their 1979 "excess monetary growth*" ( along with their mid -1980 inflation rate).
*Excess monetary growth is the extent to which money supply growth exceeds to the growth of constant dollar GNP; specifically, the ratio of 1979 M2 to 1978 M2 is divided by the ratio of 1979 real GNP to 1978 real GNP.-Use Table 17.2 to solve the following:
a. Calculate the correlation coefficient.
b. What is the proportion of the total variation in inflation rate that is explained by excess monetary growth?
c. Test the null hypothesis that at .
d. Calculate a confidence interval for .
فتح الحزمة
افتح القفل للوصول البطاقات البالغ عددها 28 في هذه المجموعة.
فتح الحزمة
k this deck
10
Table 17.3
The table below gives the number of housing starts and the unemployment rates for a sequence of quarters:
-Use Table 17.3 to solve the following:
a. Calculate the correlation coefficient.
b. What is the proportion of the total variation in unemployment rates that is explained by the number of housing starts?
c. Test the null hypothesis that at .
فتح الحزمة
افتح القفل للوصول البطاقات البالغ عددها 28 في هذه المجموعة.
فتح الحزمة
k this deck
11
A financial economist wants to evaluate how interest rates affect the inflation rate. Here are some results on yearly prime interest rates and inflation rates for the 13 years 1965 through 1977. , .
For the situation above:
a. Calculate the sample coefficient of determination and correlation coefficient.
b. Give the proportion of variation explained by the regression line.
c. Test the null hypothesis of no correlation against a two-tailed alternative at the 0.01 significance level.
For the situation above:
a. Calculate the sample coefficient of determination and correlation coefficient.
b. Give the proportion of variation explained by the regression line.
c. Test the null hypothesis of no correlation against a two-tailed alternative at the 0.01 significance level.
فتح الحزمة
افتح القفل للوصول البطاقات البالغ عددها 28 في هذه المجموعة.
فتح الحزمة
k this deck
12
For two sets of data and . Suppose each value of is measured in feet. If each value is converted to inches by multiplying by 12, what is the new value of ? Suppose, instead, a constant is added to each value of . What is the new value?
فتح الحزمة
افتح القفل للوصول البطاقات البالغ عددها 28 في هذه المجموعة.
فتح الحزمة
k this deck
13
The variables circulation and advertising income are used to predict the annual profit of a daily newspaper ( ). A multiple correlation coefficient of 0.65 is obtained. For predicting annual profit on the basis of advertising income alone, a value of is found. Comment on these results.
فتح الحزمة
افتح القفل للوصول البطاقات البالغ عددها 28 في هذه المجموعة.
فتح الحزمة
k this deck
14
If has a value of 0.60 , then of the variation in can be explained by the variation in .
فتح الحزمة
افتح القفل للوصول البطاقات البالغ عددها 28 في هذه المجموعة.
فتح الحزمة
k this deck
15
In order to find the correlation coefficient, the estimated least-squares regression line is always found first.
فتح الحزمة
افتح القفل للوصول البطاقات البالغ عددها 28 في هذه المجموعة.
فتح الحزمة
k this deck
16
It is never possible for to exceed .
فتح الحزمة
افتح القفل للوصول البطاقات البالغ عددها 28 في هذه المجموعة.
فتح الحزمة
k this deck
17
A high correlation between two variables will not prove that one variable causes the other to occur.
فتح الحزمة
افتح القفل للوصول البطاقات البالغ عددها 28 في هذه المجموعة.
فتح الحزمة
k this deck
18
The hypothesis of no correlation between two variables can always be rejected if is greater than zero.
فتح الحزمة
افتح القفل للوصول البطاقات البالغ عددها 28 في هذه المجموعة.
فتح الحزمة
k this deck
19
The value of is a natural logarithm.
فتح الحزمة
افتح القفل للوصول البطاقات البالغ عددها 28 في هذه المجموعة.
فتح الحزمة
k this deck
20
If the correlation between and is not zero, then the variability about the estimated regression line will be less than the total variability in .
فتح الحزمة
افتح القفل للوصول البطاقات البالغ عددها 28 في هذه المجموعة.
فتح الحزمة
k this deck
21
The value can assume any value between __________.
فتح الحزمة
افتح القفل للوصول البطاقات البالغ عددها 28 في هذه المجموعة.
فتح الحزمة
k this deck
22
The sample coefficient is an estimate of __________.
فتح الحزمة
افتح القفل للوصول البطاقات البالغ عددها 28 في هذه المجموعة.
فتح الحزمة
k this deck
23
If the multiple correlation coefficient is 0.80 , then the proportion of total variation in that can be attributed to the 's is __________.
فتح الحزمة
افتح القفل للوصول البطاقات البالغ عددها 28 في هذه المجموعة.
فتح الحزمة
k this deck
24
The least squares equation is considered to be a better predictor of than the least squares equation , if the multiple correlation coefficient is __________ than the absolute value of the correlation coefficient involving and .
فتح الحزمة
افتح القفل للوصول البطاقات البالغ عددها 28 في هذه المجموعة.
فتح الحزمة
k this deck
25
If a regression line is horizontal, then the correlation between the two variables is __________.
فتح الحزمة
افتح القفل للوصول البطاقات البالغ عددها 28 في هذه المجموعة.
فتح الحزمة
k this deck
26
If all data points lie on a regression line having a nonzero slope, then equals __________.
فتح الحزمة
افتح القفل للوصول البطاقات البالغ عددها 28 في هذه المجموعة.
فتح الحزمة
k this deck
27
If all data points lie on the regression line, then the standard error of estimate is __________.
فتح الحزمة
افتح القفل للوصول البطاقات البالغ عددها 28 في هذه المجموعة.
فتح الحزمة
k this deck
28
The proportion of total variation which is unexplained can be denoted in symbols by __________.
فتح الحزمة
افتح القفل للوصول البطاقات البالغ عددها 28 في هذه المجموعة.
فتح الحزمة
k this deck
فتح الحزمة
افتح القفل للوصول البطاقات البالغ عددها 28 في هذه المجموعة.


