Deck 18: Nonparametric Tests
ملء الشاشة (f)
سؤال
سؤال
سؤال
سؤال
سؤال
سؤال
Suppose that the test is to be applied to the following sequence. 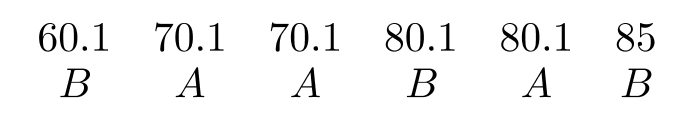 The correct rankings in order are
A) 123456
B) 12.52 .5456
C) 1234.54 .56
D) 12.52 .54 .54 .56
The correct rankings in order areA) 123456
B) 12.52 .5456
C) 1234.54 .56
D) 12.52 .54 .54 .56
سؤال
سؤال
سؤال
سؤال
سؤال
سؤال
سؤال
سؤال
سؤال
سؤال
سؤال
سؤال
Table 18.1
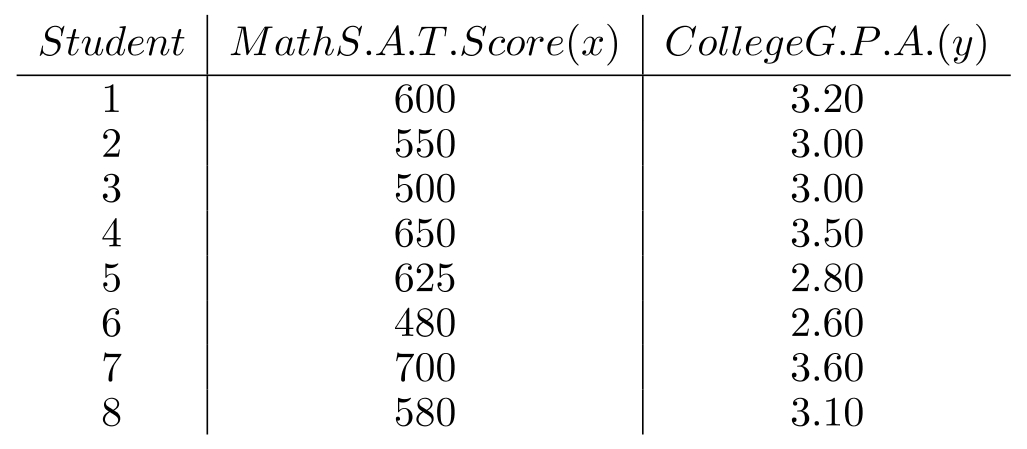
-The mathematics S.A.T. scores and college grade point averages of eight students are given in table 18.1.
a. Calculate the rank-correlation coefficient .
b. Test the null hypothesis of no correlation using . Let .
-The mathematics S.A.T. scores and college grade point averages of eight students are given in table 18.1.
a. Calculate the rank-correlation coefficient .
b. Test the null hypothesis of no correlation using . Let .
سؤال
Table 18.2
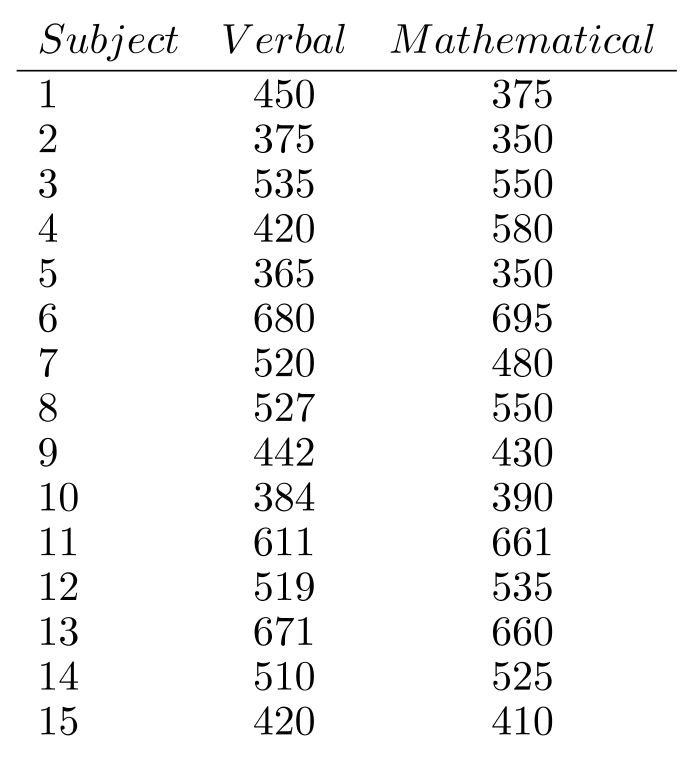
-Table 18.2 shows the scores made on the verbal and mathematical components of an S.A.T. by 15 high -school seniors who plan to go to a certain college. Use the table to calculate the Spearman Rank-Correlation Coefficient for the test scores.
-Table 18.2 shows the scores made on the verbal and mathematical components of an S.A.T. by 15 high -school seniors who plan to go to a certain college. Use the table to calculate the Spearman Rank-Correlation Coefficient for the test scores.
سؤال
Table 18.3
A consumer advocate is interested in testing whether the number of french fries in a portion in a particular cafeteria is different from that of a particular restaurant. The table below shows the results when random samples of 10 portions of french fries are selected and fries counted.
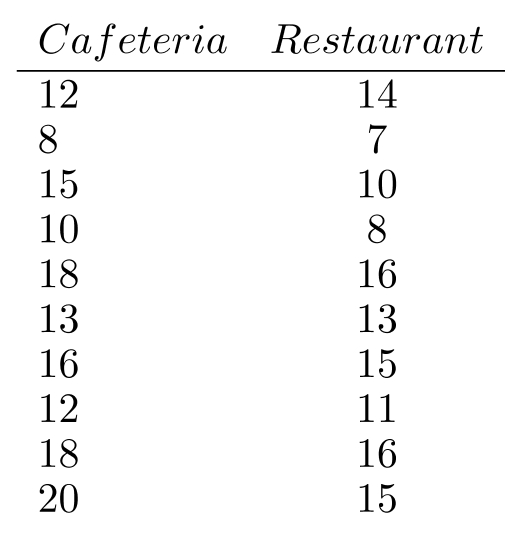
-Use Table 18.3 to conduct the test using .
A consumer advocate is interested in testing whether the number of french fries in a portion in a particular cafeteria is different from that of a particular restaurant. The table below shows the results when random samples of 10 portions of french fries are selected and fries counted.
-Use Table 18.3 to conduct the test using .
سؤال
سؤال
سؤال
سؤال
سؤال
سؤال
سؤال
سؤال
سؤال
سؤال
سؤال
سؤال
سؤال
سؤال
سؤال
سؤال
سؤال
سؤال
سؤال
سؤال
سؤال

فتح الحزمة
قم بالتسجيل لفتح البطاقات في هذه المجموعة!
Unlock Deck
Unlock Deck
1/41
العب
ملء الشاشة (f)
Deck 18: Nonparametric Tests
1
When we are comparing two populations and our two samples are such that each element of one sample relates to a particular element of the other sample, an appropriate nonparametric test would be the
A) one-sample sign test.
B) signed-rank test.
C) Wilcoxian test (rank sums).
D) U test.
A) one-sample sign test.
B) signed-rank test.
C) Wilcoxian test (rank sums).
D) U test.
signed-rank test.
2
The nonparametric alternative to the two-sample test for the difference between two independent means is the
A) one-sample sign test.
B) paired-sample sign test.
C) U test.
D) Kruskal-Wallis test.
A) one-sample sign test.
B) paired-sample sign test.
C) U test.
D) Kruskal-Wallis test.
U test.
3
The nonparametric alternative to the one-way analysis of variance is the
A) U test.
B) paired-sample sign test.
C) Wilcoxian test (rank sums).
D) test.
A) U test.
B) paired-sample sign test.
C) Wilcoxian test (rank sums).
D) test.
test.
4
The Kruskal-Wallis test involves an application of the
A) normal distribution.
B) chi-square distribution.
C) binomial distribution.
D) distribution.
A) normal distribution.
B) chi-square distribution.
C) binomial distribution.
D) distribution.
فتح الحزمة
افتح القفل للوصول البطاقات البالغ عددها 41 في هذه المجموعة.
فتح الحزمة
k this deck
5
The sign test applied to small samples of paired data requires the use of the
A) binomial distribution.
B) normal distribution.
C) distribution.
D) chi-square distribution.
A) binomial distribution.
B) normal distribution.
C) distribution.
D) chi-square distribution.
فتح الحزمة
افتح القفل للوصول البطاقات البالغ عددها 41 في هذه المجموعة.
فتح الحزمة
k this deck
6
Suppose that the test is to be applied to the following sequence. The correct rankings in order are
A) 123456
B) 12.52 .5456
C) 1234.54 .56
D) 12.52 .54 .54 .56
The correct rankings in order areA) 123456
B) 12.52 .5456
C) 1234.54 .56
D) 12.52 .54 .54 .56
فتح الحزمة
افتح القفل للوصول البطاقات البالغ عددها 41 في هذه المجموعة.
فتح الحزمة
k this deck
7
The sign test is used with to test the null hypothesis that the new method and the old method produce equally high scores against the alternative hypothesis that the new method produces higher scores than the old. If we obtain eight plus signs in subtracting (new score - old score), then with , the null hypothesis should
A) be rejected since .
B) not be rejected since .
C) be rejected since .
D) not be rejected since .
A) be rejected since .
B) not be rejected since .
C) be rejected since .
D) not be rejected since .
فتح الحزمة
افتح القفل للوصول البطاقات البالغ عددها 41 في هذه المجموعة.
فتح الحزمة
k this deck
8
The Mann-Whitney test is the same as the
A) one-sample sign test.
B) U test.
C) Kruskal-Wallis test.
D) paired-sample sign test.
A) one-sample sign test.
B) U test.
C) Kruskal-Wallis test.
D) paired-sample sign test.
فتح الحزمة
افتح القفل للوصول البطاقات البالغ عددها 41 في هذه المجموعة.
فتح الحزمة
k this deck
9
Which of the following tests must be two-tailed?
A) U test
B) one-sample sign test
C) number of runs test
D) paired-sample sign test
A) U test
B) one-sample sign test
C) number of runs test
D) paired-sample sign test
فتح الحزمة
افتح القفل للوصول البطاقات البالغ عددها 41 في هذه المجموعة.
فتح الحزمة
k this deck
10
If the test is applied in a test whose alternative hypothesis is with , the null hypothesis can be rejected if
A) and .
B) .
C) .
D) or .
A) and .
B) .
C) .
D) or .
فتح الحزمة
افتح القفل للوصول البطاقات البالغ عددها 41 في هذه المجموعة.
فتح الحزمة
k this deck
11
Independent random samples of eight males and seven female students at a college showed the following weekly food expenses in dollars.
Men:
Female:
Test the null hypothesis that the men and women have the same average food expenses against the alternative hypothesis that they do not have the same average food expenses. Use .
Men:
Female:
Test the null hypothesis that the men and women have the same average food expenses against the alternative hypothesis that they do not have the same average food expenses. Use .
فتح الحزمة
افتح القفل للوصول البطاقات البالغ عددها 41 في هذه المجموعة.
فتح الحزمة
k this deck
12
The following are monthly sales (in thousands of dollars) of two department stores, A and B, for the months January through December 1979:
10 and 9,7 and 4,8 and 5, 7 and 6,11 and 10,15 and 16,
15 and 13,12 and 13,9 and 8,18 and 17,19 and 13,21 and 20.
-For the situation above, use the small sample sign test with to test the null hypothesis that on the average the two department stores have equal sales against the alternative that on the average
a. department store has more sales.
b. there is a difference in sales between the two stores.
فتح الحزمة
افتح القفل للوصول البطاقات البالغ عددها 41 في هذه المجموعة.
فتح الحزمة
k this deck
13
The following are monthly sales (in thousands of dollars) of two department stores, A and B, for the months January through December 1979:
10 and 9,7 and 4,8 and 5, 7 and 6,11 and 10,15 and 16,
15 and 13,12 and 13,9 and 8,18 and 17,19 and 13,21 and 20.
-For the situation above, use the large sample sign test with to test the null hypothesis that on the average the two department stores have equal sales against the alternative that on the average
a. department store has more sales.
b. there is a difference in sales between the two stores.
فتح الحزمة
افتح القفل للوصول البطاقات البالغ عددها 41 في هذه المجموعة.
فتح الحزمة
k this deck
14
Students were observed as they arrived at a college dance. The following is the order in which men and women arrived at the dance:
Test the sequence for randomness at the 0.05 level of significance.
Test the sequence for randomness at the 0.05 level of significance.
فتح الحزمة
افتح القفل للوصول البطاقات البالغ عددها 41 في هذه المجموعة.
فتح الحزمة
k this deck
15
A test was conducted to compare the miles per gallon obtained by three sub-compact automobiles. The following data (in miles per gallon) were obtained from 6 full tanks of the same gasoline.
I.
II.
III.
Use a nonparametric test to evaluate whether or not there are significant differences in gasoline economy among the automobiles. Use .
I.
II.
III.
Use a nonparametric test to evaluate whether or not there are significant differences in gasoline economy among the automobiles. Use .
فتح الحزمة
افتح القفل للوصول البطاقات البالغ عددها 41 في هذه المجموعة.
فتح الحزمة
k this deck
16
Random samples of 15 Model I cars and 13 Model II cars were obtained and the number of miles (in thousands) that each lasted from new until the car was "junked" was recorded.
Model I:
Model II:
Test the null hypothesis that the two models have the same average life expectancy against the alternative hypothesis that they do not have the same average life expectancy. Use .
Model I:
Model II:
Test the null hypothesis that the two models have the same average life expectancy against the alternative hypothesis that they do not have the same average life expectancy. Use .
فتح الحزمة
افتح القفل للوصول البطاقات البالغ عددها 41 في هذه المجموعة.
فتح الحزمة
k this deck
17
An aptitude test is given to trainees on a high-tech form. Here are the grades on the test in the order that the trainees completed the test:
.
Test whether the trainees finished the test in random order with regard to grades. Use .
.
Test whether the trainees finished the test in random order with regard to grades. Use .
فتح الحزمة
افتح القفل للوصول البطاقات البالغ عددها 41 في هذه المجموعة.
فتح الحزمة
k this deck
18
Table 18.1
-The mathematics S.A.T. scores and college grade point averages of eight students are given in table 18.1.
a. Calculate the rank-correlation coefficient .
b. Test the null hypothesis of no correlation using . Let .
-The mathematics S.A.T. scores and college grade point averages of eight students are given in table 18.1.
a. Calculate the rank-correlation coefficient .
b. Test the null hypothesis of no correlation using . Let .
فتح الحزمة
افتح القفل للوصول البطاقات البالغ عددها 41 في هذه المجموعة.
فتح الحزمة
k this deck
19
Table 18.2
-Table 18.2 shows the scores made on the verbal and mathematical components of an S.A.T. by 15 high -school seniors who plan to go to a certain college. Use the table to calculate the Spearman Rank-Correlation Coefficient for the test scores.
-Table 18.2 shows the scores made on the verbal and mathematical components of an S.A.T. by 15 high -school seniors who plan to go to a certain college. Use the table to calculate the Spearman Rank-Correlation Coefficient for the test scores.
فتح الحزمة
افتح القفل للوصول البطاقات البالغ عددها 41 في هذه المجموعة.
فتح الحزمة
k this deck
20
Table 18.3
A consumer advocate is interested in testing whether the number of french fries in a portion in a particular cafeteria is different from that of a particular restaurant. The table below shows the results when random samples of 10 portions of french fries are selected and fries counted.
-Use Table 18.3 to conduct the test using .
فتح الحزمة
افتح القفل للوصول البطاقات البالغ عددها 41 في هذه المجموعة.
فتح الحزمة
k this deck
21
A company that makes foot-long hot dogs requires that the median lengths of its hot dogs be 12 inches. A sample of 18 hot dogs produced by this company in order actually have lengths in inches: 10,11,13,13, 14, 12, . Does this data provide sufficient evidence to indicate a lack of randomness in the pattern of too short and too long hot dogs? Use .
فتح الحزمة
افتح القفل للوصول البطاقات البالغ عددها 41 في هذه المجموعة.
فتح الحزمة
k this deck
22
Suppose we want to test whether or not two samples come from the same population. If the assumptions of the standard test for the difference between two large sample means (given in Chapter 11) are satisfied, and we are to choose either that test or the U test, which one should we choose? Why?
فتح الحزمة
افتح القفل للوصول البطاقات البالغ عددها 41 في هذه المجموعة.
فتح الحزمة
k this deck
23
An advantage of nonparametric tests is that they require less stringent assumptions than parametric tests.
فتح الحزمة
افتح القفل للوصول البطاقات البالغ عددها 41 في هذه المجموعة.
فتح الحزمة
k this deck
24
The use of test requires the assumption that the independent random samples come from identical populations.
فتح الحزمة
افتح القفل للوصول البطاقات البالغ عددها 41 في هذه المجموعة.
فتح الحزمة
k this deck
25
If there were an extremely large or small number of runs in the data, then we would be more likely to believe that the data is random.
فتح الحزمة
افتح القفل للوصول البطاقات البالغ عددها 41 في هذه المجموعة.
فتح الحزمة
k this deck
26
The application of the test requires that the two independent samples have the same sample size.
فتح الحزمة
افتح القفل للوصول البطاقات البالغ عددها 41 في هذه المجموعة.
فتح الحزمة
k this deck
27
The approximation should only be used in the test if each sample has more than five items.
فتح الحزمة
افتح القفل للوصول البطاقات البالغ عددها 41 في هذه المجموعة.
فتح الحزمة
k this deck
28
In the Kruskal-Wallis test, all terms involving ties are eliminated from consideration.
فتح الحزمة
افتح القفل للوصول البطاقات البالغ عددها 41 في هذه المجموعة.
فتح الحزمة
k this deck
29
In the test, the statistic is always the larger of and .
فتح الحزمة
افتح القفل للوصول البطاقات البالغ عددها 41 في هذه المجموعة.
فتح الحزمة
k this deck
30
When evaluating differences among more than two populations, the appropriate nonparametric test is the Kruskal-Wallis test.
فتح الحزمة
افتح القفل للوصول البطاقات البالغ عددها 41 في هذه المجموعة.
فتح الحزمة
k this deck
31
Nonparametric methods are usually less efficient than parametric methods.
فتح الحزمة
افتح القفل للوصول البطاقات البالغ عددها 41 في هذه المجموعة.
فتح الحزمة
k this deck
32
In a one-sample sign test, the null hypothesis can be written as __________ or __________.
فتح الحزمة
افتح القفل للوصول البطاقات البالغ عددها 41 في هذه المجموعة.
فتح الحزمة
k this deck
33
The test is another name for the __________ test.
فتح الحزمة
افتح القفل للوصول البطاقات البالغ عددها 41 في هذه المجموعة.
فتح الحزمة
k this deck
34
The runs test is a test for __________.
فتح الحزمة
افتح القفل للوصول البطاقات البالغ عددها 41 في هذه المجموعة.
فتح الحزمة
k this deck
35
For a ranked sample of size , the sum of the ranks is __________.
فتح الحزمة
افتح القفل للوصول البطاقات البالغ عددها 41 في هذه المجموعة.
فتح الحزمة
k this deck
36
The null hypothesis in the runs test is that the sequence of observations is __________.
فتح الحزمة
افتح القفل للوصول البطاقات البالغ عددها 41 في هذه المجموعة.
فتح الحزمة
k this deck
37
Two examples of rank sum tests are __________ and __________.
فتح الحزمة
افتح القفل للوصول البطاقات البالغ عددها 41 في هذه المجموعة.
فتح الحزمة
k this deck
38
In the test, and take on values between __________ and __________, and their sum always equals __________.
فتح الحزمة
افتح القفل للوصول البطاقات البالغ عددها 41 في هذه المجموعة.
فتح الحزمة
k this deck
39
In a U test, the large sample statistic can be applied if __________ and __________.
فتح الحزمة
افتح القفل للوصول البطاقات البالغ عددها 41 في هذه المجموعة.
فتح الحزمة
k this deck
40
In applying the number of runs test to the sequence , the value of is __________.
فتح الحزمة
افتح القفل للوصول البطاقات البالغ عددها 41 في هذه المجموعة.
فتح الحزمة
k this deck
41
A nonparametric measure of the association between two variables is called the __________.
فتح الحزمة
افتح القفل للوصول البطاقات البالغ عددها 41 في هذه المجموعة.
فتح الحزمة
k this deck
فتح الحزمة
افتح القفل للوصول البطاقات البالغ عددها 41 في هذه المجموعة.


