Deck 6: Inferences With Categorical Data
ملء الشاشة (f)
سؤال
سؤال
سؤال
سؤال
سؤال
سؤال
سؤال
سؤال
سؤال
سؤال
سؤال
Students in a statistics class were asked which of three lifetime achievements they would most like to win: a Nobel Prize, an Academy Award, or an Olympic Gold Medal. They were also asked to indicate their gender. Results are shown in the following table: 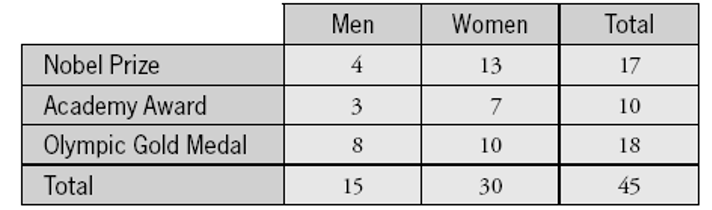 Suppose that you were to conduct a chi-square test on these data.
-State the appropriate null hypothesis in words.
Suppose that you were to conduct a chi-square test on these data.-State the appropriate null hypothesis in words.
سؤال
Students in a statistics class were asked which of three lifetime achievements they would most like to win: a Nobel Prize, an Academy Award, or an Olympic Gold Medal. They were also asked to indicate their gender. Results are shown in the following table: Suppose that you were to conduct a chi-square test on these data.
-Determine the expected count for women who would choose a Nobel Prize.
Suppose that you were to conduct a chi-square test on these data.-Determine the expected count for women who would choose a Nobel Prize.
سؤال
Students in a statistics class were asked which of three lifetime achievements they would most like to win: a Nobel Prize, an Academy Award, or an Olympic Gold Medal. They were also asked to indicate their gender. Results are shown in the following table: Suppose that you were to conduct a chi-square test on these data.
-Report the value that you would you use for degrees of freedom with this test.
Suppose that you were to conduct a chi-square test on these data.-Report the value that you would you use for degrees of freedom with this test.
سؤال
Students in a statistics class were asked which of three lifetime achievements they would most like to win: a Nobel Prize, an Academy Award, or an Olympic Gold Medal. They were also asked to indicate their gender. Results are shown in the following table: Suppose that you were to conduct a chi-square test on these data.
-If the -value turned out to be very small, what conclusion (in context) would you draw?
Suppose that you were to conduct a chi-square test on these data.-If the -value turned out to be very small, what conclusion (in context) would you draw?
سؤال
Students in a statistics class were asked which of three lifetime achievements they would most like to win: a Nobel Prize, an Academy Award, or an Olympic Gold Medal. They were also asked to indicate their gender. Results are shown in the following table: Suppose that you were to conduct a chi-square test on these data.
-Even if this were a random sample from the population of all students at the university, one of the technical conditions of the chi-square test would still not be satisfied with these data. Explain.
Suppose that you were to conduct a chi-square test on these data.-Even if this were a random sample from the population of all students at the university, one of the technical conditions of the chi-square test would still not be satisfied with these data. Explain.
سؤال
The following table displays counts obtained from the 2006 General Social Survey; also presented in parentheses are expected counts: 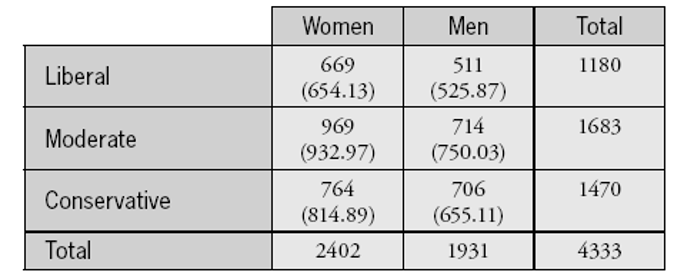
-State the appropriate null and alternative hypotheses for conducting a chi-square test on these data.
-State the appropriate null and alternative hypotheses for conducting a chi-square test on these data.
سؤال
The following table displays counts obtained from the 2006 General Social Survey; also presented in parentheses are expected counts:
-Show how to calculate the expected count for the "conservative, men" cell.
-Show how to calculate the expected count for the "conservative, men" cell.
سؤال
The following table displays counts obtained from the 2006 General Social Survey; also presented in parentheses are expected counts:
-The following values are used in calculating the test statistic. The one missing value is for the "conservative, men" cell. Show how to calculate this value.
-The following values are used in calculating the test statistic. The one missing value is for the "conservative, men" cell. Show how to calculate this value.
سؤال
The following table displays counts obtained from the 2006 General Social Survey; also presented in parentheses are expected counts:
-The -value of this test turns out to equal .004. Summarize the conclusion that you would draw from this test.
-The -value of this test turns out to equal .004. Summarize the conclusion that you would draw from this test.
سؤال
The following table displays counts obtained from the 2006 General Social Survey; also presented in parentheses are expected counts:
-Which cells of the table contribute the most to the calculation of the chi-square statistic? Explain what this reveals about the association between gender and political viewpoint.
-Which cells of the table contribute the most to the calculation of the chi-square statistic? Explain what this reveals about the association between gender and political viewpoint.
سؤال
سؤال
A study of drinking habits of college students produced the following table of counts: 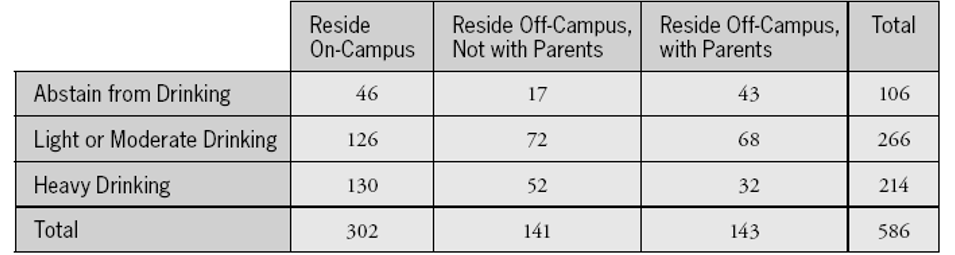
a. Is this an observational or an experimental study? Explain briefly.
b. What proportion of students who live with their parents say that they abstain from drinking alcohol? Consider the following computer output for a chi-square test: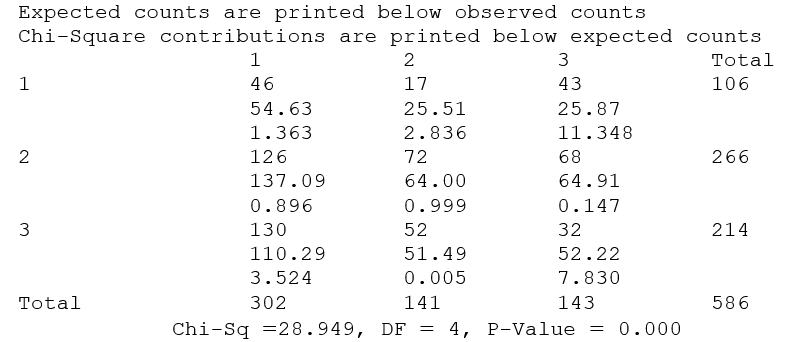 c. Show how to calculate the expected count for the "abstain from drinking/ reside off-campus with parents" cell of the table.
d. What conclusion would you draw from this chi-square test? Explain briefly.
e. Which cell contributes the most to the calculation of the chi-square statistic? What does this reveal about a possible relationship between a college student's location of residence and drinking habits? Explain.
a. Is this an observational or an experimental study? Explain briefly.
b. What proportion of students who live with their parents say that they abstain from drinking alcohol? Consider the following computer output for a chi-square test:
c. Show how to calculate the expected count for the "abstain from drinking/ reside off-campus with parents" cell of the table.d. What conclusion would you draw from this chi-square test? Explain briefly.
e. Which cell contributes the most to the calculation of the chi-square statistic? What does this reveal about a possible relationship between a college student's location of residence and drinking habits? Explain.
سؤال
سؤال
A student recorded the number of calories in samples of vegetarian and nonvegetarian entrees served by a college dining hall. The student wanted to conduct a hypothesis test of whether the sample data provide evidence that the population mean calorie amounts differ between these two groups.
Summary statistics of the data are provided in the following table: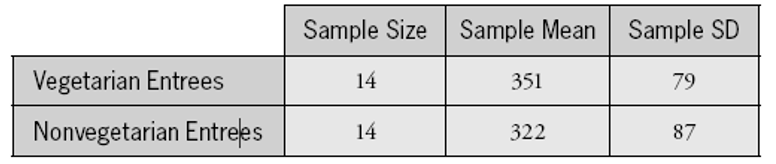 The two-sample -test statistic turns out to equal 0.92 .
a. State the appropriate null and alternative hypotheses in symbols.
b. Do you have enough information to check the technical conditions for a two-sample -test? Explain.
c. Determine the -value as accurately as possible. (Explain what table you use and how you use it.)
d. Summarize your conclusion in a sentence or two, as if you were the statistical consultant reporting back to the student who conducted the study.
e. Describe how the -value would change (smaller, larger, or no change) if all else were the same except the following. (No explanations are needed.)
The sample standard deviations were larger.
The sample sizes were larger.
The sample means were further apart.
Summary statistics of the data are provided in the following table:
The two-sample -test statistic turns out to equal 0.92 .a. State the appropriate null and alternative hypotheses in symbols.
b. Do you have enough information to check the technical conditions for a two-sample -test? Explain.
c. Determine the -value as accurately as possible. (Explain what table you use and how you use it.)
d. Summarize your conclusion in a sentence or two, as if you were the statistical consultant reporting back to the student who conducted the study.
e. Describe how the -value would change (smaller, larger, or no change) if all else were the same except the following. (No explanations are needed.)
The sample standard deviations were larger.
The sample sizes were larger.
The sample means were further apart.
سؤال
سؤال
سؤال
سؤال
Researchers studied whether hormone levels tend to differ following days of strenuous activity as opposed to days of no strenuous activity. For each of six subjects, one blood sample was taken after a day in which the person engaged in strenuous exercise, and one blood sample was taken after a day that included no strenuous activity. The data on growth hormone levels (in ) follow, along with some summary statistics: 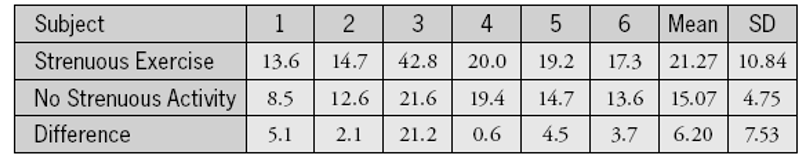
a. Is a paired -test or an independent-samples -test appropriate here? Explain briefly.
b. State the appropriate hypotheses, in words as well as in symbols.
c. Calculate the test statistic, and determine the -value as accurately as possible.
d. Using the significance level, summarize the conclusion you would draw about this study. (Be sure to relate your conclusion to the context.)
e. If the sample size were larger, and all else remained the same, would these results produce stronger, weaker, or the same level of evidence that hormone levels differ after strenuous activity? (No explanation is needed.)
سؤال
سؤال
Suppose 5000 students are randomly assigned to either take an SAT coaching course or not, with the following results in their improvements in SAT scores: 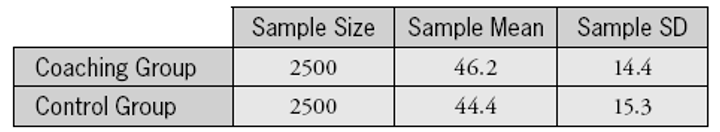
A confidence interval for the difference in population means turns out to be .
a. Based on this interval, would you reject the null hypothesis that the population means are equal at the .01 significance level? (No explanation is needed.)
b. Which is the more appropriate conclusion to draw: (i) that the data provide very strong evidence that the population means differ, or (ii) that the data provide evidence that the population means differ substantially? (No explanation is needed.)
سؤال
سؤال

فتح الحزمة
قم بالتسجيل لفتح البطاقات في هذه المجموعة!
Unlock Deck
Unlock Deck
1/32
العب
ملء الشاشة (f)
Deck 6: Inferences With Categorical Data
1
Students in a statistics class were asked which of three lifetime achievements they would most like to win: a Nobel Prize, an Academy Award, or an Olympic Gold Medal. Results were that 17 students chose the Nobel Prize, 10 chose the Academy Award, and 18 chose the Olympic Gold Medal. Consider these students as a random sample of students at their university. Conduct a chi-square goodness-of-fit test of whether these sample data provide evidence to believe that the three choices are not equally likely in the population. Be sure to report and show the details of your calculations for
-Null and alternative hypotheses
-Null and alternative hypotheses
: The population proportions are the same for each award.
In symbols, .
: At least one population proportion is not equal to .
In symbols, .
: At least one population proportion is not equal to .
2
Students in a statistics class were asked which of three lifetime achievements they would most like to win: a Nobel Prize, an Academy Award, or an Olympic Gold Medal. Results were that 17 students chose the Nobel Prize, 10 chose the Academy Award, and 18 chose the Olympic Gold Medal. Consider these students as a random sample of students at their university. Conduct a chi-square goodness-of-fit test of whether these sample data provide evidence to believe that the three choices are not equally likely in the population. Be sure to report and show the details of your calculations for
-Expected counts and test statistic
-Expected counts and test statistic
Here are the expected counts: 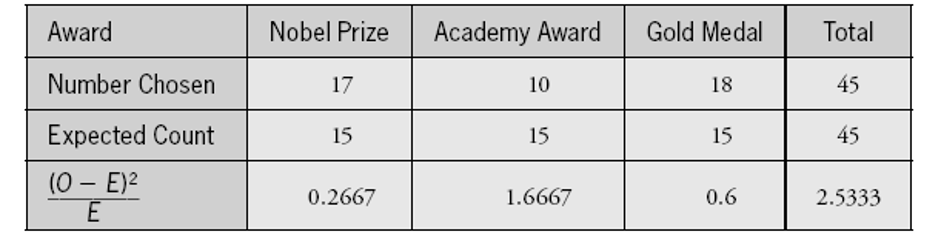
The test statistic is .
The test statistic is .
3
Students in a statistics class were asked which of three lifetime achievements they would most like to win: a Nobel Prize, an Academy Award, or an Olympic Gold Medal. Results were that 17 students chose the Nobel Prize, 10 chose the Academy Award, and 18 chose the Olympic Gold Medal. Consider these students as a random sample of students at their university. Conduct a chi-square goodness-of-fit test of whether these sample data provide evidence to believe that the three choices are not equally likely in the population. Be sure to report and show the details of your calculations for
-Check of technical conditions
-Check of technical conditions
Technical conditions: The expected counts are at least five for each category, and you are considering these students a random sample from the population (this university), so the technical conditions are satisfied.
4
Students in a statistics class were asked which of three lifetime achievements they would most like to win: a Nobel Prize, an Academy Award, or an Olympic Gold Medal. Results were that 17 students chose the Nobel Prize, 10 chose the Academy Award, and 18 chose the Olympic Gold Medal. Consider these students as a random sample of students at their university. Conduct a chi-square goodness-of-fit test of whether these sample data provide evidence to believe that the three choices are not equally likely in the population. Be sure to report and show the details of your calculations for
- -value
- -value
فتح الحزمة
افتح القفل للوصول البطاقات البالغ عددها 32 في هذه المجموعة.
فتح الحزمة
k this deck
5
Students in a statistics class were asked which of three lifetime achievements they would most like to win: a Nobel Prize, an Academy Award, or an Olympic Gold Medal. Results were that 17 students chose the Nobel Prize, 10 chose the Academy Award, and 18 chose the Olympic Gold Medal. Consider these students as a random sample of students at their university. Conduct a chi-square goodness-of-fit test of whether these sample data provide evidence to believe that the three choices are not equally likely in the population. Be sure to report and show the details of your calculations for
-Conclusion in context
-Conclusion in context
فتح الحزمة
افتح القفل للوصول البطاقات البالغ عددها 32 في هذه المجموعة.
فتح الحزمة
k this deck
6
Hershey offers a sampler bag that contains four different kinds of candy bars. You want to test whether the random process that fills the bag with the different candies makes them each equally likely.
-Would your test use the normal distribution, -distribution, or chi-square distribution?
-Would your test use the normal distribution, -distribution, or chi-square distribution?
فتح الحزمة
افتح القفل للوصول البطاقات البالغ عددها 32 في هذه المجموعة.
فتح الحزمة
k this deck
7
Hershey offers a sampler bag that contains four different kinds of candy bars. You want to test whether the random process that fills the bag with the different candies makes them each equally likely.
-Would you need more information to determine the degrees of freedom? If so, specify what information. If not, specify the appropriate value for the degrees of freedom.
Suppose you take a random sample of candies and find 20% Dark Chocolate, 20% Regular Chocolate, Krackel, and . Goodbar.
-Would you need more information to determine the degrees of freedom? If so, specify what information. If not, specify the appropriate value for the degrees of freedom.
Suppose you take a random sample of candies and find 20% Dark Chocolate, 20% Regular Chocolate, Krackel, and . Goodbar.
فتح الحزمة
افتح القفل للوصول البطاقات البالغ عددها 32 في هذه المجموعة.
فتح الحزمة
k this deck
8
Hershey offers a sampler bag that contains four different kinds of candy bars. You want to test whether the random process that fills the bag with the different candies makes them each equally likely.
-Would you need more information to calculate the test statistic? If so, specify what information. If not, calculate the test statistic.
-Would you need more information to calculate the test statistic? If so, specify what information. If not, calculate the test statistic.
فتح الحزمة
افتح القفل للوصول البطاقات البالغ عددها 32 في هذه المجموعة.
فتح الحزمة
k this deck
9
Hershey offers a sampler bag that contains four different kinds of candy bars. You want to test whether the random process that fills the bag with the different candies makes them each equally likely.
-If the test statistic turns out to be 12.7 , what can you say about the -value?
-If the test statistic turns out to be 12.7 , what can you say about the -value?
فتح الحزمة
افتح القفل للوصول البطاقات البالغ عددها 32 في هذه المجموعة.
فتح الحزمة
k this deck
10
Hershey offers a sampler bag that contains four different kinds of candy bars. You want to test whether the random process that fills the bag with the different candies makes them each equally likely.
-If the -value turns out to be .004 , would you conclude that the four candies are equally likely or that they are not? Explain briefly.
-If the -value turns out to be .004 , would you conclude that the four candies are equally likely or that they are not? Explain briefly.
فتح الحزمة
افتح القفل للوصول البطاقات البالغ عددها 32 في هذه المجموعة.
فتح الحزمة
k this deck
11
Students in a statistics class were asked which of three lifetime achievements they would most like to win: a Nobel Prize, an Academy Award, or an Olympic Gold Medal. They were also asked to indicate their gender. Results are shown in the following table: Suppose that you were to conduct a chi-square test on these data.
-State the appropriate null hypothesis in words.
Suppose that you were to conduct a chi-square test on these data.-State the appropriate null hypothesis in words.
فتح الحزمة
افتح القفل للوصول البطاقات البالغ عددها 32 في هذه المجموعة.
فتح الحزمة
k this deck
12
Students in a statistics class were asked which of three lifetime achievements they would most like to win: a Nobel Prize, an Academy Award, or an Olympic Gold Medal. They were also asked to indicate their gender. Results are shown in the following table: Suppose that you were to conduct a chi-square test on these data.
-Determine the expected count for women who would choose a Nobel Prize.
Suppose that you were to conduct a chi-square test on these data.-Determine the expected count for women who would choose a Nobel Prize.
فتح الحزمة
افتح القفل للوصول البطاقات البالغ عددها 32 في هذه المجموعة.
فتح الحزمة
k this deck
13
Students in a statistics class were asked which of three lifetime achievements they would most like to win: a Nobel Prize, an Academy Award, or an Olympic Gold Medal. They were also asked to indicate their gender. Results are shown in the following table: Suppose that you were to conduct a chi-square test on these data.
-Report the value that you would you use for degrees of freedom with this test.
Suppose that you were to conduct a chi-square test on these data.-Report the value that you would you use for degrees of freedom with this test.
فتح الحزمة
افتح القفل للوصول البطاقات البالغ عددها 32 في هذه المجموعة.
فتح الحزمة
k this deck
14
Students in a statistics class were asked which of three lifetime achievements they would most like to win: a Nobel Prize, an Academy Award, or an Olympic Gold Medal. They were also asked to indicate their gender. Results are shown in the following table: Suppose that you were to conduct a chi-square test on these data.
-If the -value turned out to be very small, what conclusion (in context) would you draw?
Suppose that you were to conduct a chi-square test on these data.-If the -value turned out to be very small, what conclusion (in context) would you draw?
فتح الحزمة
افتح القفل للوصول البطاقات البالغ عددها 32 في هذه المجموعة.
فتح الحزمة
k this deck
15
Students in a statistics class were asked which of three lifetime achievements they would most like to win: a Nobel Prize, an Academy Award, or an Olympic Gold Medal. They were also asked to indicate their gender. Results are shown in the following table: Suppose that you were to conduct a chi-square test on these data.
-Even if this were a random sample from the population of all students at the university, one of the technical conditions of the chi-square test would still not be satisfied with these data. Explain.
Suppose that you were to conduct a chi-square test on these data.-Even if this were a random sample from the population of all students at the university, one of the technical conditions of the chi-square test would still not be satisfied with these data. Explain.
فتح الحزمة
افتح القفل للوصول البطاقات البالغ عددها 32 في هذه المجموعة.
فتح الحزمة
k this deck
16
The following table displays counts obtained from the 2006 General Social Survey; also presented in parentheses are expected counts:
-State the appropriate null and alternative hypotheses for conducting a chi-square test on these data.
-State the appropriate null and alternative hypotheses for conducting a chi-square test on these data.
فتح الحزمة
افتح القفل للوصول البطاقات البالغ عددها 32 في هذه المجموعة.
فتح الحزمة
k this deck
17
The following table displays counts obtained from the 2006 General Social Survey; also presented in parentheses are expected counts:
-Show how to calculate the expected count for the "conservative, men" cell.
-Show how to calculate the expected count for the "conservative, men" cell.
فتح الحزمة
افتح القفل للوصول البطاقات البالغ عددها 32 في هذه المجموعة.
فتح الحزمة
k this deck
18
The following table displays counts obtained from the 2006 General Social Survey; also presented in parentheses are expected counts:
-The following values are used in calculating the test statistic. The one missing value is for the "conservative, men" cell. Show how to calculate this value.
-The following values are used in calculating the test statistic. The one missing value is for the "conservative, men" cell. Show how to calculate this value.
فتح الحزمة
افتح القفل للوصول البطاقات البالغ عددها 32 في هذه المجموعة.
فتح الحزمة
k this deck
19
The following table displays counts obtained from the 2006 General Social Survey; also presented in parentheses are expected counts:
-The -value of this test turns out to equal .004. Summarize the conclusion that you would draw from this test.
-The -value of this test turns out to equal .004. Summarize the conclusion that you would draw from this test.
فتح الحزمة
افتح القفل للوصول البطاقات البالغ عددها 32 في هذه المجموعة.
فتح الحزمة
k this deck
20
The following table displays counts obtained from the 2006 General Social Survey; also presented in parentheses are expected counts:
-Which cells of the table contribute the most to the calculation of the chi-square statistic? Explain what this reveals about the association between gender and political viewpoint.
-Which cells of the table contribute the most to the calculation of the chi-square statistic? Explain what this reveals about the association between gender and political viewpoint.
فتح الحزمة
افتح القفل للوصول البطاقات البالغ عددها 32 في هذه المجموعة.
فتح الحزمة
k this deck
21
For each of the following situations, indicate whether an independent-samples analysis or a matchedpairs analysis would be appropriate. (Do not bother to explain.)
a. You want to investigate whether cows milked by a mechanical device tend to produce more or less milk than cows milked by hand. You have 20 cows to work with, so you randomly assign half of them to be milked by machine and half by hand.
b. You want to investigate whether there is a difference in the average age or cars driven by students and faculty at your university, so you randomly select 30 students and 10 faculty members and ask them to report the age of the cars that they drive.
c. You want to investigate whether college freshmen tend to gain 15 pounds of weight, as the "freshman fifteen" legend suggests. You recruit 40 freshmen to participate in your study. You weigh them at the beginning of the fall term and again at the end of the fall term.
فتح الحزمة
افتح القفل للوصول البطاقات البالغ عددها 32 في هذه المجموعة.
فتح الحزمة
k this deck
22
A study of drinking habits of college students produced the following table of counts:
a. Is this an observational or an experimental study? Explain briefly.
b. What proportion of students who live with their parents say that they abstain from drinking alcohol? Consider the following computer output for a chi-square test: c. Show how to calculate the expected count for the "abstain from drinking/ reside off-campus with parents" cell of the table.
d. What conclusion would you draw from this chi-square test? Explain briefly.
e. Which cell contributes the most to the calculation of the chi-square statistic? What does this reveal about a possible relationship between a college student's location of residence and drinking habits? Explain.
a. Is this an observational or an experimental study? Explain briefly.
b. What proportion of students who live with their parents say that they abstain from drinking alcohol? Consider the following computer output for a chi-square test:
c. Show how to calculate the expected count for the "abstain from drinking/ reside off-campus with parents" cell of the table.d. What conclusion would you draw from this chi-square test? Explain briefly.
e. Which cell contributes the most to the calculation of the chi-square statistic? What does this reveal about a possible relationship between a college student's location of residence and drinking habits? Explain.
فتح الحزمة
افتح القفل للوصول البطاقات البالغ عددها 32 في هذه المجموعة.
فتح الحزمة
k this deck
23
Suppose a large-scale randomized experiment were conducted to compare two weight loss plans. At the end of the experiment, the weight loss for each subject (in pounds) was recorded. The -value turned out to be .004 , and a confidence interval for the difference in means turned out to be .
a. Do the data provide strong evidence that the mean weight loss differs between the two plans? Explain briefly.
b. Do the data provide strong evidence that the mean weight loss differs considerably (i.e., a lot) between the two plans? Explain briefly.
c. Describe briefly what a Type I error would mean in this context.
d. Describe briefly what a Type II error would mean in this context.
فتح الحزمة
افتح القفل للوصول البطاقات البالغ عددها 32 في هذه المجموعة.
فتح الحزمة
k this deck
24
A student recorded the number of calories in samples of vegetarian and nonvegetarian entrees served by a college dining hall. The student wanted to conduct a hypothesis test of whether the sample data provide evidence that the population mean calorie amounts differ between these two groups.
Summary statistics of the data are provided in the following table: The two-sample -test statistic turns out to equal 0.92 .
a. State the appropriate null and alternative hypotheses in symbols.
b. Do you have enough information to check the technical conditions for a two-sample -test? Explain.
c. Determine the -value as accurately as possible. (Explain what table you use and how you use it.)
d. Summarize your conclusion in a sentence or two, as if you were the statistical consultant reporting back to the student who conducted the study.
e. Describe how the -value would change (smaller, larger, or no change) if all else were the same except the following. (No explanations are needed.)
The sample standard deviations were larger.
The sample sizes were larger.
The sample means were further apart.
Summary statistics of the data are provided in the following table:
The two-sample -test statistic turns out to equal 0.92 .a. State the appropriate null and alternative hypotheses in symbols.
b. Do you have enough information to check the technical conditions for a two-sample -test? Explain.
c. Determine the -value as accurately as possible. (Explain what table you use and how you use it.)
d. Summarize your conclusion in a sentence or two, as if you were the statistical consultant reporting back to the student who conducted the study.
e. Describe how the -value would change (smaller, larger, or no change) if all else were the same except the following. (No explanations are needed.)
The sample standard deviations were larger.
The sample sizes were larger.
The sample means were further apart.
فتح الحزمة
افتح القفل للوصول البطاقات البالغ عددها 32 في هذه المجموعة.
فتح الحزمة
k this deck
25
A recent headline announced that mountain biking may reduce fertility in men. The article was based on a study that found that of the avid mountain bikers in the study had low sperm counts, and of the non-bikers in the study had low sperm counts.
a. What further information would you need in order to do the calculations for the appropriate hypothesis test?
b. What further information would you need in order to determine whether the technical conditions of this hypothesis test are satisfied?
c. If the technical conditions are satisfied, and if the -value turns out to be very small, would you conclude that avid mountain biking causes lower sperm counts? Explain briefly.
فتح الحزمة
افتح القفل للوصول البطاقات البالغ عددها 32 في هذه المجموعة.
فتح الحزمة
k this deck
26
a. What's wrong with expressing a null hypothesis as ?
b. Suppose you take a random sample of 1000 Californians and an independent random sample of 1000 Pennsylvanians and measure the IQ of each person. Suppose that a 99% confidence interval for the difference in population means turns out to be . Are the sample results statistically significant at the level? Explain briefly.
b. Suppose you take a random sample of 1000 Californians and an independent random sample of 1000 Pennsylvanians and measure the IQ of each person. Suppose that a 99% confidence interval for the difference in population means turns out to be . Are the sample results statistically significant at the level? Explain briefly.
فتح الحزمة
افتح القفل للوصول البطاقات البالغ عددها 32 في هذه المجموعة.
فتح الحزمة
k this deck
27
We have been told that of all Reese's Pieces are orange, whereas are brown and are yellow. To investigate this hypothesis, some students counted the number of candies of each color in a bag of 500 Reese's Pieces. They found 230 orange candies, 138 brown candies, and 132 yellow candies. Perform the appropriate test by stating the hypotheses, calculating the test statistic and -value, and indicating what decision you would make (in context) using the significance level.
فتح الحزمة
افتح القفل للوصول البطاقات البالغ عددها 32 في هذه المجموعة.
فتح الحزمة
k this deck
28
Researchers studied whether hormone levels tend to differ following days of strenuous activity as opposed to days of no strenuous activity. For each of six subjects, one blood sample was taken after a day in which the person engaged in strenuous exercise, and one blood sample was taken after a day that included no strenuous activity. The data on growth hormone levels (in ) follow, along with some summary statistics:
a. Is a paired -test or an independent-samples -test appropriate here? Explain briefly.
b. State the appropriate hypotheses, in words as well as in symbols.
c. Calculate the test statistic, and determine the -value as accurately as possible.
d. Using the significance level, summarize the conclusion you would draw about this study. (Be sure to relate your conclusion to the context.)
e. If the sample size were larger, and all else remained the same, would these results produce stronger, weaker, or the same level of evidence that hormone levels differ after strenuous activity? (No explanation is needed.)
فتح الحزمة
افتح القفل للوصول البطاقات البالغ عددها 32 في هذه المجموعة.
فتح الحزمة
k this deck
29
"Low-carb" diets have become quite popular recently. In a recent study reported in the New England Journal of Medicine, researchers randomly assigned 63 obese men and women to either a low-
carbohydrate diet or a conventional diet. Each subject's weight loss, as a percentage of body weight, was recorded after 3 months, after 6 months, and after 12 months.
a. Is this an observational study or an experiment? Explain briefly.
b. Identify the explanatory variable and the response variable.
c. Some people exercise more than others, and exercise can affect weight loss.
Explain why this exercise level is nevertheless not a confounding variable in this study.
d. The researchers wanted to test the claim that people tend to lose more weight on low-carb diets than on conventional diets. Write the null and alternative hypotheses (in symbols only) for testing this claim.
e. Minitab reports the -values to be .000 for the 3 -month weight losses, .008 for the 6 -month weight losses, and . 125 for the 12-month weight losses. Summarize the conclusions you would draw.
فتح الحزمة
افتح القفل للوصول البطاقات البالغ عددها 32 في هذه المجموعة.
فتح الحزمة
k this deck
30
Suppose 5000 students are randomly assigned to either take an SAT coaching course or not, with the following results in their improvements in SAT scores:
A confidence interval for the difference in population means turns out to be .
a. Based on this interval, would you reject the null hypothesis that the population means are equal at the .01 significance level? (No explanation is needed.)
b. Which is the more appropriate conclusion to draw: (i) that the data provide very strong evidence that the population means differ, or (ii) that the data provide evidence that the population means differ substantially? (No explanation is needed.)
فتح الحزمة
افتح القفل للوصول البطاقات البالغ عددها 32 في هذه المجموعة.
فتح الحزمة
k this deck
31
On June 4-24, 2007, the Gallup Poll asked a random sample of adult Americans about their attitudes toward interracial marriage. Of the 2388 adults interviewed, said they approve of marriage between whites and blacks. In a similar study conducted five years earlier in 2002, 65\% said they approve of such a marriage. (Assume that the sample size in 2002 was the same as in 2007.)
a. Do these studies make use of random sampling or random assignment? (No explanation is necessary.)
b. Determine a confidence interval for the difference in population proportions who approve of such marriages between 2002 and 2007.
c. Comment on what you can discern from this interval about whether, and if so how, this proportion has changed over that five-year period.
فتح الحزمة
افتح القفل للوصول البطاقات البالغ عددها 32 في هذه المجموعة.
فتح الحزمة
k this deck
32
In a study reported in the September 24, 2007, of Archives of Internal Medicine, German researchers described a study conducted on 1162 German adults suffering from chronic low-back pain. These subjects were randomly assigned to one of three groups: real acupuncture, sham acupuncture, or conventional therapy. Researchers found that of subjects in the real acupuncture group improved compared to in the sham acupuncture group and in the conventional therapy group.
a. What kind of test ( , , or chi-square) would be appropriate for testing whether the improvement proportions differ significantly among these three groups? (No explanation is needed.)
b. Report the appropriate degrees of freedom for this test.
c. The -value turns out to be very close to zero. Summarize the conclusion you would draw.
فتح الحزمة
افتح القفل للوصول البطاقات البالغ عددها 32 في هذه المجموعة.
فتح الحزمة
k this deck
فتح الحزمة
افتح القفل للوصول البطاقات البالغ عددها 32 في هذه المجموعة.


