Deck 19: Factorial Analysis of Variance
ملء الشاشة (f)
سؤال
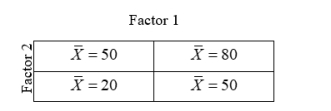
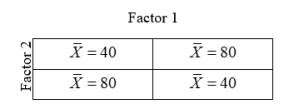
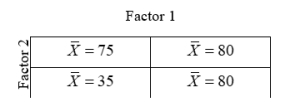
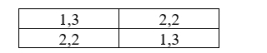
In the tables below, population (not sample) means are given for the cells. In each case, compute the marginal means and indicate whether the table shows (1) a main row effect, (2) a main column effect, (3) an interaction effect. Remember: population values do not show the effects of sampling variation. 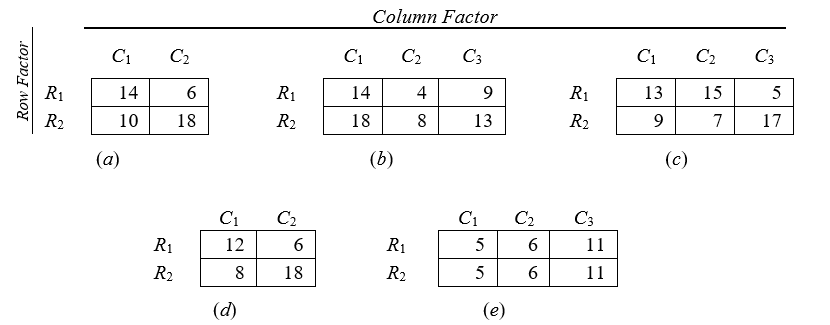
سؤال
سؤال
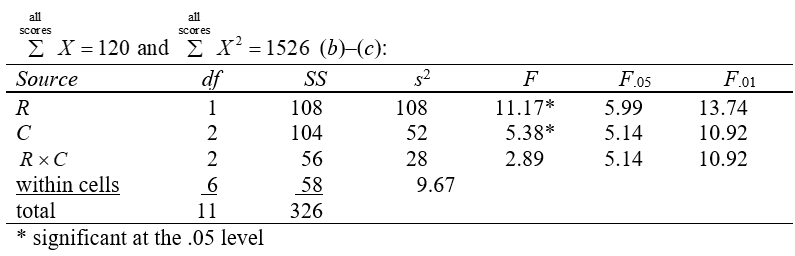
Thirty words are flashed on a screen, one at a time, under various combinations of type style (A, B, and C) and exposure time (60 milliseconds and 120 milliseconds). Two randomly assigned participants are used in each cell (considerably more participants would be required for a practical study). The results, given below, are numbers of words correctly recognized.
(a) Compute and
and  for each cell and display these values in a table.
(b) Proceed to obtain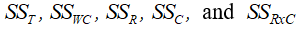
(c) Compute the variance estimates; perform the three F tests at and
and  and draw statistical conclusions. Display your results in a summary analysis of variance table.
(d) Construct a table showing cell and marginal means. Considering the F-test results, which means would be of interest? Why? Draw final conclusions concerning the treatment variables.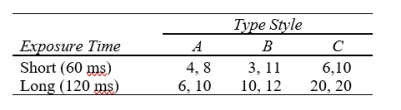
(a) Compute
and for each cell and display these values in a table. (b) Proceed to obtain
(c) Compute the variance estimates; perform the three F tests at
and and draw statistical conclusions. Display your results in a summary analysis of variance table. (d) Construct a table showing cell and marginal means. Considering the F-test results, which means would be of interest? Why? Draw final conclusions concerning the treatment variables.
سؤال
Two approaches, S (structured) and U (unstructured), to teaching a required undergraduate course in social research methods are to be compared with regard to their effects on student interest in social research. Students signing up for the course are classified as Type C (conforming) or Type I (independent) individuals according to personality test results. On a random basis, half of each type of student are assigned to section S of the course and half to section U. At the end of the course, scores are obtained on a scale of interest in social research and are analyzed using a two-factor analysis of variance.
The interest (in social research) scores are given below (normally far more cases would be used).
(a)Compute the variance estimates; complete the F tests at and
and  ; and draw statistical conclusions. Show your results in a summary analysis of variance table
(b)Construct a table showing cell and marginal means. Considering the F-test results, which means would be of interest? Why?
(c)Construct a graph of the cell means. Draw final conclusions concerning the two treatment variables.
The interest (in social research) scores are given below (normally far more cases would be used).
(a)Compute the variance estimates; complete the F tests at
and ; and draw statistical conclusions. Show your results in a summary analysis of variance table (b)Construct a table showing cell and marginal means. Considering the F-test results, which means would be of interest? Why?
(c)Construct a graph of the cell means. Draw final conclusions concerning the two treatment variables.
سؤال
A human factors psychologist investigates which of two simulators (P and Q) results in improved task performance. Eight participants are randomly assigned to one of the two simulators and each participant's performance score is measured across five trials.
The performance scores are given below (normally far more cases would be used in an actual study).
(a) Compute the appropriate variance estimates; complete the F tests at and draw statistical conclusions. Show your results in a summary analysis of variance table
(b) Construct a graph of the cell means. Draw final conclusions.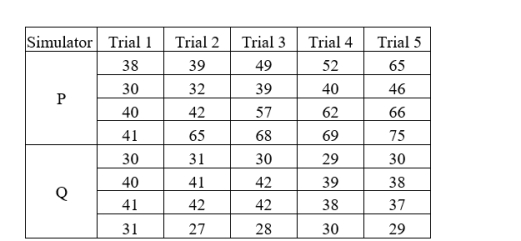
The performance scores are given below (normally far more cases would be used in an actual study).
(a) Compute the appropriate variance estimates; complete the F tests at
and draw statistical conclusions. Show your results in a summary analysis of variance table (b) Construct a graph of the cell means. Draw final conclusions.
سؤال
سؤال
سؤال
سؤال
سؤال
سؤال
Suppose, in a two-way analysis of variance, based on 15 cases per cell, the indicated cell means were observed. We might expect to find that there will be a significant
A) main effect for factor 1
B) main effect for factor 2
C) main effect for factor 1 and factor 2
D) interaction effect
A) main effect for factor 1
B) main effect for factor 2
C) main effect for factor 1 and factor 2
D) interaction effect
سؤال
سؤال
Suppose, in a two-way analysis of variance, based on 15 cases per cell, the indicated cell means were observed. We might expect to find that there will be a significant
A) main effect for factor 1
B) main effect for factor 2
C) interaction effect
D) effect in none of the above situations
A) main effect for factor 1
B) main effect for factor 2
C) interaction effect
D) effect in none of the above situations
سؤال
Suppose, in a two-way analysis of variance, based on 15 cases per cell, the indicated cell means were observed. We might expect to find that
A) there will be a significant main effect for factor 1
B) there will be a significant main effect for factor 2
C) there will be significant degree of interaction
D) all of the above are true
A) there will be a significant main effect for factor 1
B) there will be a significant main effect for factor 2
C) there will be significant degree of interaction
D) all of the above are true
سؤال
سؤال
سؤال
سؤال
سؤال
سؤال
سؤال
In two-factor analysis of variance, the numerator of the F test is
A)
B)
C)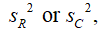 depending on the test to be made
D)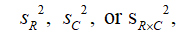 depending on the test to be made
A)
B)
C)
depending on the test to be madeD)
depending on the test to be made سؤال
In two-factor analysis of variance, the denominator of the F-test is
A)
B)
C)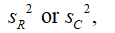 depending on the test to be made
D)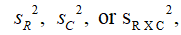 depending on the test to be made
A)
B)
C)
depending on the test to be madeD)
depending on the test to be made سؤال
سؤال
An experiment employing a 2*2
design is performed. The raw scores are shown in the table below. What is the value of SST (raw score formula not necessary)?
A) 2
B) 6
C) 4
D) 8
design is performed. The raw scores are shown in the table below. What is the value of SST (raw score formula not necessary)?
A) 2
B) 6
C) 4
D) 8
سؤال
A two-factor ANOVA gives the following results: 
What is the value of SSWC?
A) 25
B) 20
C) 35
D) 15
What is the value of SSWC?
A) 25
B) 20
C) 35
D) 15
سؤال
A 3*2 factorial ANOVA gives the following results:

What is the value of SSR×C?
A) 12
B) 8
C) 4
D) 6
What is the value of SSR×C?
A) 12
B) 8
C) 4
D) 6
سؤال
In general, the number of degrees of freedom for the within-cells variance estimate is
A)
B)
C)
D) (R - 1)(C - 1)
A)
B)
C)
D) (R - 1)(C - 1)
سؤال
سؤال
A 2*3 ANOVA is performed. The following is a partial list of the df's:
What is the value of

A) 33
B) 35
C) 37
D) 31
What is the value of
A) 33
B) 35
C) 37
D) 31
سؤال

فتح الحزمة
قم بالتسجيل لفتح البطاقات في هذه المجموعة!
Unlock Deck
Unlock Deck
1/30
العب
ملء الشاشة (f)
Deck 19: Factorial Analysis of Variance
1
In the tables below, population (not sample) means are given for the cells. In each case, compute the marginal means and indicate whether the table shows (1) a main row effect, (2) a main column effect, (3) an interaction effect. Remember: population values do not show the effects of sampling variation.
(a) row, interaction (b) row, column (c) interaction (d) row, column, interaction (e) column
2
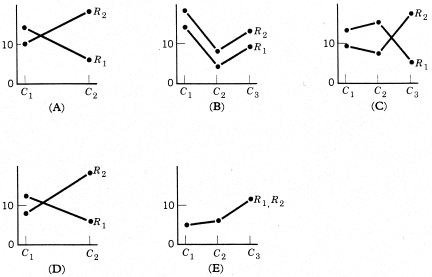
(a) -(e)Draw a graph of the cell means for each of the tables above. Let the horizontal axis represent the column variable. In each case, see if you can arrive at correct conclusions concerning the presence (or absence) of row, column, and interaction effects from the graph alone. Bear in mind that the tables of Problem 1 are highly artificial; they are population values and do not reflect the effects of the sampling variation that would be encountered in practice.
3
Thirty words are flashed on a screen, one at a time, under various combinations of type style (A, B, and C) and exposure time (60 milliseconds and 120 milliseconds). Two randomly assigned participants are used in each cell (considerably more participants would be required for a practical study). The results, given below, are numbers of words correctly recognized.
(a) Compute and for each cell and display these values in a table.
(b) Proceed to obtain
(c) Compute the variance estimates; perform the three F tests at and and draw statistical conclusions. Display your results in a summary analysis of variance table.
(d) Construct a table showing cell and marginal means. Considering the F-test results, which means would be of interest? Why? Draw final conclusions concerning the treatment variables.
(a) Compute
and for each cell and display these values in a table. (b) Proceed to obtain
(c) Compute the variance estimates; perform the three F tests at
and and draw statistical conclusions. Display your results in a summary analysis of variance table. (d) Construct a table showing cell and marginal means. Considering the F-test results, which means would be of interest? Why? Draw final conclusions concerning the treatment variables.
(a) Check cell sums

to see that they add up to 120; similarly, row sums and column sums should total 120;
to see that they add up to 120; similarly, row sums and column sums should total 120;
4
Two approaches, S (structured) and U (unstructured), to teaching a required undergraduate course in social research methods are to be compared with regard to their effects on student interest in social research. Students signing up for the course are classified as Type C (conforming) or Type I (independent) individuals according to personality test results. On a random basis, half of each type of student are assigned to section S of the course and half to section U. At the end of the course, scores are obtained on a scale of interest in social research and are analyzed using a two-factor analysis of variance.
The interest (in social research) scores are given below (normally far more cases would be used).
(a)Compute the variance estimates; complete the F tests at and ; and draw statistical conclusions. Show your results in a summary analysis of variance table
(b)Construct a table showing cell and marginal means. Considering the F-test results, which means would be of interest? Why?
(c)Construct a graph of the cell means. Draw final conclusions concerning the two treatment variables.
The interest (in social research) scores are given below (normally far more cases would be used).
(a)Compute the variance estimates; complete the F tests at
and ; and draw statistical conclusions. Show your results in a summary analysis of variance table (b)Construct a table showing cell and marginal means. Considering the F-test results, which means would be of interest? Why?
(c)Construct a graph of the cell means. Draw final conclusions concerning the two treatment variables.
فتح الحزمة
افتح القفل للوصول البطاقات البالغ عددها 30 في هذه المجموعة.
فتح الحزمة
k this deck
5
A human factors psychologist investigates which of two simulators (P and Q) results in improved task performance. Eight participants are randomly assigned to one of the two simulators and each participant's performance score is measured across five trials.
The performance scores are given below (normally far more cases would be used in an actual study).
(a) Compute the appropriate variance estimates; complete the F tests at and draw statistical conclusions. Show your results in a summary analysis of variance table
(b) Construct a graph of the cell means. Draw final conclusions.
The performance scores are given below (normally far more cases would be used in an actual study).
(a) Compute the appropriate variance estimates; complete the F tests at
and draw statistical conclusions. Show your results in a summary analysis of variance table (b) Construct a graph of the cell means. Draw final conclusions.
فتح الحزمة
افتح القفل للوصول البطاقات البالغ عددها 30 في هذه المجموعة.
فتح الحزمة
k this deck
6
Which is not an advantage of two-factor analysis of variance?
A) The number of cases required to answer the questions is less than if the questions had been asked in separate experiments.
B) Interaction between two Factors may be more easily studied.
C) Better experimental control of extraneous variables can be achieved than in a simple experiment.
D) Conclusions regarding the effect of a particular factor apply with wider generality than they would in a simple experiment.
فتح الحزمة
افتح القفل للوصول البطاقات البالغ عددها 30 في هذه المجموعة.
فتح الحزمة
k this deck
7
In terms of the two-way table layout for two-factor ANOVA, main effects are concerned solely with
A) marginal means
B) cell means
C) grand means
D) differences between marginal and cell means.
A) marginal means
B) cell means
C) grand means
D) differences between marginal and cell means.
فتح الحزمة
افتح القفل للوصول البطاقات البالغ عددها 30 في هذه المجموعة.
فتح الحزمة
k this deck
8
A main effect is most precisely described as a(n)
A) primary effect
B) average effect
C) major effect
D) total effect
A) primary effect
B) average effect
C) major effect
D) total effect
فتح الحزمة
افتح القفل للوصول البطاقات البالغ عددها 30 في هذه المجموعة.
فتح الحزمة
k this deck
9
We are studying the effect of two methods of learning, using bright students and dull students, in a two-way analysis of variance. Interaction between method and level of intelligence would be suggested if we found that
A) method A was better for brights, but not for dulls
B) method A was better for brights and better for dulls
C) there is no difference between method A and method B, but there is a difference between brights and dulls
D) there is no difference between methods, and there is no difference between brights and dulls
فتح الحزمة
افتح القفل للوصول البطاقات البالغ عددها 30 في هذه المجموعة.
فتح الحزمة
k this deck
10
In terms of the two-way table layout for two-factor ANOVA, interaction is concerned solely with
A) marginal means
B) cell means
C) grand means
D) differences between marginal means and grand means
A) marginal means
B) cell means
C) grand means
D) differences between marginal means and grand means
فتح الحزمة
افتح القفل للوصول البطاقات البالغ عددها 30 في هذه المجموعة.
فتح الحزمة
k this deck
11
Suppose, in a two-way analysis of variance, based on 15 cases per cell, the indicated cell means were observed. We might expect to find that there will be a significant
A) main effect for factor 1
B) main effect for factor 2
C) main effect for factor 1 and factor 2
D) interaction effect
A) main effect for factor 1
B) main effect for factor 2
C) main effect for factor 1 and factor 2
D) interaction effect
فتح الحزمة
افتح القفل للوصول البطاقات البالغ عددها 30 في هذه المجموعة.
فتح الحزمة
k this deck
12
In a study investigating the effects of three different diets (Diet) on physical abilities, twelve participants were divided evenly into three groups. Each group was assigned a particular diet and each participant was measured on a physical ability test on seven consecutive days (Trials). What are the appropriate denominator degrees of freedom for the F-test on the Diet × Trials interaction?
A) 2
B) 6
C) 12
D) 54
A) 2
B) 6
C) 12
D) 54
فتح الحزمة
افتح القفل للوصول البطاقات البالغ عددها 30 في هذه المجموعة.
فتح الحزمة
k this deck
13
Suppose, in a two-way analysis of variance, based on 15 cases per cell, the indicated cell means were observed. We might expect to find that there will be a significant
A) main effect for factor 1
B) main effect for factor 2
C) interaction effect
D) effect in none of the above situations
A) main effect for factor 1
B) main effect for factor 2
C) interaction effect
D) effect in none of the above situations
فتح الحزمة
افتح القفل للوصول البطاقات البالغ عددها 30 في هذه المجموعة.
فتح الحزمة
k this deck
14
Suppose, in a two-way analysis of variance, based on 15 cases per cell, the indicated cell means were observed. We might expect to find that
A) there will be a significant main effect for factor 1
B) there will be a significant main effect for factor 2
C) there will be significant degree of interaction
D) all of the above are true
A) there will be a significant main effect for factor 1
B) there will be a significant main effect for factor 2
C) there will be significant degree of interaction
D) all of the above are true
فتح الحزمة
افتح القفل للوصول البطاقات البالغ عددها 30 في هذه المجموعة.
فتح الحزمة
k this deck
15
Using an equal number of cases per group is recommended practice
A) for one-way analysis of variance
B) when it is desirable to avoid Type I errors
C) when it is desirable to avoid an interaction effect
D) for two-factor analysis of variance
A) for one-way analysis of variance
B) when it is desirable to avoid Type I errors
C) when it is desirable to avoid an interaction effect
D) for two-factor analysis of variance
فتح الحزمة
افتح القفل للوصول البطاقات البالغ عددها 30 في هذه المجموعة.
فتح الحزمة
k this deck
16
A significant interaction becomes a matter of concern
A) when at least one main effect is significant
B) when both main effects are significant
C) when neither main effect is significant
D) under any of the above conditions
A) when at least one main effect is significant
B) when both main effects are significant
C) when neither main effect is significant
D) under any of the above conditions
فتح الحزمة
افتح القفل للوصول البطاقات البالغ عددها 30 في هذه المجموعة.
فتح الحزمة
k this deck
17
Both main effects in a two-factor ANOVA turn out to be nonsignificant. Does this mean that the sample results showed no effects of the two factors beyond those expected by chance?
A) yes
B) no, if interaction is significant
C) no, if interaction is also insignificant
D) yes, if interaction is significant
A) yes
B) no, if interaction is significant
C) no, if interaction is also insignificant
D) yes, if interaction is significant
فتح الحزمة
افتح القفل للوصول البطاقات البالغ عددها 30 في هذه المجموعة.
فتح الحزمة
k this deck
18
The finding of a significant main effect in two-way analysis of variance may not be open to straight-forward interpretation when
A) there is a significant interaction effect
B) one main effect is significant but the other is not
C) both main effects are significant
D) sample size is small
A) there is a significant interaction effect
B) one main effect is significant but the other is not
C) both main effects are significant
D) sample size is small
فتح الحزمة
افتح القفل للوصول البطاقات البالغ عددها 30 في هذه المجموعة.
فتح الحزمة
k this deck
19
In studying the outcome of a two-way ANOVA for which one or more F's turn out to be significant, one should always
A) perform Tukey's HSD test
B) examine the various sample means
C) perform a planned comparison test
D) do all of the above
A) perform Tukey's HSD test
B) examine the various sample means
C) perform a planned comparison test
D) do all of the above
فتح الحزمة
افتح القفل للوصول البطاقات البالغ عددها 30 في هذه المجموعة.
فتح الحزمة
k this deck
20
A graph is made of the cell means for a two-factor ANOVA. The lines connecting the means for each row are reasonably parallel. This suggests
A) very little, if any, row effect
B) very little, if any, column effect
C) very little, if any, interaction
D) all F tests probably turned out nonsignificant
A) very little, if any, row effect
B) very little, if any, column effect
C) very little, if any, interaction
D) all F tests probably turned out nonsignificant
فتح الحزمة
افتح القفل للوصول البطاقات البالغ عددها 30 في هذه المجموعة.
فتح الحزمة
k this deck
21
In two-factor analysis of variance, the numerator of the F test is
A)
B)
C) depending on the test to be made
D) depending on the test to be made
A)
B)
C)
depending on the test to be madeD)
depending on the test to be made فتح الحزمة
افتح القفل للوصول البطاقات البالغ عددها 30 في هذه المجموعة.
فتح الحزمة
k this deck
22
In two-factor analysis of variance, the denominator of the F-test is
A)
B)
C) depending on the test to be made
D) depending on the test to be made
A)
B)
C)
depending on the test to be madeD)
depending on the test to be made فتح الحزمة
افتح القفل للوصول البطاقات البالغ عددها 30 في هذه المجموعة.
فتح الحزمة
k this deck
23
In two-factor analysis of variance, ____________ corresponds most closely to the within-groups variance estimate in one-way analysis of variance.
A) SC2
B) SR2
C) S R*C2
D) SWC2
A) SC2
B) SR2
C) S R*C2
D) SWC2
فتح الحزمة
افتح القفل للوصول البطاقات البالغ عددها 30 في هذه المجموعة.
فتح الحزمة
k this deck
24
An experiment employing a 2*2
design is performed. The raw scores are shown in the table below. What is the value of SST (raw score formula not necessary)?
A) 2
B) 6
C) 4
D) 8
design is performed. The raw scores are shown in the table below. What is the value of SST (raw score formula not necessary)?
A) 2
B) 6
C) 4
D) 8
فتح الحزمة
افتح القفل للوصول البطاقات البالغ عددها 30 في هذه المجموعة.
فتح الحزمة
k this deck
25
A two-factor ANOVA gives the following results:
What is the value of SSWC?
A) 25
B) 20
C) 35
D) 15
What is the value of SSWC?
A) 25
B) 20
C) 35
D) 15
فتح الحزمة
افتح القفل للوصول البطاقات البالغ عددها 30 في هذه المجموعة.
فتح الحزمة
k this deck
26
A 3*2 factorial ANOVA gives the following results:
What is the value of SSR×C?
A) 12
B) 8
C) 4
D) 6
What is the value of SSR×C?
A) 12
B) 8
C) 4
D) 6
فتح الحزمة
افتح القفل للوصول البطاقات البالغ عددها 30 في هذه المجموعة.
فتح الحزمة
k this deck
27
In general, the number of degrees of freedom for the within-cells variance estimate is
A)
B)
C)
D) (R - 1)(C - 1)
A)
B)
C)
D) (R - 1)(C - 1)
فتح الحزمة
افتح القفل للوصول البطاقات البالغ عددها 30 في هذه المجموعة.
فتح الحزمة
k this deck
28
In general, the number of degrees of freedom for row by column interaction is given by
A) (R - 1)(C - 1)
B) (R - 1) + (C - 1)
C) (R + C) - 1
D) (R)(C)
A) (R - 1)(C - 1)
B) (R - 1) + (C - 1)
C) (R + C) - 1
D) (R)(C)
فتح الحزمة
افتح القفل للوصول البطاقات البالغ عددها 30 في هذه المجموعة.
فتح الحزمة
k this deck
29
A 2*3 ANOVA is performed. The following is a partial list of the df's:
What is the value of
A) 33
B) 35
C) 37
D) 31
What is the value of
A) 33
B) 35
C) 37
D) 31
فتح الحزمة
افتح القفل للوصول البطاقات البالغ عددها 30 في هذه المجموعة.
فتح الحزمة
k this deck
30
In a study investigating the effects of four different training techniques (Training) on job knowledge, twenty-four employees were divided evenly into four groups. Each group was assigned a particular type of training and each employee was measured on a knowledge test on three successive days (Trials) of training. The F-test on the Training factor is comparable to which of the following?
A) A two-dependent sample t-test.
B) A two-independent sample t-test.
C) A one-way ANOVA with dependent groups.
D) A one-way ANOVA with independent groups.
A) A two-dependent sample t-test.
B) A two-independent sample t-test.
C) A one-way ANOVA with dependent groups.
D) A one-way ANOVA with independent groups.
فتح الحزمة
افتح القفل للوصول البطاقات البالغ عددها 30 في هذه المجموعة.
فتح الحزمة
k this deck
فتح الحزمة
افتح القفل للوصول البطاقات البالغ عددها 30 في هذه المجموعة.


