Deck 11: Regression Analysis I
ملء الشاشة (f)
سؤال
سؤال
سؤال
سؤال
سؤال
سؤال
سؤال
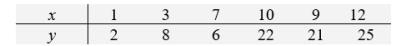
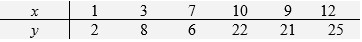
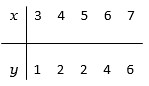
Data on the number of cans of beverage served, y , and the number of students, x, attending a TV watching party were recorded on six occassions
A) Calculate
B) Calculate
C) Calculate Sxx
D) Calculate Syy
E) Calculate Sxy
Calculate the least squares estimate
 G) Calculate the least squares estimate

A) Calculate
B) Calculate
C) Calculate Sxx
D) Calculate Syy
E) Calculate Sxy
Calculate the least squares estimate
G) Calculate the least squares estimate سؤال
Data on the number of cans of beverage served, y , and the number of students, x, attending a TV watching party were recorded on six occassions
 Find the value of
  . Round your answer to three decimal places.
A) .6
B) -1.4
C) .4
D) .7
Find the value of . Round your answer to three decimal places.A) .6
B) -1.4
C) .4
D) .7
سؤال
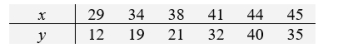
A basketball fan collected data on the number of points per game, y, of her favorite player, associated with the number of minutes, x, played per game
 Given that
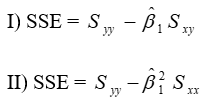
Sxx = 189.50, Sxy 317.50, and Syy 581.50, calculate the residual sum of squares S.S.E.
Given that Sxx = 189.50, Sxy 317.50, and Syy 581.50, calculate the residual sum of squares S.S.E.
سؤال
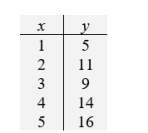
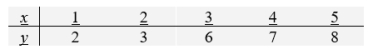
Consider the following data set
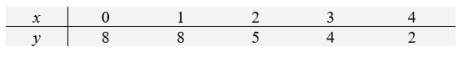
A) Determine the fitted line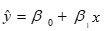
B) Use the fitted line to predict the value of y when x = 3.5.
A) Determine the fitted line
B) Use the fitted line to predict the value of y when x = 3.5.
سؤال
Which of the following statements is (are) true?
III) The point ( , ) lies on the fitted regression line
A) Only I and II
B) Only I and III
C) Only II and III
D) All of them
III) The point ( , ) lies on the fitted regression line
A) Only I and II
B) Only I and III
C) Only II and III
D) All of them
سؤال
Suppose that n = 21, = 38.044, = 89.27, Sxx = 994.045, Sxy = 6191.08, and Syy = 76,293.5.
A) Obtain the equation of the best fitting straight line.
B) Calculate the residual sum of squares.
C) Estimate .

Round your answers to three decimal places.
A) Obtain the equation of the best fitting straight line.
B) Calculate the residual sum of squares.
C) Estimate .
Round your answers to three decimal places.
سؤال
Temperature anomaly means a departure from a reference value, usually obtained by a long-term average. A positive anomaly indicates that the observed temperature was warmer than the reference value. The following table shows the annual anomalies for the highest temperatures in six recent decades..
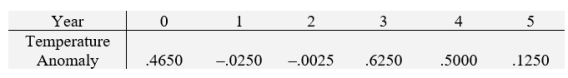
A) Obtain the last squares fit of year to the predictor temperature anomaly.
B) Calculate the residual sum of squares.
C) Estimate .

Round your answers to three decimal places.
A) Obtain the last squares fit of year to the predictor temperature anomaly.
B) Calculate the residual sum of squares.
C) Estimate .
Round your answers to three decimal places.
سؤال
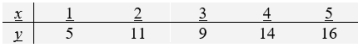
Consider the following data.

A) Calculate the least squares estimate .

B) Calculate the least squares estimate .

C) Estimate the error variance .

D) Test H0: 1 = 0 versus H1: 1 0 with = 0.05. Answer "H0 is rejected at = 0.05" or "H0 is not rejected at = 0.05".
E) Estimate the expected y value corresponding to x = 3.
F) Give a 90% confidence interval for the expected y value at x = 3. Round your answer to two decimal places.
A) Calculate the least squares estimate .
B) Calculate the least squares estimate .
C) Estimate the error variance .
D) Test H0: 1 = 0 versus H1: 1 0 with = 0.05. Answer "H0 is rejected at = 0.05" or "H0 is not rejected at = 0.05".
E) Estimate the expected y value corresponding to x = 3.
F) Give a 90% confidence interval for the expected y value at x = 3. Round your answer to two decimal places.
سؤال
Consider the following data set.
 where Sxx = 10, Sxy = 16, and Syy = 26.8. Construct a 95% confidence interval for 1 . Round your answer to two decimal places.
where Sxx = 10, Sxy = 16, and Syy = 26.8. Construct a 95% confidence interval for 1 . Round your answer to two decimal places. سؤال
Consider the following data set:
where Sxx = 10 , Sxy = 25, and Syy = 74.Construct a 90% confidence interval for the intercept 0. Round your answer to three decimal places.
where Sxx = 10 , Sxy = 25, and Syy = 74.Construct a 90% confidence interval for the intercept 0. Round your answer to three decimal places.
سؤال
The Human Development Index (H.D.I.) provides a composite measure of three dimensions of human development: life expectancy, adult literacy, and income. One county's H.D.I. trend is shown below.
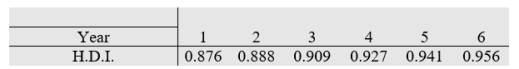
A) Determine the equation of the least squares regression line.
B) Estimate the H.D.I. in year 6.5.
C) Construct a 95% confidence interval for the response in part B. Round your answer to three decimal places.
A) Determine the equation of the least squares regression line.
B) Estimate the H.D.I. in year 6.5.
C) Construct a 95% confidence interval for the response in part B. Round your answer to three decimal places.
سؤال
Data are recorded at one ACM on the total time to wait in line and then complete a transaction y(minutes) and the number of persons, x, already in line.
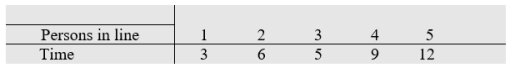
A) Determine the equation of the least squares regression line. Round your answer to three decimal places.
B) Estimate the time to finish your transaction when 6 people are ahead of you. Round your answer to three decimal places.
C) Give a 95% prediction interval for the time to finish your transaction when 6 people are ahead of you in line. Round your answer to two decimal places.
سؤال
سؤال
سؤال
سؤال
سؤال
سؤال
Calculate the correlation coefficient between the number of grocery carts, x, ahead in line and the time, y, to complete checkout. 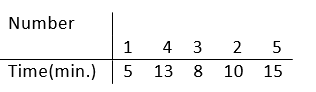
سؤال
Consider the data set 
Calculate the
(a) sample means
(b) Sxx , Sxy , Syy
(c) Calculate the least squares estimates β1 and β0.
(d) Calculate the sample correlation coefficient.
Calculate the
(a) sample means
(b) Sxx , Sxy , Syy
(c) Calculate the least squares estimates β1 and β0.
(d) Calculate the sample correlation coefficient.
سؤال
Consider the data set
Calculate the
(a) sample means.
(b) Sxx , Sxy Syy.
(c) Calculate the least squares estimates 1 and 0.
(d) Estimate the error variance.
(e) Determine the proportion of variation in y explained by x.
Calculate the
(a) sample means.
(b) Sxx , Sxy Syy.
(c) Calculate the least squares estimates 1 and 0.
(d) Estimate the error variance.
(e) Determine the proportion of variation in y explained by x.
سؤال
Consider the data
(a) Calculate the least squares estimates 1 and 0.
(b) Estimate the error variance.
(c) Obtain a 95 % confidence interval for 1. Can you conclude that the slope is different from 0?
(d) Determine the proportion of variation in y explained by x.
(a) Calculate the least squares estimates 1 and 0.
(b) Estimate the error variance.
(c) Obtain a 95 % confidence interval for 1. Can you conclude that the slope is different from 0?
(d) Determine the proportion of variation in y explained by x.
سؤال
Consider the data
 (a) Calculate the least squares estimates 1 and 0.
(b) Estimate the error variance.
(c) Obtain a 95 % confidence interval for 1. Can you conclude that the slope is different from 0?
(d) Find a 95% confidence interval for the mean response when
x = 8.
(a) Calculate the least squares estimates 1 and 0.(b) Estimate the error variance.
(c) Obtain a 95 % confidence interval for 1. Can you conclude that the slope is different from 0?
(d) Find a 95% confidence interval for the mean response when
x = 8.
سؤال
An internet site lists the prices, y, of a used popular midsized model foreign car. The age, x, in years and the price(thousands $) are given in the table for a sample of six cars.
(a) Determine the least squares regression line.
(b) Estimate the price of a used car of this model whose age is 9.
(c) Give a 95% prediction interval for the price of a used car of age 9.
(d) Besides the uncertainty accounted for in the calculation in Part c, what else could lead to a serious mistake in the pre- diction.

فتح الحزمة
قم بالتسجيل لفتح البطاقات في هذه المجموعة!
Unlock Deck
Unlock Deck
1/29
العب
ملء الشاشة (f)
Deck 11: Regression Analysis I
1
The letter x usually represents the independent variable, also called predictor variable
True
2
Consider the line y = -6 + 14x
A) What is its intercept?
B) What is its slope?
A) What is its intercept?
B) What is its slope?
Part A: -6
Part B: 14
Part B: 14
3
The price y (in cents) of a domestic long distance telephone call is given by
y = 2x + 25
where x denotes the number of minutes that the call lasts.
A) What is the price, in dollars, of a 33 minutes call?
B) If the telephone company charged you $3.33 for a domestic long distance call, how long was that call?
y = 2x + 25
where x denotes the number of minutes that the call lasts.
A) What is the price, in dollars, of a 33 minutes call?
B) If the telephone company charged you $3.33 for a domestic long distance call, how long was that call?
Part A: $0.91
Part B: 154 minutes
Part B: 154 minutes
4
Identify the values of the parameters A) β0, B) β , and C) δ in the statistical model
Y = -14 + 15 x + e
where e is a normal random variable with mean 0 and standard deviation 7.
Y = -14 + 15 x + e
where e is a normal random variable with mean 0 and standard deviation 7.
فتح الحزمة
افتح القفل للوصول البطاقات البالغ عددها 29 في هذه المجموعة.
فتح الحزمة
k this deck
5
Under the linear regression model, determine the (A) mean and (B) standard deviation of Y, for x = 12, when β0 = 6, β1 = 5, and δ = 7.
فتح الحزمة
افتح القفل للوصول البطاقات البالغ عددها 29 في هذه المجموعة.
فتح الحزمة
k this deck
6
Consider the following linear regression model
Y = β0 + β1x + e
where β0 = 4, β1 = -2, and the normal random variable e, has the standard deviation 3.
A) What is the mean of the response Y when x = 8?
B) Will the response at x = 9 always be larger than that at x = 8? Answer "Yes" or "No".
Y = β0 + β1x + e
where β0 = 4, β1 = -2, and the normal random variable e, has the standard deviation 3.
A) What is the mean of the response Y when x = 8?
B) Will the response at x = 9 always be larger than that at x = 8? Answer "Yes" or "No".
فتح الحزمة
افتح القفل للوصول البطاقات البالغ عددها 29 في هذه المجموعة.
فتح الحزمة
k this deck
7
Data on the number of cans of beverage served, y , and the number of students, x, attending a TV watching party were recorded on six occassions
A) Calculate
B) Calculate
C) Calculate Sxx
D) Calculate Syy
E) Calculate Sxy
Calculate the least squares estimate
G) Calculate the least squares estimate
A) Calculate
B) Calculate
C) Calculate Sxx
D) Calculate Syy
E) Calculate Sxy
Calculate the least squares estimate
G) Calculate the least squares estimate فتح الحزمة
افتح القفل للوصول البطاقات البالغ عددها 29 في هذه المجموعة.
فتح الحزمة
k this deck
8
Data on the number of cans of beverage served, y , and the number of students, x, attending a TV watching party were recorded on six occassions
Find the value of . Round your answer to three decimal places.
A) .6
B) -1.4
C) .4
D) .7
Find the value of . Round your answer to three decimal places.A) .6
B) -1.4
C) .4
D) .7
فتح الحزمة
افتح القفل للوصول البطاقات البالغ عددها 29 في هذه المجموعة.
فتح الحزمة
k this deck
9
A basketball fan collected data on the number of points per game, y, of her favorite player, associated with the number of minutes, x, played per game
Given that
Sxx = 189.50, Sxy 317.50, and Syy 581.50, calculate the residual sum of squares S.S.E.
Given that Sxx = 189.50, Sxy 317.50, and Syy 581.50, calculate the residual sum of squares S.S.E.
فتح الحزمة
افتح القفل للوصول البطاقات البالغ عددها 29 في هذه المجموعة.
فتح الحزمة
k this deck
10
Consider the following data set
A) Determine the fitted line
B) Use the fitted line to predict the value of y when x = 3.5.
A) Determine the fitted line
B) Use the fitted line to predict the value of y when x = 3.5.
فتح الحزمة
افتح القفل للوصول البطاقات البالغ عددها 29 في هذه المجموعة.
فتح الحزمة
k this deck
11
Which of the following statements is (are) true?
III) The point ( , ) lies on the fitted regression line
A) Only I and II
B) Only I and III
C) Only II and III
D) All of them
III) The point ( , ) lies on the fitted regression line
A) Only I and II
B) Only I and III
C) Only II and III
D) All of them
فتح الحزمة
افتح القفل للوصول البطاقات البالغ عددها 29 في هذه المجموعة.
فتح الحزمة
k this deck
12
Suppose that n = 21, = 38.044, = 89.27, Sxx = 994.045, Sxy = 6191.08, and Syy = 76,293.5.
A) Obtain the equation of the best fitting straight line.
B) Calculate the residual sum of squares.
C) Estimate .
Round your answers to three decimal places.
A) Obtain the equation of the best fitting straight line.
B) Calculate the residual sum of squares.
C) Estimate .
Round your answers to three decimal places.
فتح الحزمة
افتح القفل للوصول البطاقات البالغ عددها 29 في هذه المجموعة.
فتح الحزمة
k this deck
13
Temperature anomaly means a departure from a reference value, usually obtained by a long-term average. A positive anomaly indicates that the observed temperature was warmer than the reference value. The following table shows the annual anomalies for the highest temperatures in six recent decades..
A) Obtain the last squares fit of year to the predictor temperature anomaly.
B) Calculate the residual sum of squares.
C) Estimate .
Round your answers to three decimal places.
A) Obtain the last squares fit of year to the predictor temperature anomaly.
B) Calculate the residual sum of squares.
C) Estimate .
Round your answers to three decimal places.
فتح الحزمة
افتح القفل للوصول البطاقات البالغ عددها 29 في هذه المجموعة.
فتح الحزمة
k this deck
14
Consider the following data.
A) Calculate the least squares estimate .
B) Calculate the least squares estimate .
C) Estimate the error variance .
D) Test H0: 1 = 0 versus H1: 1 0 with = 0.05. Answer "H0 is rejected at = 0.05" or "H0 is not rejected at = 0.05".
E) Estimate the expected y value corresponding to x = 3.
F) Give a 90% confidence interval for the expected y value at x = 3. Round your answer to two decimal places.
فتح الحزمة
افتح القفل للوصول البطاقات البالغ عددها 29 في هذه المجموعة.
فتح الحزمة
k this deck
15
Consider the following data set.
where Sxx = 10, Sxy = 16, and Syy = 26.8. Construct a 95% confidence interval for 1 . Round your answer to two decimal places.
where Sxx = 10, Sxy = 16, and Syy = 26.8. Construct a 95% confidence interval for 1 . Round your answer to two decimal places. فتح الحزمة
افتح القفل للوصول البطاقات البالغ عددها 29 في هذه المجموعة.
فتح الحزمة
k this deck
16
Consider the following data set:
where Sxx = 10 , Sxy = 25, and Syy = 74.Construct a 90% confidence interval for the intercept 0. Round your answer to three decimal places.
where Sxx = 10 , Sxy = 25, and Syy = 74.Construct a 90% confidence interval for the intercept 0. Round your answer to three decimal places.
فتح الحزمة
افتح القفل للوصول البطاقات البالغ عددها 29 في هذه المجموعة.
فتح الحزمة
k this deck
17
The Human Development Index (H.D.I.) provides a composite measure of three dimensions of human development: life expectancy, adult literacy, and income. One county's H.D.I. trend is shown below.
A) Determine the equation of the least squares regression line.
B) Estimate the H.D.I. in year 6.5.
C) Construct a 95% confidence interval for the response in part B. Round your answer to three decimal places.
A) Determine the equation of the least squares regression line.
B) Estimate the H.D.I. in year 6.5.
C) Construct a 95% confidence interval for the response in part B. Round your answer to three decimal places.
فتح الحزمة
افتح القفل للوصول البطاقات البالغ عددها 29 في هذه المجموعة.
فتح الحزمة
k this deck
18
Data are recorded at one ACM on the total time to wait in line and then complete a transaction y(minutes) and the number of persons, x, already in line.
A) Determine the equation of the least squares regression line. Round your answer to three decimal places.
B) Estimate the time to finish your transaction when 6 people are ahead of you. Round your answer to three decimal places.
C) Give a 95% prediction interval for the time to finish your transaction when 6 people are ahead of you in line. Round your answer to two decimal places.
فتح الحزمة
افتح القفل للوصول البطاقات البالغ عددها 29 في هذه المجموعة.
فتح الحزمة
k this deck
19
A recent graduate moving to a new job, collected a sample of rent (dollars) and size (square feet) of 2-bedroom apartments in a desirable area of the city. The data
have the summary statistics
We randomly selected 12 countries, of about 200 countries on the list. H.D.I. is the response variable y, and total fertility rate (births per woman), x, is the predictor variable. The data have the summary statistics.
n = 8 = 1072.25 = 1421.25 Sxx = 230081.5 Syy = 217237.5
Sxy = 212376.5
Determine the equation of the best fitting straight line. Round your answer to three decimal places.
فتح الحزمة
افتح القفل للوصول البطاقات البالغ عددها 29 في هذه المجموعة.
فتح الحزمة
k this deck
20
One measure of the development of a country is the Human Development Index (H.D.I.) which combines life expectancy, literacy, and gross domestic product per capita into an index whose values lie between 0 and 1, inclusive.
We randomly selected 12 countries, of the 182 countries on the list. H.D.I. is the response variable y, and total fertility rate (births per woman), x, is the predictor variable. The data have the summary statistics.
n = 12 = 1.825 = .85 Sxx = 2.7625 Syy = .0342 Sxy = -.1838
A) Estimate the mean value of H.D.I. for the total fertility rate of 2.5.
B) Construct a 95% confidence interval for the response in part A.
Round your answer to three decimal places.
فتح الحزمة
افتح القفل للوصول البطاقات البالغ عددها 29 في هذه المجموعة.
فتح الحزمة
k this deck
21
An advertising company collected data on the number of new contracts signed, y, and the number of presentations, x, made in each of six months. The summary statistics are
n = 6 = 34 = 7.1 Sxx = 1750 Sxy = 36.45 Syy = .78
Determine the proportion of variation in y that is explained by linear regression. Round your answer to three decimal places.
n = 6 = 34 = 7.1 Sxx = 1750 Sxy = 36.45 Syy = .78
Determine the proportion of variation in y that is explained by linear regression. Round your answer to three decimal places.
فتح الحزمة
افتح القفل للوصول البطاقات البالغ عددها 29 في هذه المجموعة.
فتح الحزمة
k this deck
22
The total number of hours worked by a student, y, last week depends on the number of days, x, they worked. Data on twenty-eight students produce the summary statistics
n = 28 = 3.21 = 14.79 Sxx = 2260.714 Sxy = 1969.286 Syy = 2076.714
Determine the proportion of variation in y that is explained by linear regression. Round your answer to three decimal places.
n = 28 = 3.21 = 14.79 Sxx = 2260.714 Sxy = 1969.286 Syy = 2076.714
Determine the proportion of variation in y that is explained by linear regression. Round your answer to three decimal places.
فتح الحزمة
افتح القفل للوصول البطاقات البالغ عددها 29 في هذه المجموعة.
فتح الحزمة
k this deck
23
Consider the following information:
n = 19 = 9.959 = 0.6679 Sxx = 1173.45 Sxy = 20.480 Syy = 0.41771
A) If x is the predictor variable, determine the proportion of variation in y, that is explained by linear regression.
B) If y is the predictor variable, determine the proportion of variation in x, that is explained by linear regression.
Round your answers to three decimal places.
فتح الحزمة
افتح القفل للوصول البطاقات البالغ عددها 29 في هذه المجموعة.
فتح الحزمة
k this deck
24
Calculate the correlation coefficient between the number of grocery carts, x, ahead in line and the time, y, to complete checkout.
فتح الحزمة
افتح القفل للوصول البطاقات البالغ عددها 29 في هذه المجموعة.
فتح الحزمة
k this deck
25
Consider the data set
Calculate the
(a) sample means
(b) Sxx , Sxy , Syy
(c) Calculate the least squares estimates β1 and β0.
(d) Calculate the sample correlation coefficient.
Calculate the
(a) sample means
(b) Sxx , Sxy , Syy
(c) Calculate the least squares estimates β1 and β0.
(d) Calculate the sample correlation coefficient.
فتح الحزمة
افتح القفل للوصول البطاقات البالغ عددها 29 في هذه المجموعة.
فتح الحزمة
k this deck
26
Consider the data set
Calculate the
(a) sample means.
(b) Sxx , Sxy Syy.
(c) Calculate the least squares estimates 1 and 0.
(d) Estimate the error variance.
(e) Determine the proportion of variation in y explained by x.
Calculate the
(a) sample means.
(b) Sxx , Sxy Syy.
(c) Calculate the least squares estimates 1 and 0.
(d) Estimate the error variance.
(e) Determine the proportion of variation in y explained by x.
فتح الحزمة
افتح القفل للوصول البطاقات البالغ عددها 29 في هذه المجموعة.
فتح الحزمة
k this deck
27
Consider the data
(a) Calculate the least squares estimates 1 and 0.
(b) Estimate the error variance.
(c) Obtain a 95 % confidence interval for 1. Can you conclude that the slope is different from 0?
(d) Determine the proportion of variation in y explained by x.
(a) Calculate the least squares estimates 1 and 0.
(b) Estimate the error variance.
(c) Obtain a 95 % confidence interval for 1. Can you conclude that the slope is different from 0?
(d) Determine the proportion of variation in y explained by x.
فتح الحزمة
افتح القفل للوصول البطاقات البالغ عددها 29 في هذه المجموعة.
فتح الحزمة
k this deck
28
Consider the data
(a) Calculate the least squares estimates 1 and 0.
(b) Estimate the error variance.
(c) Obtain a 95 % confidence interval for 1. Can you conclude that the slope is different from 0?
(d) Find a 95% confidence interval for the mean response when
x = 8.
(a) Calculate the least squares estimates 1 and 0.(b) Estimate the error variance.
(c) Obtain a 95 % confidence interval for 1. Can you conclude that the slope is different from 0?
(d) Find a 95% confidence interval for the mean response when
x = 8.
فتح الحزمة
افتح القفل للوصول البطاقات البالغ عددها 29 في هذه المجموعة.
فتح الحزمة
k this deck
29
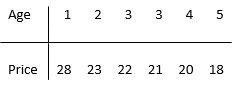
An internet site lists the prices, y, of a used popular midsized model foreign car. The age, x, in years and the price(thousands $) are given in the table for a sample of six cars.
(a) Determine the least squares regression line.
(b) Estimate the price of a used car of this model whose age is 9.
(c) Give a 95% prediction interval for the price of a used car of age 9.
(d) Besides the uncertainty accounted for in the calculation in Part c, what else could lead to a serious mistake in the pre- diction.
(a) Determine the least squares regression line.
(b) Estimate the price of a used car of this model whose age is 9.
(c) Give a 95% prediction interval for the price of a used car of age 9.
(d) Besides the uncertainty accounted for in the calculation in Part c, what else could lead to a serious mistake in the pre- diction.
فتح الحزمة
افتح القفل للوصول البطاقات البالغ عددها 29 في هذه المجموعة.
فتح الحزمة
k this deck
فتح الحزمة
افتح القفل للوصول البطاقات البالغ عددها 29 في هذه المجموعة.


