Deck 3: Descriptive Study of Bivariate Data
ملء الشاشة (f)
سؤال
سؤال
سؤال
سؤال
سؤال
Final grades of students enrolled in a Introductory Statistics course are summarized below.
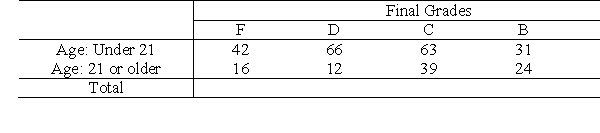 Calculate the remaining marginal totals.
A) 58, 78, 102, 55, 87
B) 58, 78, 102, 33, 53
C) 58, 78, 64, 30, 87
D) 40, 78, 102, 55, 57
Calculate the remaining marginal totals.A) 58, 78, 102, 55, 87
B) 58, 78, 102, 33, 53
C) 58, 78, 64, 30, 87
D) 40, 78, 102, 55, 57
سؤال
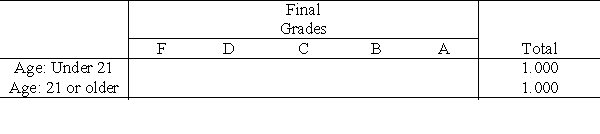
Final grades of students enrolled in an Introductory Statistics course are summarized below.
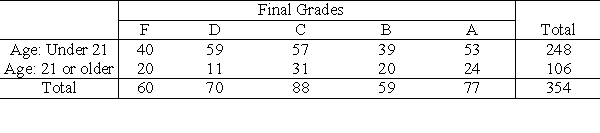 Complete the following table by calculating the relative frequencies separately for each row. Round your answers to three decimal places.
Complete the following table by calculating the relative frequencies separately for each row. Round your answers to three decimal places. سؤال
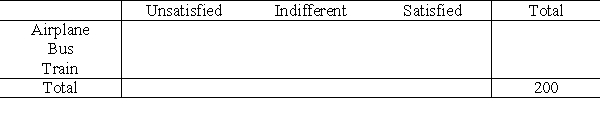
A survey was conducted to study the degree of satisfaction with the service of passengers from New York City to Washington D.C. The following table shows the relative frequencies.
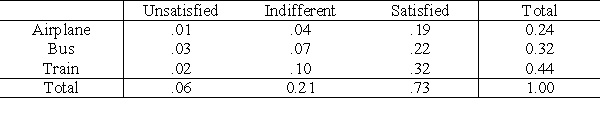 Complete the table of cross-tabulated frequencies.
Complete the table of cross-tabulated frequencies. سؤال
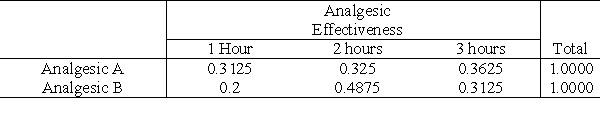
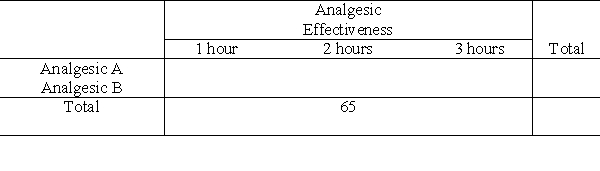
Given the following table of relative frequencies by row, complete the table of cross-tabulated frequencies.
سؤال
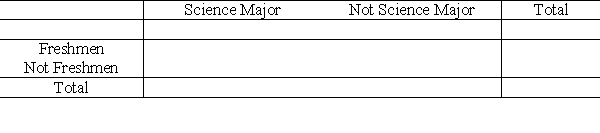
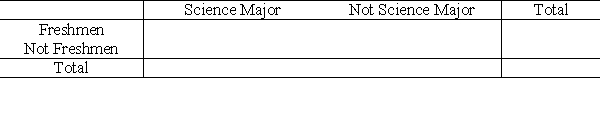
In a group of 180 college students, 43 are science majors, 66 are freshmen, and 31 are both. Based on these data, complete the following two-way frequency table.
سؤال
In a group of 280 college students, 55 are science majors, 86 are freshmen, and 50 are both. Based on these data, calculate the relative frequencies.
سؤال
سؤال
سؤال
سؤال
سؤال
سؤال
سؤال
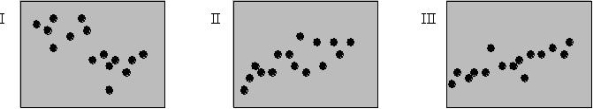
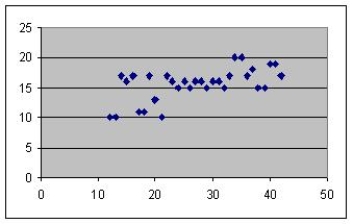
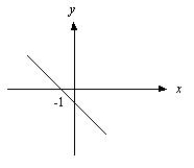
Match the following values of r with the correct diagrams. Write your answer in the form letter (A, B, or C) followed by the Roman numeral (I, II, or III).
(A) r = -.2, (B) r = .6, (C) r = .5
(A) r = -.2, (B) r = .6, (C) r = .5
سؤال
سؤال
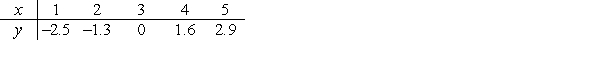
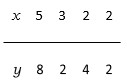
Consider the data set

A) Complete the table.
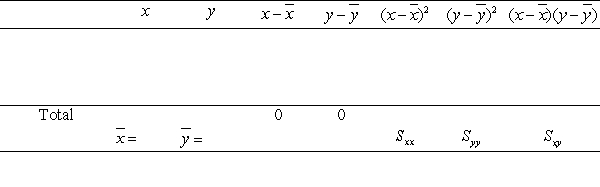 Use the formula
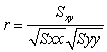
to calculate the sample correlation. Round your answer to three decimal places.
A) Complete the table.
Use the formula to calculate the sample correlation. Round your answer to three decimal places.
سؤال
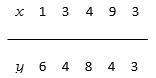
Consider the data set
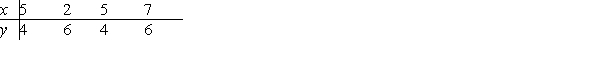 Find the sample correlation coefficient using the formula
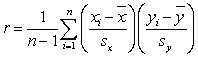
.
Find the sample correlation coefficient using the formula .
سؤال
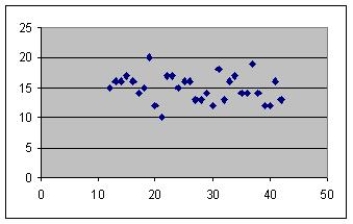
Is the correlation in the figure about
(a) .2, (b) -.4, (c) .4, (d) .8, or (e) -.9?
(a) .2, (b) -.4, (c) .4, (d) .8, or (e) -.9?
سؤال
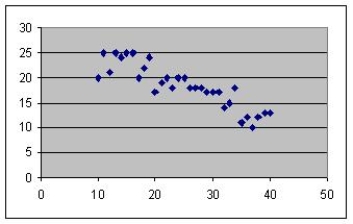
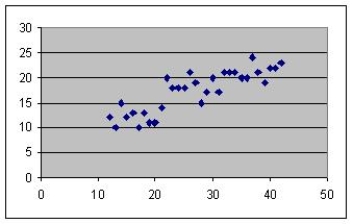
Estimate the correlation coefficient of the figure below. 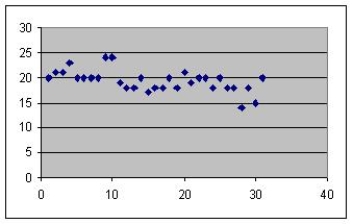
A) .5
B) .1
C) -.5
D) -.8
A) .5
B) .1
C) -.5
D) -.8
سؤال
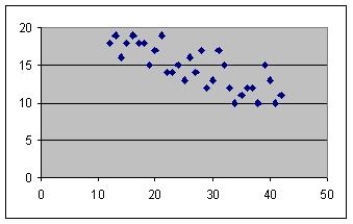
Find the scatter diagram that corresponds to the correlation coefficient r = -.8.
A)
B)
C)
D)
A)
B)
C)
D)
سؤال
Calculations from a data set of n = 36 pairs of (x, y) values have provided the following results.

Obtain the correlation coefficient.
Obtain the correlation coefficient.
سؤال
Calculations from a data set of n = 32 pairs of (x, y) values have provided the following results.

Obtain the correlation coefficient.
Obtain the correlation coefficient.
سؤال
سؤال
سؤال
سؤال
سؤال
سؤال
سؤال
سؤال
سؤال
سؤال
Consider the line

A) What is its intercept?
B) What is its slope?
A) What is its intercept?
B) What is its slope?
سؤال
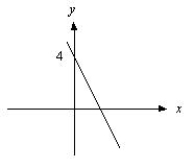
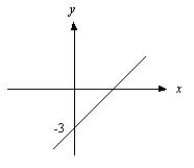
What is the graph of the line 
.
A)

B)
C)
D)
.
A)
B)
C)
D)
سؤال
سؤال
For the data set, compute the least squares estimates.
A)
B)
A)
B)
سؤال
In an experiment to study the relation between the speed of an athlete running 100 meters, y (meters/second) and the environment temperature, x (Celsius degrees), her trainer collected the following statistics:
 Find the equation of the least squares fitted line.
Find the equation of the least squares fitted line. سؤال
سؤال
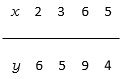
Consider the data set
Calculate the
(a) sample means
(b) Sxx , Sxy , Syy
(c) sample correlation coefficient.
Calculate the
(a) sample means
(b) Sxx , Sxy , Syy
(c) sample correlation coefficient.
سؤال
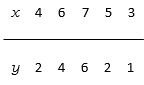
Consider the data set
 Calculate the
(a) sample means
(b)Sxx , Sxy , Syy
(c) sample correlation coefficient.
Calculate the(a) sample means
(b)Sxx , Sxy , Syy
(c) sample correlation coefficient.
سؤال
Find the least square fitted line when the values of y and x are
سؤال
Find the least squares fitted line when the values of y and x are

فتح الحزمة
قم بالتسجيل لفتح البطاقات في هذه المجموعة!
Unlock Deck
Unlock Deck
1/44
العب
ملء الشاشة (f)
Deck 3: Descriptive Study of Bivariate Data
1
Observations on two or more variables recorded for the individual sampling units are called ______ or multivariate data.
bivariate
2
Classify the following statement as "single variable", "bivariate", or multivariate".
Age and weight of college students.
Age and weight of college students.
bivariate
3
The total frequency for any row is given in the bottom margin.
False
4
In statistical terminology, contingency tables correspond to cross-classified or cross-tabulated data.
فتح الحزمة
افتح القفل للوصول البطاقات البالغ عددها 44 في هذه المجموعة.
فتح الحزمة
k this deck
5
Final grades of students enrolled in a Introductory Statistics course are summarized below.
Calculate the remaining marginal totals.
A) 58, 78, 102, 55, 87
B) 58, 78, 102, 33, 53
C) 58, 78, 64, 30, 87
D) 40, 78, 102, 55, 57
Calculate the remaining marginal totals.A) 58, 78, 102, 55, 87
B) 58, 78, 102, 33, 53
C) 58, 78, 64, 30, 87
D) 40, 78, 102, 55, 57
فتح الحزمة
افتح القفل للوصول البطاقات البالغ عددها 44 في هذه المجموعة.
فتح الحزمة
k this deck
6
Final grades of students enrolled in an Introductory Statistics course are summarized below.
Complete the following table by calculating the relative frequencies separately for each row. Round your answers to three decimal places.
Complete the following table by calculating the relative frequencies separately for each row. Round your answers to three decimal places. فتح الحزمة
افتح القفل للوصول البطاقات البالغ عددها 44 في هذه المجموعة.
فتح الحزمة
k this deck
7
A survey was conducted to study the degree of satisfaction with the service of passengers from New York City to Washington D.C. The following table shows the relative frequencies.
Complete the table of cross-tabulated frequencies.
Complete the table of cross-tabulated frequencies. فتح الحزمة
افتح القفل للوصول البطاقات البالغ عددها 44 في هذه المجموعة.
فتح الحزمة
k this deck
8
Given the following table of relative frequencies by row, complete the table of cross-tabulated frequencies.
فتح الحزمة
افتح القفل للوصول البطاقات البالغ عددها 44 في هذه المجموعة.
فتح الحزمة
k this deck
9
In a group of 180 college students, 43 are science majors, 66 are freshmen, and 31 are both. Based on these data, complete the following two-way frequency table.
فتح الحزمة
افتح القفل للوصول البطاقات البالغ عددها 44 في هذه المجموعة.
فتح الحزمة
k this deck
10
In a group of 280 college students, 55 are science majors, 86 are freshmen, and 50 are both. Based on these data, calculate the relative frequencies.
فتح الحزمة
افتح القفل للوصول البطاقات البالغ عددها 44 في هذه المجموعة.
فتح الحزمة
k this deck
11
The value of the correlation coefficient r, is always between -1 and ______.
فتح الحزمة
افتح القفل للوصول البطاقات البالغ عددها 44 في هذه المجموعة.
فتح الحزمة
k this deck
12
The magnitude of the correlation coefficient r, indicates the strength of a linear relation.
فتح الحزمة
افتح القفل للوصول البطاقات البالغ عددها 44 في هذه المجموعة.
فتح الحزمة
k this deck
13
The sign of the correlation coefficient r, indicates the weakness of a linear relation.
فتح الحزمة
افتح القفل للوصول البطاقات البالغ عددها 44 في هذه المجموعة.
فتح الحزمة
k this deck
14
If the pattern of (x, y) values is a band that runs from ______ left to ______ right, then
r > 0.
r > 0.
فتح الحزمة
افتح القفل للوصول البطاقات البالغ عددها 44 في هذه المجموعة.
فتح الحزمة
k this deck
15
If all (x, y) values lie exactly on a straight line with a ______ slope, then r = +1.
فتح الحزمة
افتح القفل للوصول البطاقات البالغ عددها 44 في هذه المجموعة.
فتح الحزمة
k this deck
16
A value of r really close to -1 means that the linear association ______.
A) is very weak
B) is very strong
C) cannot be determined
D) None of these
A) is very weak
B) is very strong
C) cannot be determined
D) None of these
فتح الحزمة
افتح القفل للوصول البطاقات البالغ عددها 44 في هذه المجموعة.
فتح الحزمة
k this deck
17
Match the following values of r with the correct diagrams. Write your answer in the form letter (A, B, or C) followed by the Roman numeral (I, II, or III).
(A) r = -.2, (B) r = .6, (C) r = .5
(A) r = -.2, (B) r = .6, (C) r = .5
فتح الحزمة
افتح القفل للوصول البطاقات البالغ عددها 44 في هذه المجموعة.
فتح الحزمة
k this deck
18
In the following instance, would you expect a positive, negative, or zero correlation?
The size of an apartment and the sex of the tenant.
The size of an apartment and the sex of the tenant.
فتح الحزمة
افتح القفل للوصول البطاقات البالغ عددها 44 في هذه المجموعة.
فتح الحزمة
k this deck
19
Consider the data set
A) Complete the table.
Use the formula
to calculate the sample correlation. Round your answer to three decimal places.
A) Complete the table.
Use the formula to calculate the sample correlation. Round your answer to three decimal places.
فتح الحزمة
افتح القفل للوصول البطاقات البالغ عددها 44 في هذه المجموعة.
فتح الحزمة
k this deck
20
Consider the data set
Find the sample correlation coefficient using the formula
.
Find the sample correlation coefficient using the formula .
فتح الحزمة
افتح القفل للوصول البطاقات البالغ عددها 44 في هذه المجموعة.
فتح الحزمة
k this deck
21
Is the correlation in the figure about
(a) .2, (b) -.4, (c) .4, (d) .8, or (e) -.9?
(a) .2, (b) -.4, (c) .4, (d) .8, or (e) -.9?
فتح الحزمة
افتح القفل للوصول البطاقات البالغ عددها 44 في هذه المجموعة.
فتح الحزمة
k this deck
22
Estimate the correlation coefficient of the figure below.
A) .5
B) .1
C) -.5
D) -.8
A) .5
B) .1
C) -.5
D) -.8
فتح الحزمة
افتح القفل للوصول البطاقات البالغ عددها 44 في هذه المجموعة.
فتح الحزمة
k this deck
23
Find the scatter diagram that corresponds to the correlation coefficient r = -.8.
A)
B)
C)
D)
A)
B)
C)
D)
فتح الحزمة
افتح القفل للوصول البطاقات البالغ عددها 44 في هذه المجموعة.
فتح الحزمة
k this deck
24
Calculations from a data set of n = 36 pairs of (x, y) values have provided the following results.
Obtain the correlation coefficient.
Obtain the correlation coefficient.
فتح الحزمة
افتح القفل للوصول البطاقات البالغ عددها 44 في هذه المجموعة.
فتح الحزمة
k this deck
25
Calculations from a data set of n = 32 pairs of (x, y) values have provided the following results.
Obtain the correlation coefficient.
Obtain the correlation coefficient.
فتح الحزمة
افتح القفل للوصول البطاقات البالغ عددها 44 في هذه المجموعة.
فتح الحزمة
k this deck
26
The false correlation produced by a lurking variable is called ________ correlation.
فتح الحزمة
افتح القفل للوصول البطاقات البالغ عددها 44 في هذه المجموعة.
فتح الحزمة
k this deck
27
An observed correlation between two variables may be caused by the influence of a third variable.
فتح الحزمة
افتح القفل للوصول البطاقات البالغ عددها 44 في هذه المجموعة.
فتح الحزمة
k this deck
28
Suppose from a data set of distance measurements in yards and time measurements in hours, the value of r is found to be 0.82. What would the value of r be if the distances were measured in feet and time in minutes.
A) -.82
B) .82
C) .27
D) .01
A) -.82
B) .82
C) .27
D) .01
فتح الحزمة
افتح القفل للوصول البطاقات البالغ عددها 44 في هذه المجموعة.
فتح الحزمة
k this deck
29
A scientist in a center for disease control observes that the number of bacteria in a culture and air pollution in the city rise with time. Is there exists a lurking variable in this case?
فتح الحزمة
افتح القفل للوصول البطاقات البالغ عددها 44 في هذه المجموعة.
فتح الحزمة
k this deck
30
Usually, the predictor or ______ variable is denoted by the letter ______.
فتح الحزمة
افتح القفل للوصول البطاقات البالغ عددها 44 في هذه المجموعة.
فتح الحزمة
k this deck
31
An experimental study of the relation between two variables is often motivated by a need to predict one from the other. The first step in such a study is to plot and examine the scatter diagram.
فتح الحزمة
افتح القفل للوصول البطاقات البالغ عددها 44 في هذه المجموعة.
فتح الحزمة
k this deck
32
The numerical value of r indicates how effectively y can be predicted from x.
فتح الحزمة
افتح القفل للوصول البطاقات البالغ عددها 44 في هذه المجموعة.
فتح الحزمة
k this deck
33
A line is determined by two constants. One of these constants is the ______, that is, its height above the origin.
فتح الحزمة
افتح القفل للوصول البطاقات البالغ عددها 44 في هذه المجموعة.
فتح الحزمة
k this deck
34
A line is determined by two constants. One of these constants is the ______, that is, the amount that y increases whenever x is increased by one unit.
فتح الحزمة
افتح القفل للوصول البطاقات البالغ عددها 44 في هذه المجموعة.
فتح الحزمة
k this deck
35
Consider the line
A) What is its intercept?
B) What is its slope?
A) What is its intercept?
B) What is its slope?
فتح الحزمة
افتح القفل للوصول البطاقات البالغ عددها 44 في هذه المجموعة.
فتح الحزمة
k this deck
36
What is the graph of the line
.
A)
B)
C)
D)
.
A)
B)
C)
D)
فتح الحزمة
افتح القفل للوصول البطاقات البالغ عددها 44 في هذه المجموعة.
فتح الحزمة
k this deck
37
A fabric manufacturer has determined that the resistance y of a fiber is given by
y = 18x - 155
where x (in grams) denotes the amount of a synthetic compound used to make the fiber.
A) If 44 grams of the synthetic compound are used, what is the resistance?
B) At least how many grams of synthetic compound must be used to have a positive resistance?
y = 18x - 155
where x (in grams) denotes the amount of a synthetic compound used to make the fiber.
A) If 44 grams of the synthetic compound are used, what is the resistance?
B) At least how many grams of synthetic compound must be used to have a positive resistance?
فتح الحزمة
افتح القفل للوصول البطاقات البالغ عددها 44 في هذه المجموعة.
فتح الحزمة
k this deck
38
For the data set, compute the least squares estimates.
A)
B)
A)
B)
فتح الحزمة
افتح القفل للوصول البطاقات البالغ عددها 44 في هذه المجموعة.
فتح الحزمة
k this deck
39
In an experiment to study the relation between the speed of an athlete running 100 meters, y (meters/second) and the environment temperature, x (Celsius degrees), her trainer collected the following statistics:
Find the equation of the least squares fitted line.
Find the equation of the least squares fitted line. فتح الحزمة
افتح القفل للوصول البطاقات البالغ عددها 44 في هذه المجموعة.
فتح الحزمة
k this deck
40
For one coastal state, there is a high correlation between ice cream sales and number of people swimming in the ocean. Suggest a possible lurking variable and explain what is meant by the term lurking variable.
فتح الحزمة
افتح القفل للوصول البطاقات البالغ عددها 44 في هذه المجموعة.
فتح الحزمة
k this deck
41
Consider the data set
Calculate the
(a) sample means
(b) Sxx , Sxy , Syy
(c) sample correlation coefficient.
Calculate the
(a) sample means
(b) Sxx , Sxy , Syy
(c) sample correlation coefficient.
فتح الحزمة
افتح القفل للوصول البطاقات البالغ عددها 44 في هذه المجموعة.
فتح الحزمة
k this deck
42
Consider the data set
Calculate the
(a) sample means
(b)Sxx , Sxy , Syy
(c) sample correlation coefficient.
Calculate the(a) sample means
(b)Sxx , Sxy , Syy
(c) sample correlation coefficient.
فتح الحزمة
افتح القفل للوصول البطاقات البالغ عددها 44 في هذه المجموعة.
فتح الحزمة
k this deck
43
Find the least square fitted line when the values of y and x are
فتح الحزمة
افتح القفل للوصول البطاقات البالغ عددها 44 في هذه المجموعة.
فتح الحزمة
k this deck
44
Find the least squares fitted line when the values of y and x are
فتح الحزمة
افتح القفل للوصول البطاقات البالغ عددها 44 في هذه المجموعة.
فتح الحزمة
k this deck
فتح الحزمة
افتح القفل للوصول البطاقات البالغ عددها 44 في هذه المجموعة.


