Deck 2: Organization and Description of Data
ملء الشاشة (f)
سؤال
سؤال
سؤال
سؤال
سؤال
سؤال
A die is rolled 16 times, the scores are shown below.

a) Find the frequency of even numbers.
b) Find the relative frequency of even numbers. Round your answer to three decimal places.
a) Find the frequency of even numbers.
b) Find the relative frequency of even numbers. Round your answer to three decimal places.
سؤال
A die is rolled 16 times, the scores are shown below.

a) Find the frequency of 5.
b) Find the relative frequency of 5. Round your answer to four decimal places.
a) Find the frequency of 5.
b) Find the relative frequency of 5. Round your answer to four decimal places.
سؤال
A die is rolled 16 times, the scores are shown below.

a) Find the frequency of numbers larger than 4.
b) Find the relative frequency of numbers larger than 4. Round your answer to four decimal places.
a) Find the frequency of numbers larger than 4.
b) Find the relative frequency of numbers larger than 4. Round your answer to four decimal places.
سؤال
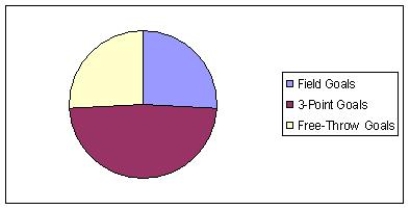
In a recent basketball season, one-star player scored 475 field goals, 4 3-point field goals, and 292 free-throw goals. Find the pie chart that better describes the data.
A)
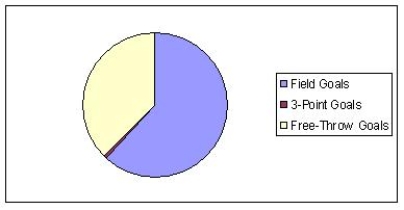
B)
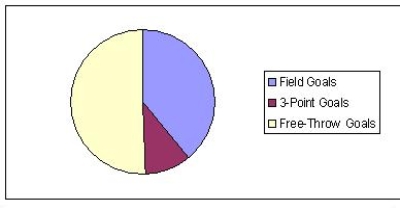
C)
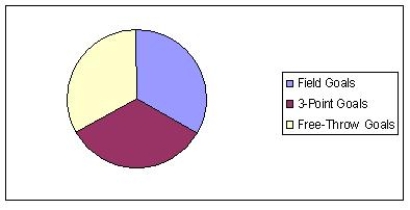
D)
A)
B)
C)
D)
سؤال
The following table shows the countries whose teams have won the UEFA Champions League.
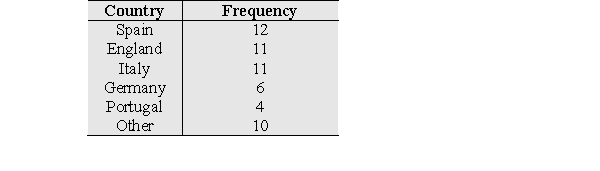
a) Calculate the relative frequency of each country. Round your answers to three decimal places
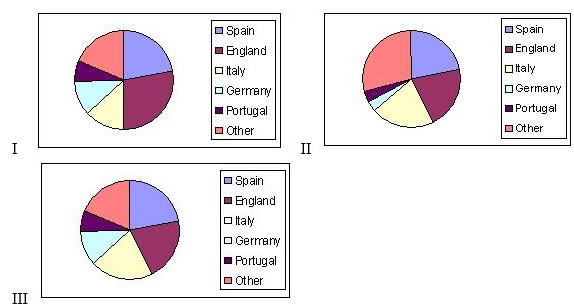
b) Select the pie chart that better describes the data.
a) Calculate the relative frequency of each country. Round your answers to three decimal places
b) Select the pie chart that better describes the data.
سؤال
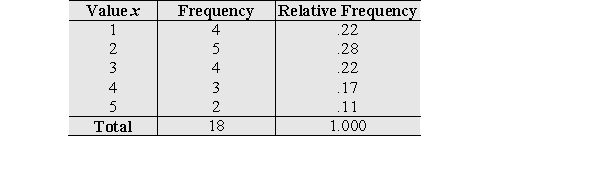
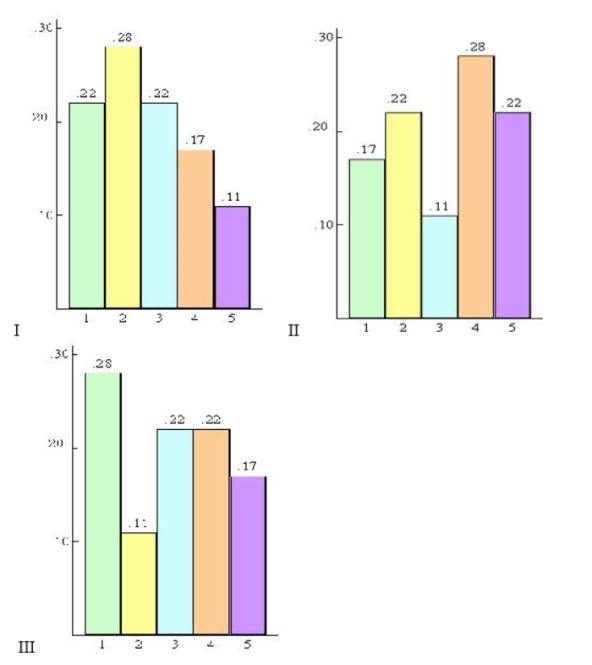
Find the histogram that better describes the data.
سؤال
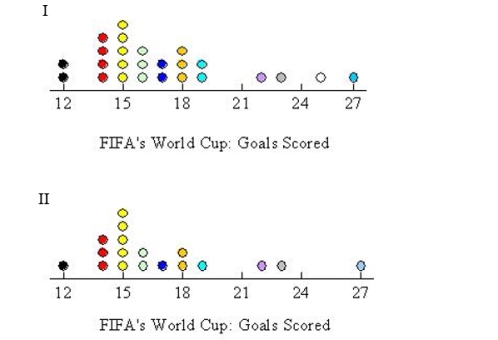
The top number of goals scored by a national team in 18 FIFA's World Cups is shown below. Select the dot diagram that matches with the data.

سؤال
The number of touchdowns of a college football team is:

a) Complete the frequency distribution.
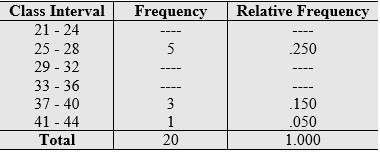
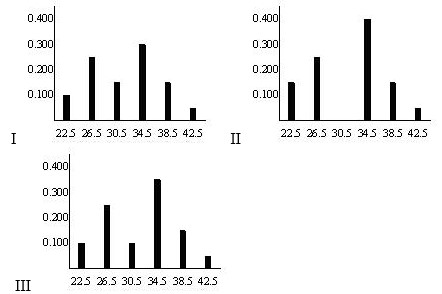
b) Select the line diagram that matches the data.
a) Complete the frequency distribution.
b) Select the line diagram that matches the data.
سؤال
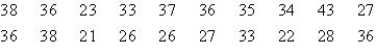
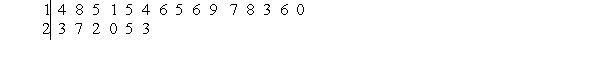
The following data represents the Tampa Buccaneers number of touchdowns per season, in 20 seasons. Make a stem-and-leaf display.
سؤال
Use the stem-and-leaf display to construct a frequency distribution with intervals 10-12, 13-15, ..., 25-27.
سؤال
The table below shows the fastest race lap in the F1 Grand Prix in Monza.
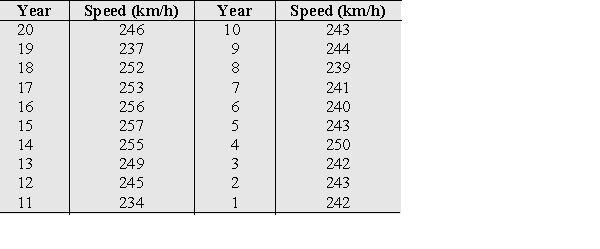 Make a stem-and-leaf display with a 2-digit stem.
Make a stem-and-leaf display with a 2-digit stem. سؤال
Calculate the mean and median of the following data set.

سؤال
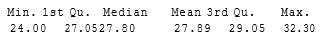
Calculate the mean and median of the following data set. Round your answer to the nearest tenth. 
A) 36.7 and 30, respectively
B) 36.7 and 32, respectively
C) 36.7 and 31, respectively
D) Mean: 36.7; there is no median
A) 36.7 and 30, respectively
B) 36.7 and 32, respectively
C) 36.7 and 31, respectively
D) Mean: 36.7; there is no median
سؤال
Calculate the mean and the median of the following data set.

سؤال
In a period of twelve years, the record low temperatures ( F) in Los Angeles CA were:
 Find the dot diagram that corresponds to these data.
Find the dot diagram that corresponds to these data. سؤال
Calculate the quartiles of the following data set.

سؤال
Calculate the third quartile. 
A) 26
B) 31
C) 25
D) 27
A) 26
B) 31
C) 25
D) 27
سؤال
سؤال
سؤال
Find the 10th percentile. 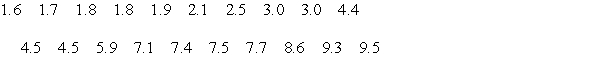
A) 1.7
B) 1.8
C) 1.72
D) 1.75
A) 1.7
B) 1.8
C) 1.72
D) 1.75
سؤال
Find the interquartile range.
سؤال
سؤال
سؤال
For the data set

a) Calculate the deviations (X-X̄) and check to see that they add up to 0.
b) Calculate the sample variance and the standard deviation.
a) Calculate the deviations (X-X̄) and check to see that they add up to 0.
b) Calculate the sample variance and the standard deviation.
سؤال
For the data set
 calculate s2 by using the alternative formula. Round your answer to the nearest tenth.
calculate s2 by using the alternative formula. Round your answer to the nearest tenth. سؤال
Find the variance of the following data set. 
A) 1.4
B) 2.0
C) 1.7
D) 3.0
A) 1.4
B) 2.0
C) 1.7
D) 3.0
سؤال
Find the standard deviation of the following data set. 
A) 56.0
B) 57.0
C) 49.5
D) 48.5
A) 56.0
B) 57.0
C) 49.5
D) 48.5
سؤال
A football fan recorded the total number of points scored by 5 teams during week 1.

a) Calculate the sample variance.
b) Calculate the sample standard deviation.
a) Calculate the sample variance.
b) Calculate the sample standard deviation.
سؤال
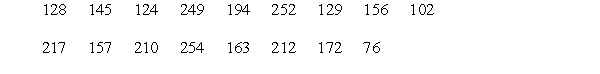
A report on the points gained by football teams playing at home in week 2 of the season are summarized below.
a) Calculate the sample variance.
b) Calculate the interquartile range.
a) Calculate the sample variance.
b) Calculate the interquartile range.
سؤال
According to the empirical guidelines for symmetric bell-shaped distributions, approximately 95% of the data lie within

سؤال
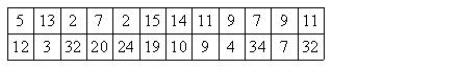
Refer to the data.

a) Calculate and s.
b) Find the proportion of the observations that are in the intervals , , and .
a) Calculate and s.
b) Find the proportion of the observations that are in the intervals , , and .
سؤال
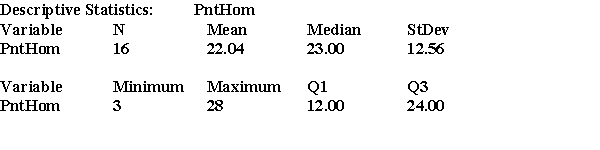
Based on the boxplot,
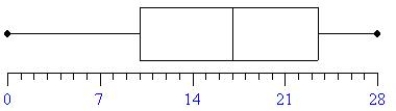 complete the table.

complete the table. سؤال
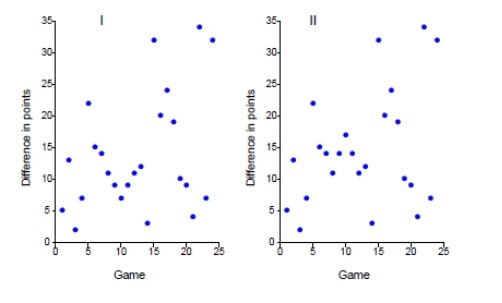
During a recent season, the Orlando Magics basketball team won 59 games. The diference in points for 24 of these games is shown below. Find the time plot that corresponds to these data.
سؤال
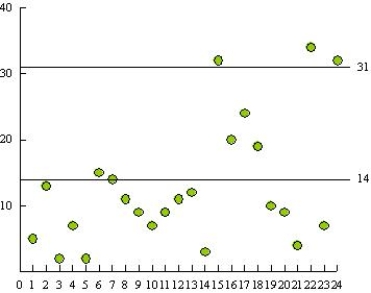
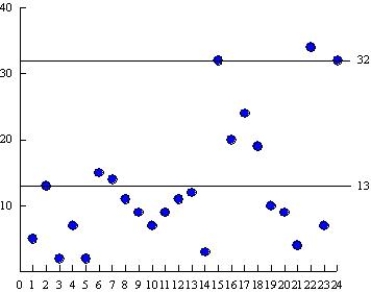
During a recent regular season, the Orlando magics basketball team won 59 games. The difference of points in 24 of these games is shown below. Find the control chart that corresponds to these data.
 I
I
 II
II
I II سؤال
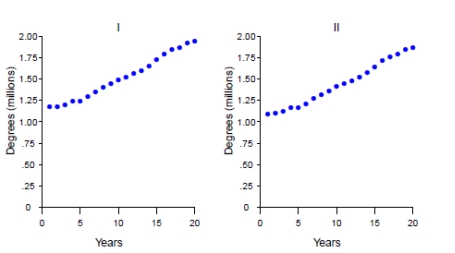
The number of bachelor's degrees earned in the United States, over
a recent 20-year period are given in the following table. The number is
presented in millions of degrees.
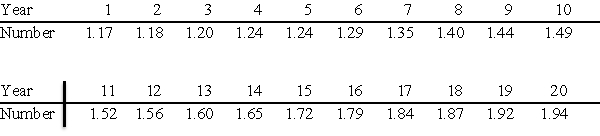 Select the time plot of the number of bachelor's degrees.
a recent 20-year period are given in the following table. The number is
presented in millions of degrees.
Select the time plot of the number of bachelor's degrees. سؤال
The stem-and-leaf display given here shows the final examination scores of students in a statistics course. (Leaf unit = 1.0)
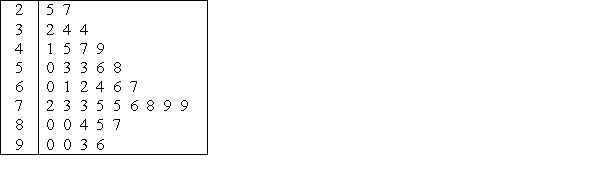 a) Find the median score.
b) Find the quartiles Q1 and Q3.
c) What proportion of the students scored below 70? Round your answer to three decimal places.
a) Find the median score.b) Find the quartiles Q1 and Q3.
c) What proportion of the students scored below 70? Round your answer to three decimal places.
سؤال
سؤال
سؤال
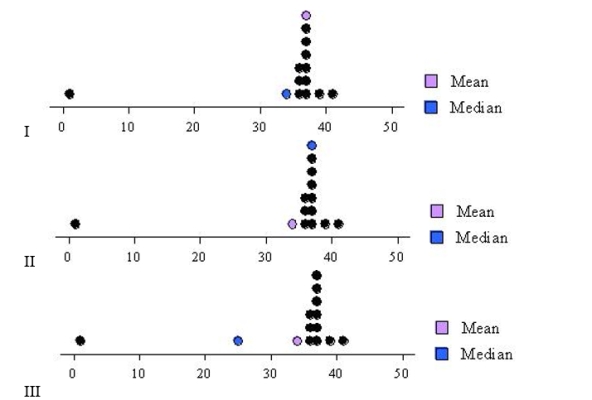
Let s1, s2, and s3 be the standard deviations of the bell-shaped graphs I, II, and III, respectively. Place them in increasing order. 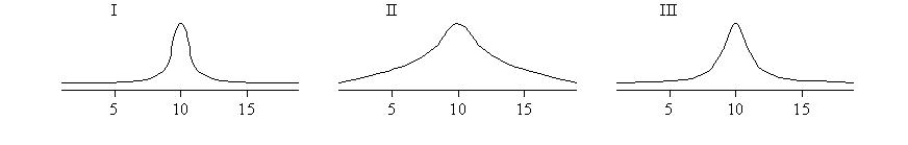
A) S2 , S3 , S1
B) S1 , S3 , S2
C) S3 , S1 , S2
D) S2 , S1 , S3
A) S2 , S3 , S1
B) S1 , S3 , S2
C) S3 , S1 , S2
D) S2 , S1 , S3
سؤال
سؤال
سؤال
سؤال
The table below shows the attendance to the Super Bowl for 14 years
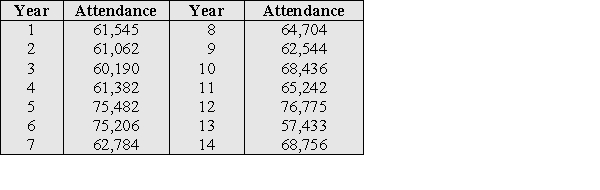
a) Find the 10th percentile.
b) Find the interquartile range.
a) Find the 10th percentile.
b) Find the interquartile range.
سؤال
سؤال
سؤال
سؤال
سؤال
Consider the software summary of the data on the length of a wolf's Canine(mm).
n = 19
sd(x) = 1.969
(a) sample range
(b) sample interquartile range.
(c)
n = 19
sd(x) = 1.969
(a) sample range
(b) sample interquartile range.
(c)

فتح الحزمة
قم بالتسجيل لفتح البطاقات في هذه المجموعة!
Unlock Deck
Unlock Deck
1/53
العب
ملء الشاشة (f)
Deck 2: Organization and Description of Data
1
The main types of data are qualitative and numerical.
True
2
The measurement scale for a ______ variable does not have gaps.
continuous
3
In describing a data set of measurements, the computation of numerical measures is irrelevant.
False
4
Both, categorical and numerical data can be described graphically using tables and ______.
فتح الحزمة
افتح القفل للوصول البطاقات البالغ عددها 53 في هذه المجموعة.
فتح الحزمة
k this deck
5
A frequency table for a sample of units
A) shows all sample units
B) shows the counts of individual categories
C) shows all units within a category
D) shows the relative frequencies of each category
A) shows all sample units
B) shows the counts of individual categories
C) shows all units within a category
D) shows the relative frequencies of each category
فتح الحزمة
افتح القفل للوصول البطاقات البالغ عددها 53 في هذه المجموعة.
فتح الحزمة
k this deck
6
A die is rolled 16 times, the scores are shown below.
a) Find the frequency of even numbers.
b) Find the relative frequency of even numbers. Round your answer to three decimal places.
a) Find the frequency of even numbers.
b) Find the relative frequency of even numbers. Round your answer to three decimal places.
فتح الحزمة
افتح القفل للوصول البطاقات البالغ عددها 53 في هذه المجموعة.
فتح الحزمة
k this deck
7
A die is rolled 16 times, the scores are shown below.
a) Find the frequency of 5.
b) Find the relative frequency of 5. Round your answer to four decimal places.
a) Find the frequency of 5.
b) Find the relative frequency of 5. Round your answer to four decimal places.
فتح الحزمة
افتح القفل للوصول البطاقات البالغ عددها 53 في هذه المجموعة.
فتح الحزمة
k this deck
8
A die is rolled 16 times, the scores are shown below.
a) Find the frequency of numbers larger than 4.
b) Find the relative frequency of numbers larger than 4. Round your answer to four decimal places.
a) Find the frequency of numbers larger than 4.
b) Find the relative frequency of numbers larger than 4. Round your answer to four decimal places.
فتح الحزمة
افتح القفل للوصول البطاقات البالغ عددها 53 في هذه المجموعة.
فتح الحزمة
k this deck
9
In a recent basketball season, one-star player scored 475 field goals, 4 3-point field goals, and 292 free-throw goals. Find the pie chart that better describes the data.
A)
B)
C)
D)
A)
B)
C)
D)
فتح الحزمة
افتح القفل للوصول البطاقات البالغ عددها 53 في هذه المجموعة.
فتح الحزمة
k this deck
10
The following table shows the countries whose teams have won the UEFA Champions League.
a) Calculate the relative frequency of each country. Round your answers to three decimal places
b) Select the pie chart that better describes the data.
a) Calculate the relative frequency of each country. Round your answers to three decimal places
b) Select the pie chart that better describes the data.
فتح الحزمة
افتح القفل للوصول البطاقات البالغ عددها 53 في هذه المجموعة.
فتح الحزمة
k this deck
11
Find the histogram that better describes the data.
فتح الحزمة
افتح القفل للوصول البطاقات البالغ عددها 53 في هذه المجموعة.
فتح الحزمة
k this deck
12
The top number of goals scored by a national team in 18 FIFA's World Cups is shown below. Select the dot diagram that matches with the data.
فتح الحزمة
افتح القفل للوصول البطاقات البالغ عددها 53 في هذه المجموعة.
فتح الحزمة
k this deck
13
The number of touchdowns of a college football team is:
a) Complete the frequency distribution.
b) Select the line diagram that matches the data.
a) Complete the frequency distribution.
b) Select the line diagram that matches the data.
فتح الحزمة
افتح القفل للوصول البطاقات البالغ عددها 53 في هذه المجموعة.
فتح الحزمة
k this deck
14
The following data represents the Tampa Buccaneers number of touchdowns per season, in 20 seasons. Make a stem-and-leaf display.
فتح الحزمة
افتح القفل للوصول البطاقات البالغ عددها 53 في هذه المجموعة.
فتح الحزمة
k this deck
15
Use the stem-and-leaf display to construct a frequency distribution with intervals 10-12, 13-15, ..., 25-27.
فتح الحزمة
افتح القفل للوصول البطاقات البالغ عددها 53 في هذه المجموعة.
فتح الحزمة
k this deck
16
The table below shows the fastest race lap in the F1 Grand Prix in Monza.
Make a stem-and-leaf display with a 2-digit stem.
Make a stem-and-leaf display with a 2-digit stem. فتح الحزمة
افتح القفل للوصول البطاقات البالغ عددها 53 في هذه المجموعة.
فتح الحزمة
k this deck
17
Calculate the mean and median of the following data set.
فتح الحزمة
افتح القفل للوصول البطاقات البالغ عددها 53 في هذه المجموعة.
فتح الحزمة
k this deck
18
Calculate the mean and median of the following data set. Round your answer to the nearest tenth.
A) 36.7 and 30, respectively
B) 36.7 and 32, respectively
C) 36.7 and 31, respectively
D) Mean: 36.7; there is no median
A) 36.7 and 30, respectively
B) 36.7 and 32, respectively
C) 36.7 and 31, respectively
D) Mean: 36.7; there is no median
فتح الحزمة
افتح القفل للوصول البطاقات البالغ عددها 53 في هذه المجموعة.
فتح الحزمة
k this deck
19
Calculate the mean and the median of the following data set.
فتح الحزمة
افتح القفل للوصول البطاقات البالغ عددها 53 في هذه المجموعة.
فتح الحزمة
k this deck
20
In a period of twelve years, the record low temperatures ( F) in Los Angeles CA were:
Find the dot diagram that corresponds to these data.
Find the dot diagram that corresponds to these data. فتح الحزمة
افتح القفل للوصول البطاقات البالغ عددها 53 في هذه المجموعة.
فتح الحزمة
k this deck
21
Calculate the quartiles of the following data set.
فتح الحزمة
افتح القفل للوصول البطاقات البالغ عددها 53 في هذه المجموعة.
فتح الحزمة
k this deck
22
Calculate the third quartile.
A) 26
B) 31
C) 25
D) 27
A) 26
B) 31
C) 25
D) 27
فتح الحزمة
افتح القفل للوصول البطاقات البالغ عددها 53 في هذه المجموعة.
فتح الحزمة
k this deck
23
The second quartile of a data set always corresponds to the median.
فتح الحزمة
افتح القفل للوصول البطاقات البالغ عددها 53 في هذه المجموعة.
فتح الحزمة
k this deck
24
The second quartile of a data set always corresponds to the mean.
فتح الحزمة
افتح القفل للوصول البطاقات البالغ عددها 53 في هذه المجموعة.
فتح الحزمة
k this deck
25
Find the 10th percentile.
A) 1.7
B) 1.8
C) 1.72
D) 1.75
A) 1.7
B) 1.8
C) 1.72
D) 1.75
فتح الحزمة
افتح القفل للوصول البطاقات البالغ عددها 53 في هذه المجموعة.
فتح الحزمة
k this deck
26
Find the interquartile range.
فتح الحزمة
افتح القفل للوصول البطاقات البالغ عددها 53 في هذه المجموعة.
فتح الحزمة
k this deck
27
The range is the difference between the largest observation and the smallest observation.
فتح الحزمة
افتح القفل للوصول البطاقات البالغ عددها 53 في هذه المجموعة.
فتح الحزمة
k this deck
28
For the data set 6 10 1
a) Calculate the deviations (X-X̄) . Round your answers to two decimal places.
b) Calculate the sample variance and the standard deviation.
a) Calculate the deviations (X-X̄) . Round your answers to two decimal places.
b) Calculate the sample variance and the standard deviation.
فتح الحزمة
افتح القفل للوصول البطاقات البالغ عددها 53 في هذه المجموعة.
فتح الحزمة
k this deck
29
For the data set
a) Calculate the deviations (X-X̄) and check to see that they add up to 0.
b) Calculate the sample variance and the standard deviation.
a) Calculate the deviations (X-X̄) and check to see that they add up to 0.
b) Calculate the sample variance and the standard deviation.
فتح الحزمة
افتح القفل للوصول البطاقات البالغ عددها 53 في هذه المجموعة.
فتح الحزمة
k this deck
30
For the data set
calculate s2 by using the alternative formula. Round your answer to the nearest tenth.
calculate s2 by using the alternative formula. Round your answer to the nearest tenth. فتح الحزمة
افتح القفل للوصول البطاقات البالغ عددها 53 في هذه المجموعة.
فتح الحزمة
k this deck
31
Find the variance of the following data set.
A) 1.4
B) 2.0
C) 1.7
D) 3.0
A) 1.4
B) 2.0
C) 1.7
D) 3.0
فتح الحزمة
افتح القفل للوصول البطاقات البالغ عددها 53 في هذه المجموعة.
فتح الحزمة
k this deck
32
Find the standard deviation of the following data set.
A) 56.0
B) 57.0
C) 49.5
D) 48.5
A) 56.0
B) 57.0
C) 49.5
D) 48.5
فتح الحزمة
افتح القفل للوصول البطاقات البالغ عددها 53 في هذه المجموعة.
فتح الحزمة
k this deck
33
A football fan recorded the total number of points scored by 5 teams during week 1.
a) Calculate the sample variance.
b) Calculate the sample standard deviation.
a) Calculate the sample variance.
b) Calculate the sample standard deviation.
فتح الحزمة
افتح القفل للوصول البطاقات البالغ عددها 53 في هذه المجموعة.
فتح الحزمة
k this deck
34
A report on the points gained by football teams playing at home in week 2 of the season are summarized below.
a) Calculate the sample variance.
b) Calculate the interquartile range.
a) Calculate the sample variance.
b) Calculate the interquartile range.
فتح الحزمة
افتح القفل للوصول البطاقات البالغ عددها 53 في هذه المجموعة.
فتح الحزمة
k this deck
35
According to the empirical guidelines for symmetric bell-shaped distributions, approximately 95% of the data lie within
فتح الحزمة
افتح القفل للوصول البطاقات البالغ عددها 53 في هذه المجموعة.
فتح الحزمة
k this deck
36
Refer to the data.
a) Calculate and s.
b) Find the proportion of the observations that are in the intervals , , and .
a) Calculate and s.
b) Find the proportion of the observations that are in the intervals , , and .
فتح الحزمة
افتح القفل للوصول البطاقات البالغ عددها 53 في هذه المجموعة.
فتح الحزمة
k this deck
37
Based on the boxplot,
complete the table.
complete the table. فتح الحزمة
افتح القفل للوصول البطاقات البالغ عددها 53 في هذه المجموعة.
فتح الحزمة
k this deck
38
During a recent season, the Orlando Magics basketball team won 59 games. The diference in points for 24 of these games is shown below. Find the time plot that corresponds to these data.
فتح الحزمة
افتح القفل للوصول البطاقات البالغ عددها 53 في هذه المجموعة.
فتح الحزمة
k this deck
39
During a recent regular season, the Orlando magics basketball team won 59 games. The difference of points in 24 of these games is shown below. Find the control chart that corresponds to these data.
I
II
I II فتح الحزمة
افتح القفل للوصول البطاقات البالغ عددها 53 في هذه المجموعة.
فتح الحزمة
k this deck
40
The number of bachelor's degrees earned in the United States, over
a recent 20-year period are given in the following table. The number is
presented in millions of degrees.
Select the time plot of the number of bachelor's degrees.
a recent 20-year period are given in the following table. The number is
presented in millions of degrees.
Select the time plot of the number of bachelor's degrees. فتح الحزمة
افتح القفل للوصول البطاقات البالغ عددها 53 في هذه المجموعة.
فتح الحزمة
k this deck
41
The stem-and-leaf display given here shows the final examination scores of students in a statistics course. (Leaf unit = 1.0)
a) Find the median score.
b) Find the quartiles Q1 and Q3.
c) What proportion of the students scored below 70? Round your answer to three decimal places.
a) Find the median score.b) Find the quartiles Q1 and Q3.
c) What proportion of the students scored below 70? Round your answer to three decimal places.
فتح الحزمة
افتح القفل للوصول البطاقات البالغ عددها 53 في هذه المجموعة.
فتح الحزمة
k this deck
42
If M is the mean of x1, x2, and x3, then the mean of 50x1, 50x2, and 50x3 is 50M.
فتح الحزمة
افتح القفل للوصول البطاقات البالغ عددها 53 في هذه المجموعة.
فتح الحزمة
k this deck
43
If M is the mean of x1, x2, and x3, then the mean of x1 + 3, x2 + 3, and x3 + 3 is M + 3.
فتح الحزمة
افتح القفل للوصول البطاقات البالغ عددها 53 في هذه المجموعة.
فتح الحزمة
k this deck
44
Let s1, s2, and s3 be the standard deviations of the bell-shaped graphs I, II, and III, respectively. Place them in increasing order.
A) S2 , S3 , S1
B) S1 , S3 , S2
C) S3 , S1 , S2
D) S2 , S1 , S3
A) S2 , S3 , S1
B) S1 , S3 , S2
C) S3 , S1 , S2
D) S2 , S1 , S3
فتح الحزمة
افتح القفل للوصول البطاقات البالغ عددها 53 في هذه المجموعة.
فتح الحزمة
k this deck
45
If the median of the following set of data is 11.1, find the value of x.
12.9 8.4 x 10.6
A) 10.6
B) 11.1
C) 11.6
D) Cannot be determined
12.9 8.4 x 10.6
A) 10.6
B) 11.1
C) 11.6
D) Cannot be determined
فتح الحزمة
افتح القفل للوصول البطاقات البالغ عددها 53 في هذه المجموعة.
فتح الحزمة
k this deck
46
The sum of all deviations equals ________.
فتح الحزمة
افتح القفل للوصول البطاقات البالغ عددها 53 في هذه المجموعة.
فتح الحزمة
k this deck
47
Since the median is not affected by a few very small or very large observations, the _______ is likely to be a more sensible measure of center than the ________.
فتح الحزمة
افتح القفل للوصول البطاقات البالغ عددها 53 في هذه المجموعة.
فتح الحزمة
k this deck
48
The table below shows the attendance to the Super Bowl for 14 years
a) Find the 10th percentile.
b) Find the interquartile range.
a) Find the 10th percentile.
b) Find the interquartile range.
فتح الحزمة
افتح القفل للوصول البطاقات البالغ عددها 53 في هذه المجموعة.
فتح الحزمة
k this deck
49
Three friends eat out together once a week and they split the bill so each pays x dollars. Because the same person always orders much more than the other two, they decide it is much fairer to each pay the median of the three meals. Is there anything wrong with this plan?
فتح الحزمة
افتح القفل للوصول البطاقات البالغ عددها 53 في هذه المجموعة.
فتح الحزمة
k this deck
50
Consider the data
6 4 8 4 3
concerning the number of visits by five students to a fast food establishment in the last 30 days,
Calculate the
(a) sample mean
(b) deviations x - x and check to see that they add up to 0.
(c) sample variance. Give the units of variance.
(d) sample standard deviation.
6 4 8 4 3
concerning the number of visits by five students to a fast food establishment in the last 30 days,
Calculate the
(a) sample mean
(b) deviations x - x and check to see that they add up to 0.
(c) sample variance. Give the units of variance.
(d) sample standard deviation.
فتح الحزمة
افتح القفل للوصول البطاقات البالغ عددها 53 في هذه المجموعة.
فتح الحزمة
k this deck
51
For the data concerning the number of chemistry class discussion sections skipped by 5 students last semester.
1 3 4 9 3
Calculate the
(a) sample mean
(b) deviations x- x and check to see that they add up to 0.
(c) sample variance. Give the units of variance.
(d) sample standard deviation.
1 3 4 9 3
Calculate the
(a) sample mean
(b) deviations x- x and check to see that they add up to 0.
(c) sample variance. Give the units of variance.
(d) sample standard deviation.
فتح الحزمة
افتح القفل للوصول البطاقات البالغ عددها 53 في هذه المجموعة.
فتح الحزمة
k this deck
52
Five students reported the number of canned/bottled beverages they consumed last week
3 7 3 11 1
Calculate the
(a) sample mean
(b) deviations x - x and check to see that they add up to 0.
(c) sample variance. Give the units of variance.
(d) sample standard deviation.
3 7 3 11 1
Calculate the
(a) sample mean
(b) deviations x - x and check to see that they add up to 0.
(c) sample variance. Give the units of variance.
(d) sample standard deviation.
فتح الحزمة
افتح القفل للوصول البطاقات البالغ عددها 53 في هذه المجموعة.
فتح الحزمة
k this deck
53
Consider the software summary of the data on the length of a wolf's Canine(mm).
n = 19
sd(x) = 1.969
(a) sample range
(b) sample interquartile range.
(c)
n = 19
sd(x) = 1.969
(a) sample range
(b) sample interquartile range.
(c)
فتح الحزمة
افتح القفل للوصول البطاقات البالغ عددها 53 في هذه المجموعة.
فتح الحزمة
k this deck
فتح الحزمة
افتح القفل للوصول البطاقات البالغ عددها 53 في هذه المجموعة.


