Deck 9: Aggregate Expenditures
ملء الشاشة (f)
سؤال
سؤال
سؤال
سؤال
سؤال
The figure given below represents the saving function of an economy.?Figure 9.1
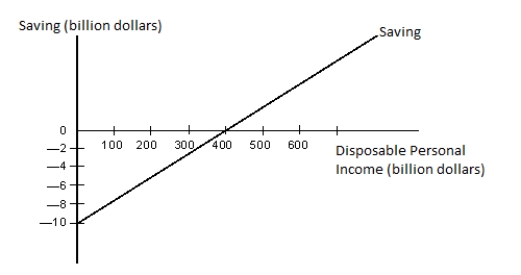
Refer to Figure 9.1. Which of the following statements is true for real GDP levels below $400 billion?
A) Saving exists because consumption is smaller than disposable income.
B) Saving does not exist because consumption exceeds disposable income.
C) The corresponding section of the consumption function lies below the 45-degree line.
D) Autonomous consumption is equal to zero.
E) The slope of the consumption function becomes negative.
سؤال
سؤال
سؤال
سؤال
سؤال
سؤال
سؤال
سؤال
سؤال
سؤال
سؤال
The figure given below represents the saving function of an economy.?Figure 9.1
Refer to Figure 9.1. An increase in autonomous consumption would be illustrated by:
A) an upward shift of the saving function.
B) a downward shift of the saving function.
C) a downward shift of the corresponding consumption function.
D) a movement to the right along the saving function.
E) a movement to the left along the saving function.
سؤال
سؤال
The figure given below represents the saving function of an economy.?Figure 9.1
Refer to Figure 9.1. At the real GDP level of $400 billion, which of the following statements is true?
A) There is dissaving.
B) Saving is equal to $10 billion.
C) Consumption is equal to disposable income.
D) The slope of the saving function is equal to zero.
E) The slope of the consumption function is equal to zero.
سؤال
سؤال
The figure given below represents the saving function of an economy.?Figure 9.1
Refer to Figure 9.1. When disposable income equals zero:
A) autonomous consumption equals zero.
B) the maximum amount of saving equals $10 billion.
C) autonomous income equals $10 billion.
D) autonomous consumption equals $10 billion.
E) consumption is negative.
Refer to Figure 9.1. When disposable income equals zero:
A) autonomous consumption equals zero.
B) the maximum amount of saving equals $10 billion.
C) autonomous income equals $10 billion.
D) autonomous consumption equals $10 billion.
E) consumption is negative.
سؤال
The figure given below represents the consumption function of a country.?Figure 9.3
According to Figure 9.3, autonomous consumption equals:
A) -$200.
B) $0.
C) $100.
D) $200.
E) $400.
According to Figure 9.3, autonomous consumption equals:
A) -$200.
B) $0.
C) $100.
D) $200.
E) $400.
سؤال
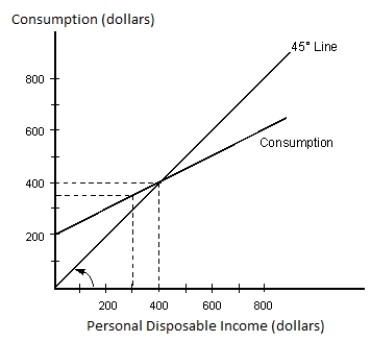
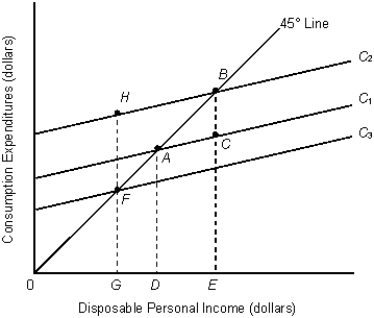
The figure given below shows the consumption function of a household.?Figure 9.2
In Figure 9.2, at any point to the left of point B:
A) autonomous consumption is less than zero.
B) saving occurs.
C) disposable income is negative
D) consumption is greater than disposable income.
E) autonomous consumption is zero.
In Figure 9.2, at any point to the left of point B:
A) autonomous consumption is less than zero.
B) saving occurs.
C) disposable income is negative
D) consumption is greater than disposable income.
E) autonomous consumption is zero.
سؤال
سؤال
The figure given below represents the consumption function of a country.?Figure 9.3
According to Figure 9.3, saving is zero when disposable income is _____.
A) $0
B) $400
C) $250
D) $800
E) $300
According to Figure 9.3, saving is zero when disposable income is _____.
A) $0
B) $400
C) $250
D) $800
E) $300
سؤال
سؤال
سؤال
The figure given below represents the consumption function of a country.?Figure 9.3
Refer to Figure 9.3. When disposable income is $800, consumption spending must equal:
A) $200.
B) $700.
C) $600.
D) $800.
E) $400.
Refer to Figure 9.3. When disposable income is $800, consumption spending must equal:
A) $200.
B) $700.
C) $600.
D) $800.
E) $400.
سؤال
سؤال
The figure given below shows the consumption function of a household.?Figure 9.2
In Figure 9.2, a decrease in disposable income would be illustrated by:
A) an upward shift of the consumption function.
B) a downward shift of the consumption function.
C) a leftward movement along the consumption function.
D) a rightward movement along the consumption function.
E) a movement from point A to point D.
سؤال
The figure given below shows the consumption function of a household.?Figure 9.2
In Figure 9.2, consumption equals disposable income:
A) at point A only.
B) at point B only.
C) at point C only.
D) at points A and C only.
E) at all points on the consumption function.
In Figure 9.2, consumption equals disposable income:
A) at point A only.
B) at point B only.
C) at point C only.
D) at points A and C only.
E) at all points on the consumption function.
سؤال
The figure given below represents the consumption function of a country.?Figure 9.3
Refer to Figure 9.3. We can infer that the marginal propensity to save would be _____.
A) 0.7
B) 0.1
C) 0.4
D) 0.25
E) 0.5
Refer to Figure 9.3. We can infer that the marginal propensity to save would be _____.
A) 0.7
B) 0.1
C) 0.4
D) 0.25
E) 0.5
سؤال
سؤال
The figure given below represents the consumption function of a country.?Figure 9.3
Refer to Figure 9.3. If the marginal propensity to consume is equal to 0.3, then:
A) autonomous consumption would decrease.
B) the total amount of dissaving would increase.
C) consumption spending would equal disposable income at an income level greater than $400.
D) consumption spending would equal disposable income at an income level less than $400.
E) consumption spending would equal disposable income at the income level of $400.
سؤال
The figure given below shows the consumption function of a household.?Figure 9.2
In Figure 9.2, an increase in autonomous consumption would be illustrated by:
A) a movement from point A to point D.
B) a movement from point A to point B.
C) an upward shift of the consumption function.
D) a downward shift of the consumption function.
E) a movement from point C to point B.
In Figure 9.2, an increase in autonomous consumption would be illustrated by:
A) a movement from point A to point D.
B) a movement from point A to point B.
C) an upward shift of the consumption function.
D) a downward shift of the consumption function.
E) a movement from point C to point B.
سؤال
The figure given below shows the consumption function of a household.?Figure 9.2
In Figure 9.2, the line segment AD represents:
A) autonomous consumption.
B) the maximum amount of saving.
C) negative consumption.
D) zero consumption.
E) autonomous expenditure.
In Figure 9.2, the line segment AD represents:
A) autonomous consumption.
B) the maximum amount of saving.
C) negative consumption.
D) zero consumption.
E) autonomous expenditure.
سؤال
The figure given below represents the consumption function of a country.?Figure 9.3
Refer to Figure 9.3. The savings function of the country will have a positive intercept at all income levels _____.
A) less than $200
B) greater than $200
C) less than $600
D) greater than $400
E) less than $800
Refer to Figure 9.3. The savings function of the country will have a positive intercept at all income levels _____.
A) less than $200
B) greater than $200
C) less than $600
D) greater than $400
E) less than $800
سؤال
سؤال
The figure given below represents the consumption function of a country.?Figure 9.3
Refer to Figure 9.3. Calculate the marginal propensity to consume.
A) 0.7
B) 0.1
C) 0.4
D) 0.25
E) 0.5
Refer to Figure 9.3. Calculate the marginal propensity to consume.
A) 0.7
B) 0.1
C) 0.4
D) 0.25
E) 0.5
سؤال
The table given below reports the consumption expenditure of a nation at different levels of disposable income.?
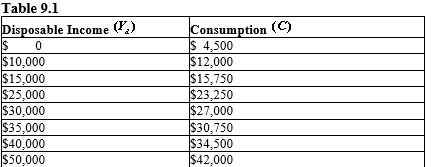
Refer to Table 9.1. Autonomous consumption expenditure in this nation will be equal to:
A) $10,000.
B) $5,500.
C) $4,500.
D) $3,000.
E) $4,000.
Refer to Table 9.1. Autonomous consumption expenditure in this nation will be equal to:
A) $10,000.
B) $5,500.
C) $4,500.
D) $3,000.
E) $4,000.
سؤال
سؤال
سؤال
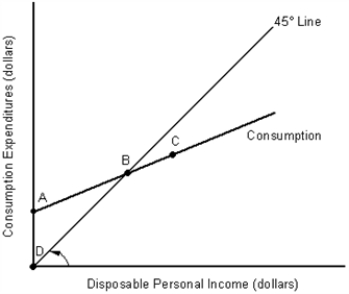
The figure given below shows the consumption functions of an economy.?Figure 9.4
Refer to Figure 9.4. The shift of the consumption function from C₁ to C₂ has caused autonomous saving to:
A) decrease by the distance between H and B.
B) increase by the distance between C and B.
C) decrease by the distance between C and B.
D) increase by the distance between H and G.
E) decrease by the distance between D and E.
سؤال
سؤال
The table given below reports the consumption expenditure of a nation at different levels of disposable income.?
Refer to Table 9.1. At an income level of $10,000, the APS equals -0.20. Therefore, the APC has to be equal to:
A) 0.20.
B) 0.80.
C) -1.20.
D) 1.20.
E) 1.80.
Refer to Table 9.1. At an income level of $10,000, the APS equals -0.20. Therefore, the APC has to be equal to:
A) 0.20.
B) 0.80.
C) -1.20.
D) 1.20.
E) 1.80.
سؤال
سؤال
سؤال
سؤال
The figure given below shows the consumption functions of an economy.?Figure 9.4
Refer to Figure 9.4. Which of the following could explain a downward shift of the consumption function from C₁ to C₃?
A) An increase in household wealth
B) A decrease in the proportion of young people in the population
C) An increase in the size of the population
D) A decrease in consumer confidence
E) An autonomous decrease in saving
سؤال
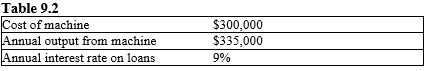
Refer to Table 9.2. If a firm purchases the machine by taking out a one-year loan, how much interest will the firm have to pay?
A) $301,500
B) $30,150
C) $270,000
D) $27,000
E) $9,000
سؤال
The figure given below shows the consumption functions of an economy.?Figure 9.4
Refer to the Figure 9.4. If the economy is in equilibrium at A, which of the following is most likely to occur if consumers expect a period of rapid economic expansion?
A) The equilibrium will move from point A to point F.
B) The equilibrium will move from point A to point C.
C) There will be a new equilibrium disposable income at point G.
D) The equilibrium will remain at point A.
E) There will be a new equilibrium disposable income at point E.
سؤال
The table given below reports the consumption expenditure of a nation at different levels of disposable income.?
Refer to Table 9.1. At an income level of $45,000, the average propensity to save would be equal to:
A) 0.15.
B) 0.75.
C) 0.25.
D) 0.20.
E) 0.80.
Refer to Table 9.1. At an income level of $45,000, the average propensity to save would be equal to:
A) 0.15.
B) 0.75.
C) 0.25.
D) 0.20.
E) 0.80.
سؤال
سؤال
سؤال
سؤال
The table given below reports the consumption expenditure of a nation at different levels of disposable income.?
Refer to Table 9.1. The income level of $18,000 coincides with:
A) the origin of the graph.
B) the point where the consumption function touches the vertical axis.
C) the point where the MPC equals 1.00.
D) the point where the APC equals 1.00.
E) the point where the consumption function crosses the 45-degree line.
سؤال
سؤال
The table given below reports the consumption expenditure of a nation at different levels of disposable income.?
Refer to Table 9.1. When disposable income is $20,000, consumption spending equals:
A) $24,500.
B) $15,000.
C) $18,500.
D) $19,500.
E) $18,000.
Refer to Table 9.1. When disposable income is $20,000, consumption spending equals:
A) $24,500.
B) $15,000.
C) $18,500.
D) $19,500.
E) $18,000.
سؤال
سؤال
سؤال
سؤال
سؤال
سؤال
In the table given below Y represents the aggregate expenditure of the economy on C = consumption, I = investment, G = government projects, and X = net exports.?
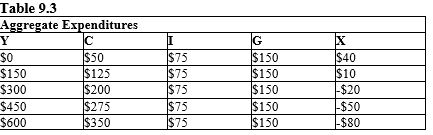
Refer to Table 9.3. Compute the marginal propensity to save in the economy.
A) 0.10
B) 0.20
C) 0.25
D) 0.50
E) 0.75
Refer to Table 9.3. Compute the marginal propensity to save in the economy.
A) 0.10
B) 0.20
C) 0.25
D) 0.50
E) 0.75
سؤال
سؤال
Refer to Table 9.2. If a firm purchases the machine by taking out a one-year loan, what is the firm's profit from the investment?
A) $25,500
B) $35,000
C) $8,000
D) $0
E) $6,525
سؤال
سؤال
سؤال
سؤال
سؤال
سؤال
سؤال
In the table given below Y represents the aggregate expenditure of the economy on C = consumption, I = investment, G = government projects, and X = net exports.?
Refer to Table 9.3. Calculate the marginal propensity to consume in the economy.
A) 0.25
B) 0.50
C) 0.75
D) 0.80
E) 1.25
Refer to Table 9.3. Calculate the marginal propensity to consume in the economy.
A) 0.25
B) 0.50
C) 0.75
D) 0.80
E) 1.25
سؤال
سؤال
سؤال
سؤال
سؤال
Refer to Table 9.2. If a firm purchases the machine by taking out a one-year loan, what happens to the firm's rate of return on the investment if the interest rate increases to 10 percent?
A) It increases to 1.5 percent
B) It increases to 0.15 percent
C) It decreases to 1.5 percent
D) It decreases to 1.7 percent
E) It decreases to 0.17 percent
سؤال
سؤال
سؤال

فتح الحزمة
قم بالتسجيل لفتح البطاقات في هذه المجموعة!
Unlock Deck
Unlock Deck
1/120
العب
ملء الشاشة (f)
Deck 9: Aggregate Expenditures
1
Dissaving occurs when:
A) disposable income is greater than consumption.
B) consumption is greater than disposable income.
C) consumption is equal to disposable income.
D) consumption is greater than personal income.
E) consumption is less than personal income.
A) disposable income is greater than consumption.
B) consumption is greater than disposable income.
C) consumption is equal to disposable income.
D) consumption is greater than personal income.
E) consumption is less than personal income.
consumption is greater than disposable income.
2
Which of the following is a stock variable?
A) Government spending
B) Investment
C) Daily household consumption
D) Saving
E) Wealth
A) Government spending
B) Investment
C) Daily household consumption
D) Saving
E) Wealth
Wealth
3
Identify the correct statement with respect to consumption and saving function.
A) Both the consumption function and the saving function have negative slopes.
B) As disposable income declines, consumption and saving increase.
C) The consumption function has a negative slope while the saving function has a positive slope.
D) As disposable income rises, consumption and saving increases.
E) The consumption function has a positive slope while the saving function has a negative slope.
As disposable income rises, consumption and saving increases.
4
Autonomous consumption is defined as:
A) the level of consumption that depends only on the exchange rate.
B) the consumption expenditures incurred by the government.
C) the level of consumption that does not depend on income.
D) an equilibrium condition that needs to be met for the aggregate expenditure model to work.
E) the part of consumption that is related to investment.
فتح الحزمة
افتح القفل للوصول البطاقات البالغ عددها 120 في هذه المجموعة.
فتح الحزمة
k this deck
5
The figure given below represents the saving function of an economy.?Figure 9.1
Refer to Figure 9.1. Which of the following statements is true for real GDP levels below $400 billion?
A) Saving exists because consumption is smaller than disposable income.
B) Saving does not exist because consumption exceeds disposable income.
C) The corresponding section of the consumption function lies below the 45-degree line.
D) Autonomous consumption is equal to zero.
E) The slope of the consumption function becomes negative.
فتح الحزمة
افتح القفل للوصول البطاقات البالغ عددها 120 في هذه المجموعة.
فتح الحزمة
k this deck
6
The sum of consumption and saving is called _____.
A) net investment
B) net income
C) personal income
D) disposable income
E) transfer payment
A) net investment
B) net income
C) personal income
D) disposable income
E) transfer payment
فتح الحزمة
افتح القفل للوصول البطاقات البالغ عددها 120 في هذه المجموعة.
فتح الحزمة
k this deck
7
The consumption function illustrates that:
A) saving increases as disposable income decreases.
B) consumption increases as saving increases.
C) consumption increases as disposable income increases.
D) consumption increases as disposable income decreases.
E) consumption increases as investment increases.
A) saving increases as disposable income decreases.
B) consumption increases as saving increases.
C) consumption increases as disposable income increases.
D) consumption increases as disposable income decreases.
E) consumption increases as investment increases.
فتح الحزمة
افتح القفل للوصول البطاقات البالغ عددها 120 في هذه المجموعة.
فتح الحزمة
k this deck
8
Which of the following variables is a flow concept?
A) Gross domestic product
B) Assets
C) Wealth
D) Money supply
E) Saving
A) Gross domestic product
B) Assets
C) Wealth
D) Money supply
E) Saving
فتح الحزمة
افتح القفل للوصول البطاقات البالغ عددها 120 في هذه المجموعة.
فتح الحزمة
k this deck
9
The part of the disposable income that is not consumed by households is:
A) given away in the form of taxes.
B) given away as charity.
C) saved.
D) deducted as a depreciation cost.
E) spent on imports.
A) given away in the form of taxes.
B) given away as charity.
C) saved.
D) deducted as a depreciation cost.
E) spent on imports.
فتح الحزمة
افتح القفل للوصول البطاقات البالغ عددها 120 في هذه المجموعة.
فتح الحزمة
k this deck
10
The income net of taxes is called _____.
A) real income
B) disposable income
C) nominal income
D) taxable income
E) personal income
A) real income
B) disposable income
C) nominal income
D) taxable income
E) personal income
فتح الحزمة
افتح القفل للوصول البطاقات البالغ عددها 120 في هذه المجموعة.
فتح الحزمة
k this deck
11
Identify the correct statement.
A) Autonomous consumption equals saving when disposable income is equal to zero.
B) Saving is equal to consumption when autonomous consumption is zero.
C) The savings function always has a positive intercept when autonomous consumption is positive.
D) The consumption and saving function intersect each other when disposable income is zero.
E) Autonomous consumption is positive even when disposable income is zero.
فتح الحزمة
افتح القفل للوصول البطاقات البالغ عددها 120 في هذه المجموعة.
فتح الحزمة
k this deck
12
The 45-degree line used in a consumption function represents:
A) the saving function.
B) all points at which saving equals disposable income.
C) all points at which consumption equals saving.
D) all points at which all disposable income is consumed.
E) the aggregate income of the economy.
A) the saving function.
B) all points at which saving equals disposable income.
C) all points at which consumption equals saving.
D) all points at which all disposable income is consumed.
E) the aggregate income of the economy.
فتح الحزمة
افتح القفل للوصول البطاقات البالغ عددها 120 في هذه المجموعة.
فتح الحزمة
k this deck
13
Keynesian economics developed in response to:
A) the Great Depression of the 1930s.
B) the inflation following World War II.
C) economic growth during the 1950s.
D) the Vietnam War.
E) the oil embargo in the 1970s.
A) the Great Depression of the 1930s.
B) the inflation following World War II.
C) economic growth during the 1950s.
D) the Vietnam War.
E) the oil embargo in the 1970s.
فتح الحزمة
افتح القفل للوصول البطاقات البالغ عددها 120 في هذه المجموعة.
فتح الحزمة
k this deck
14
Suppose two successive levels of disposable personal income are $16 and $21 billion, respectively, and the change in consumption spending between these two levels of disposable personal income is $2 billion, then the MPC will be equal to _____.
A) 0.12
B) 0.8
C) 0.7
D) 0.4
E) 0.04
A) 0.12
B) 0.8
C) 0.7
D) 0.4
E) 0.04
فتح الحزمة
افتح القفل للوصول البطاقات البالغ عددها 120 في هذه المجموعة.
فتح الحزمة
k this deck
15
The amount of autonomous consumption in an economy is measured by the:
A) the intercept of the consumption function when disposable income is positive.
B) the intercept of the consumption function where actual consumption is above the 45-degree line.
C) the intercept of the consumption function when disposable income is zero.
D) the intercept of the consumption function where actual consumption is below the 45-degree line.
E) the intercept of the consumption function when disposable income is negative.
فتح الحزمة
افتح القفل للوصول البطاقات البالغ عددها 120 في هذه المجموعة.
فتح الحزمة
k this deck
16
The figure given below represents the saving function of an economy.?Figure 9.1
Refer to Figure 9.1. An increase in autonomous consumption would be illustrated by:
A) an upward shift of the saving function.
B) a downward shift of the saving function.
C) a downward shift of the corresponding consumption function.
D) a movement to the right along the saving function.
E) a movement to the left along the saving function.
فتح الحزمة
افتح القفل للوصول البطاقات البالغ عددها 120 في هذه المجموعة.
فتح الحزمة
k this deck
17
A key assumption of the Keynesian model of macroeconomics is a fixed _____.
A) interest rate
B) price level
C) exchange rate
D) growth rate
E) unemployment level
A) interest rate
B) price level
C) exchange rate
D) growth rate
E) unemployment level
فتح الحزمة
افتح القفل للوصول البطاقات البالغ عددها 120 في هذه المجموعة.
فتح الحزمة
k this deck
18
The figure given below represents the saving function of an economy.?Figure 9.1
Refer to Figure 9.1. At the real GDP level of $400 billion, which of the following statements is true?
A) There is dissaving.
B) Saving is equal to $10 billion.
C) Consumption is equal to disposable income.
D) The slope of the saving function is equal to zero.
E) The slope of the consumption function is equal to zero.
فتح الحزمة
افتح القفل للوصول البطاقات البالغ عددها 120 في هذه المجموعة.
فتح الحزمة
k this deck
19
In the country of Marzipana, total consumption in Year 1 was $56,000 million and in Year 2 was $60,000 million. It has been observed that each time disposable income changes in this country by $100, consumption changes by $70. Using this information compute the change in disposable income from Year 1 to Year 2.
A) Disposable income increased by $2,800 million in Year 2.
B) Disposable income decreased by $2,000 million in Year 2.
C) Disposable income increased by $2,000 million in Year 2.
D) Disposable income increased by $4,500 million in Year 2.
E) Disposable income decreased by $2,600 million in Year 2.
A) Disposable income increased by $2,800 million in Year 2.
B) Disposable income decreased by $2,000 million in Year 2.
C) Disposable income increased by $2,000 million in Year 2.
D) Disposable income increased by $4,500 million in Year 2.
E) Disposable income decreased by $2,600 million in Year 2.
فتح الحزمة
افتح القفل للوصول البطاقات البالغ عددها 120 في هذه المجموعة.
فتح الحزمة
k this deck
20
The figure given below represents the saving function of an economy.?Figure 9.1
Refer to Figure 9.1. When disposable income equals zero:
A) autonomous consumption equals zero.
B) the maximum amount of saving equals $10 billion.
C) autonomous income equals $10 billion.
D) autonomous consumption equals $10 billion.
E) consumption is negative.
Refer to Figure 9.1. When disposable income equals zero:
A) autonomous consumption equals zero.
B) the maximum amount of saving equals $10 billion.
C) autonomous income equals $10 billion.
D) autonomous consumption equals $10 billion.
E) consumption is negative.
فتح الحزمة
افتح القفل للوصول البطاقات البالغ عددها 120 في هذه المجموعة.
فتح الحزمة
k this deck
21
The figure given below represents the consumption function of a country.?Figure 9.3
According to Figure 9.3, autonomous consumption equals:
A) -$200.
B) $0.
C) $100.
D) $200.
E) $400.
According to Figure 9.3, autonomous consumption equals:
A) -$200.
B) $0.
C) $100.
D) $200.
E) $400.
فتح الحزمة
افتح القفل للوصول البطاقات البالغ عددها 120 في هذه المجموعة.
فتح الحزمة
k this deck
22
The figure given below shows the consumption function of a household.?Figure 9.2
In Figure 9.2, at any point to the left of point B:
A) autonomous consumption is less than zero.
B) saving occurs.
C) disposable income is negative
D) consumption is greater than disposable income.
E) autonomous consumption is zero.
In Figure 9.2, at any point to the left of point B:
A) autonomous consumption is less than zero.
B) saving occurs.
C) disposable income is negative
D) consumption is greater than disposable income.
E) autonomous consumption is zero.
فتح الحزمة
افتح القفل للوصول البطاقات البالغ عددها 120 في هذه المجموعة.
فتح الحزمة
k this deck
23
A change in the marginal propensity to save can be graphically represented by:
A) a movement along the investment function.
B) a movement along the saving function.
C) a parallel shift of the consumption function.
D) a parallel shift of the saving function.
E) a change in the slope of the saving function.
A) a movement along the investment function.
B) a movement along the saving function.
C) a parallel shift of the consumption function.
D) a parallel shift of the saving function.
E) a change in the slope of the saving function.
فتح الحزمة
افتح القفل للوصول البطاقات البالغ عددها 120 في هذه المجموعة.
فتح الحزمة
k this deck
24
The figure given below represents the consumption function of a country.?Figure 9.3
According to Figure 9.3, saving is zero when disposable income is _____.
A) $0
B) $400
C) $250
D) $800
E) $300
According to Figure 9.3, saving is zero when disposable income is _____.
A) $0
B) $400
C) $250
D) $800
E) $300
فتح الحزمة
افتح القفل للوصول البطاقات البالغ عددها 120 في هذه المجموعة.
فتح الحزمة
k this deck
25
If a household's disposable income increases from $50,000 to $100,000 and its consumption increases from $40,000 to $80,000, the MPS must be _____.
A) 0.4
B) 0.8
C) 0.7
D) 0.2
E) 0.5
A) 0.4
B) 0.8
C) 0.7
D) 0.2
E) 0.5
فتح الحزمة
افتح القفل للوصول البطاقات البالغ عددها 120 في هذه المجموعة.
فتح الحزمة
k this deck
26
Suppose total disposable income in Country X rises by $500 billion while total consumption rises by $50 billion. What would be the slope of the consumption function for this nation?
A) 1
B) 0.1
C) 0.5
D) 0.25
E) 0.4
A) 1
B) 0.1
C) 0.5
D) 0.25
E) 0.4
فتح الحزمة
افتح القفل للوصول البطاقات البالغ عددها 120 في هذه المجموعة.
فتح الحزمة
k this deck
27
The figure given below represents the consumption function of a country.?Figure 9.3
Refer to Figure 9.3. When disposable income is $800, consumption spending must equal:
A) $200.
B) $700.
C) $600.
D) $800.
E) $400.
Refer to Figure 9.3. When disposable income is $800, consumption spending must equal:
A) $200.
B) $700.
C) $600.
D) $800.
E) $400.
فتح الحزمة
افتح القفل للوصول البطاقات البالغ عددها 120 في هذه المجموعة.
فتح الحزمة
k this deck
28
The consumption function becomes flatter if:
A) the average propensity to spend increases.
B) the marginal propensity to spend increases.
C) the marginal propensity to save increases.
D) the autonomous consumption increases.
E) the autonomous consumption decreases.
A) the average propensity to spend increases.
B) the marginal propensity to spend increases.
C) the marginal propensity to save increases.
D) the autonomous consumption increases.
E) the autonomous consumption decreases.
فتح الحزمة
افتح القفل للوصول البطاقات البالغ عددها 120 في هذه المجموعة.
فتح الحزمة
k this deck
29
The figure given below shows the consumption function of a household.?Figure 9.2
In Figure 9.2, a decrease in disposable income would be illustrated by:
A) an upward shift of the consumption function.
B) a downward shift of the consumption function.
C) a leftward movement along the consumption function.
D) a rightward movement along the consumption function.
E) a movement from point A to point D.
فتح الحزمة
افتح القفل للوصول البطاقات البالغ عددها 120 في هذه المجموعة.
فتح الحزمة
k this deck
30
The figure given below shows the consumption function of a household.?Figure 9.2
In Figure 9.2, consumption equals disposable income:
A) at point A only.
B) at point B only.
C) at point C only.
D) at points A and C only.
E) at all points on the consumption function.
In Figure 9.2, consumption equals disposable income:
A) at point A only.
B) at point B only.
C) at point C only.
D) at points A and C only.
E) at all points on the consumption function.
فتح الحزمة
افتح القفل للوصول البطاقات البالغ عددها 120 في هذه المجموعة.
فتح الحزمة
k this deck
31
The figure given below represents the consumption function of a country.?Figure 9.3
Refer to Figure 9.3. We can infer that the marginal propensity to save would be _____.
A) 0.7
B) 0.1
C) 0.4
D) 0.25
E) 0.5
Refer to Figure 9.3. We can infer that the marginal propensity to save would be _____.
A) 0.7
B) 0.1
C) 0.4
D) 0.25
E) 0.5
فتح الحزمة
افتح القفل للوصول البطاقات البالغ عددها 120 في هذه المجموعة.
فتح الحزمة
k this deck
32
The sum of the MPC and the MPS is always:
A) greater than 1.
B) less than 1.
C) equal to 1.
D) equal to zero.
E) between 0 and 1.
A) greater than 1.
B) less than 1.
C) equal to 1.
D) equal to zero.
E) between 0 and 1.
فتح الحزمة
افتح القفل للوصول البطاقات البالغ عددها 120 في هذه المجموعة.
فتح الحزمة
k this deck
33
The figure given below represents the consumption function of a country.?Figure 9.3
Refer to Figure 9.3. If the marginal propensity to consume is equal to 0.3, then:
A) autonomous consumption would decrease.
B) the total amount of dissaving would increase.
C) consumption spending would equal disposable income at an income level greater than $400.
D) consumption spending would equal disposable income at an income level less than $400.
E) consumption spending would equal disposable income at the income level of $400.
فتح الحزمة
افتح القفل للوصول البطاقات البالغ عددها 120 في هذه المجموعة.
فتح الحزمة
k this deck
34
The figure given below shows the consumption function of a household.?Figure 9.2
In Figure 9.2, an increase in autonomous consumption would be illustrated by:
A) a movement from point A to point D.
B) a movement from point A to point B.
C) an upward shift of the consumption function.
D) a downward shift of the consumption function.
E) a movement from point C to point B.
In Figure 9.2, an increase in autonomous consumption would be illustrated by:
A) a movement from point A to point D.
B) a movement from point A to point B.
C) an upward shift of the consumption function.
D) a downward shift of the consumption function.
E) a movement from point C to point B.
فتح الحزمة
افتح القفل للوصول البطاقات البالغ عددها 120 في هذه المجموعة.
فتح الحزمة
k this deck
35
The figure given below shows the consumption function of a household.?Figure 9.2
In Figure 9.2, the line segment AD represents:
A) autonomous consumption.
B) the maximum amount of saving.
C) negative consumption.
D) zero consumption.
E) autonomous expenditure.
In Figure 9.2, the line segment AD represents:
A) autonomous consumption.
B) the maximum amount of saving.
C) negative consumption.
D) zero consumption.
E) autonomous expenditure.
فتح الحزمة
افتح القفل للوصول البطاقات البالغ عددها 120 في هذه المجموعة.
فتح الحزمة
k this deck
36
The figure given below represents the consumption function of a country.?Figure 9.3
Refer to Figure 9.3. The savings function of the country will have a positive intercept at all income levels _____.
A) less than $200
B) greater than $200
C) less than $600
D) greater than $400
E) less than $800
Refer to Figure 9.3. The savings function of the country will have a positive intercept at all income levels _____.
A) less than $200
B) greater than $200
C) less than $600
D) greater than $400
E) less than $800
فتح الحزمة
افتح القفل للوصول البطاقات البالغ عددها 120 في هذه المجموعة.
فتح الحزمة
k this deck
37
As disposable income rises:
A) consumption falls, but not by as much as the disposable income rises.
B) the average propensity to consume increases.
C) saving falls as a percentage of disposable income.
D) the average propensity to consume remains unchanged.
E) saving rises as a percentage of disposable income.
A) consumption falls, but not by as much as the disposable income rises.
B) the average propensity to consume increases.
C) saving falls as a percentage of disposable income.
D) the average propensity to consume remains unchanged.
E) saving rises as a percentage of disposable income.
فتح الحزمة
افتح القفل للوصول البطاقات البالغ عددها 120 في هذه المجموعة.
فتح الحزمة
k this deck
38
The figure given below represents the consumption function of a country.?Figure 9.3
Refer to Figure 9.3. Calculate the marginal propensity to consume.
A) 0.7
B) 0.1
C) 0.4
D) 0.25
E) 0.5
Refer to Figure 9.3. Calculate the marginal propensity to consume.
A) 0.7
B) 0.1
C) 0.4
D) 0.25
E) 0.5
فتح الحزمة
افتح القفل للوصول البطاقات البالغ عددها 120 في هذه المجموعة.
فتح الحزمة
k this deck
39
The table given below reports the consumption expenditure of a nation at different levels of disposable income.?
Refer to Table 9.1. Autonomous consumption expenditure in this nation will be equal to:
A) $10,000.
B) $5,500.
C) $4,500.
D) $3,000.
E) $4,000.
Refer to Table 9.1. Autonomous consumption expenditure in this nation will be equal to:
A) $10,000.
B) $5,500.
C) $4,500.
D) $3,000.
E) $4,000.
فتح الحزمة
افتح القفل للوصول البطاقات البالغ عددها 120 في هذه المجموعة.
فتح الحزمة
k this deck
40
If a household experiences a $880 increase in consumption with a $1,100 increase in disposable income, what is the slope of that household's saving function?
A) 0.20
B) 2.0
C) 0.80
D) 0.08
E) 0.25
A) 0.20
B) 2.0
C) 0.80
D) 0.08
E) 0.25
فتح الحزمة
افتح القفل للوصول البطاقات البالغ عددها 120 في هذه المجموعة.
فتح الحزمة
k this deck
41
_____ is the primary determinant of consumption and is usually measured in terms of current disposable income.
A) Household income
B) Wealth
C) Expectation
D) Interest rate
E) Tax liability
A) Household income
B) Wealth
C) Expectation
D) Interest rate
E) Tax liability
فتح الحزمة
افتح القفل للوصول البطاقات البالغ عددها 120 في هذه المجموعة.
فتح الحزمة
k this deck
42
The figure given below shows the consumption functions of an economy.?Figure 9.4
Refer to Figure 9.4. The shift of the consumption function from C₁ to C₂ has caused autonomous saving to:
A) decrease by the distance between H and B.
B) increase by the distance between C and B.
C) decrease by the distance between C and B.
D) increase by the distance between H and G.
E) decrease by the distance between D and E.
فتح الحزمة
افتح القفل للوصول البطاقات البالغ عددها 120 في هذه المجموعة.
فتح الحزمة
k this deck
43
A change in consumption caused by a change in disposable income is shown by:
A) a movement along the consumption function.
B) a rightward shift of the consumption function.
C) a change in the slope of the consumption function.
D) a leftward shift of the consumption function.
E) the point where the consumption function touches the 45 degree line.
A) a movement along the consumption function.
B) a rightward shift of the consumption function.
C) a change in the slope of the consumption function.
D) a leftward shift of the consumption function.
E) the point where the consumption function touches the 45 degree line.
فتح الحزمة
افتح القفل للوصول البطاقات البالغ عددها 120 في هذه المجموعة.
فتح الحزمة
k this deck
44
The table given below reports the consumption expenditure of a nation at different levels of disposable income.?
Refer to Table 9.1. At an income level of $10,000, the APS equals -0.20. Therefore, the APC has to be equal to:
A) 0.20.
B) 0.80.
C) -1.20.
D) 1.20.
E) 1.80.
Refer to Table 9.1. At an income level of $10,000, the APS equals -0.20. Therefore, the APC has to be equal to:
A) 0.20.
B) 0.80.
C) -1.20.
D) 1.20.
E) 1.80.
فتح الحزمة
افتح القفل للوصول البطاقات البالغ عددها 120 في هذه المجموعة.
فتح الحزمة
k this deck
45
If it is assumed that there are absolutely no taxes in an economy, then aggregate consumption will be drawn as a function of:
A) disposable income.
B) real GDP.
C) government expenditure.
D) private income.
E) government transfers.
A) disposable income.
B) real GDP.
C) government expenditure.
D) private income.
E) government transfers.
فتح الحزمة
افتح القفل للوصول البطاقات البالغ عددها 120 في هذه المجموعة.
فتح الحزمة
k this deck
46
Which of the following is true of long-run consumption functions?
A) Autonomous consumption is equal to zero in the long-run.
B) The long run consumption functions are steeper than short run consumption functions.
C) The marginal propensity to consume for the long run consumption function is almost equal to zero.
D) The autonomous consumption is negative in long run consumption functions.
E) The long run consumption function is represented by a straight line parallel to the horizontal axis.
فتح الحزمة
افتح القفل للوصول البطاقات البالغ عددها 120 في هذه المجموعة.
فتح الحزمة
k this deck
47
Which of the following is a determinant of investment?
A) Technological change
B) Net exports
C) Demographics
D) Nominal GDP
E) Population
A) Technological change
B) Net exports
C) Demographics
D) Nominal GDP
E) Population
فتح الحزمة
افتح القفل للوصول البطاقات البالغ عددها 120 في هذه المجموعة.
فتح الحزمة
k this deck
48
The figure given below shows the consumption functions of an economy.?Figure 9.4
Refer to Figure 9.4. Which of the following could explain a downward shift of the consumption function from C₁ to C₃?
A) An increase in household wealth
B) A decrease in the proportion of young people in the population
C) An increase in the size of the population
D) A decrease in consumer confidence
E) An autonomous decrease in saving
فتح الحزمة
افتح القفل للوصول البطاقات البالغ عددها 120 في هذه المجموعة.
فتح الحزمة
k this deck
49
Refer to Table 9.2. If a firm purchases the machine by taking out a one-year loan, how much interest will the firm have to pay?
A) $301,500
B) $30,150
C) $270,000
D) $27,000
E) $9,000
فتح الحزمة
افتح القفل للوصول البطاقات البالغ عددها 120 في هذه المجموعة.
فتح الحزمة
k this deck
50
The figure given below shows the consumption functions of an economy.?Figure 9.4
Refer to the Figure 9.4. If the economy is in equilibrium at A, which of the following is most likely to occur if consumers expect a period of rapid economic expansion?
A) The equilibrium will move from point A to point F.
B) The equilibrium will move from point A to point C.
C) There will be a new equilibrium disposable income at point G.
D) The equilibrium will remain at point A.
E) There will be a new equilibrium disposable income at point E.
فتح الحزمة
افتح القفل للوصول البطاقات البالغ عددها 120 في هذه المجموعة.
فتح الحزمة
k this deck
51
The table given below reports the consumption expenditure of a nation at different levels of disposable income.?
Refer to Table 9.1. At an income level of $45,000, the average propensity to save would be equal to:
A) 0.15.
B) 0.75.
C) 0.25.
D) 0.20.
E) 0.80.
Refer to Table 9.1. At an income level of $45,000, the average propensity to save would be equal to:
A) 0.15.
B) 0.75.
C) 0.25.
D) 0.20.
E) 0.80.
فتح الحزمة
افتح القفل للوصول البطاقات البالغ عددها 120 في هذه المجموعة.
فتح الحزمة
k this deck
52
When we assume that investment is autonomous we imply that:
A) it is a fixed constant amount.
B) it is independent of current real GDP.
C) it is a positive function of interest rates.
D) it is actually zero.
E) it has no impact on consumption.
A) it is a fixed constant amount.
B) it is independent of current real GDP.
C) it is a positive function of interest rates.
D) it is actually zero.
E) it has no impact on consumption.
فتح الحزمة
افتح القفل للوصول البطاقات البالغ عددها 120 في هذه المجموعة.
فتح الحزمة
k this deck
53
As an household's wealth increases, it will experience a(n):
A) increase in its MPC.
B) decrease in autonomous consumption.
C) decrease in its MPS.
D) increase in autonomous consumption.
E) increase in autonomous saving.
A) increase in its MPC.
B) decrease in autonomous consumption.
C) decrease in its MPS.
D) increase in autonomous consumption.
E) increase in autonomous saving.
فتح الحزمة
افتح القفل للوصول البطاقات البالغ عددها 120 في هذه المجموعة.
فتح الحزمة
k this deck
54
Any increase in autonomous consumption is associated with:
A) an equivalent increase in autonomous saving.
B) an equivalent decrease in autonomous saving.
C) an equivalent increase in the slope of the saving function.
D) an equivalent decrease in the slope of the consumption function.
E) an equivalent movement along the consumption function.
A) an equivalent increase in autonomous saving.
B) an equivalent decrease in autonomous saving.
C) an equivalent increase in the slope of the saving function.
D) an equivalent decrease in the slope of the consumption function.
E) an equivalent movement along the consumption function.
فتح الحزمة
افتح القفل للوصول البطاقات البالغ عددها 120 في هذه المجموعة.
فتح الحزمة
k this deck
55
The table given below reports the consumption expenditure of a nation at different levels of disposable income.?
Refer to Table 9.1. The income level of $18,000 coincides with:
A) the origin of the graph.
B) the point where the consumption function touches the vertical axis.
C) the point where the MPC equals 1.00.
D) the point where the APC equals 1.00.
E) the point where the consumption function crosses the 45-degree line.
فتح الحزمة
افتح القفل للوصول البطاقات البالغ عددها 120 في هذه المجموعة.
فتح الحزمة
k this deck
56
Which of the following variables do not change autonomous consumption?
A) Demographics
B) Taxation
C) Expectation
D) Wealth
E) Disposable income
A) Demographics
B) Taxation
C) Expectation
D) Wealth
E) Disposable income
فتح الحزمة
افتح القفل للوصول البطاقات البالغ عددها 120 في هذه المجموعة.
فتح الحزمة
k this deck
57
The table given below reports the consumption expenditure of a nation at different levels of disposable income.?
Refer to Table 9.1. When disposable income is $20,000, consumption spending equals:
A) $24,500.
B) $15,000.
C) $18,500.
D) $19,500.
E) $18,000.
Refer to Table 9.1. When disposable income is $20,000, consumption spending equals:
A) $24,500.
B) $15,000.
C) $18,500.
D) $19,500.
E) $18,000.
فتح الحزمة
افتح القفل للوصول البطاقات البالغ عددها 120 في هذه المجموعة.
فتح الحزمة
k this deck
58
Which of the following statements concerning the effects of demographics on consumption is not true?
A) The size of the population affects the slope of the consumption function.
B) The age of the population affects the slope of the consumption function.
C) Other things equal, the level of consumption will rise with increases in population.
D) Younger households tend to have higher MPCs than older households.
E) Older households tend to have higher MPSs than younger households.
فتح الحزمة
افتح القفل للوصول البطاقات البالغ عددها 120 في هذه المجموعة.
فتح الحزمة
k this deck
59
The consumer confidence index can be defined as:
A) an economic index that measures how consumers feel about their government.
B) an economic index that measures how confident companies are about keeping their current consumers.
C) an economic index that measures household expectations about the economy.
D) an economic index that measures how investors feel about their investments in the stock market.
E) an economic index used to measure consumers' confidence on a particular brand.
فتح الحزمة
افتح القفل للوصول البطاقات البالغ عددها 120 في هذه المجموعة.
فتح الحزمة
k this deck
60
As a function of real GDP (real GDP being measured on the horizontal axis), autonomous investment is represented by a(n):
A) U-shaped curve.
B) vertical line.
C) positively sloped line.
D) negatively sloped line.
E) horizontal line.
A) U-shaped curve.
B) vertical line.
C) positively sloped line.
D) negatively sloped line.
E) horizontal line.
فتح الحزمة
افتح القفل للوصول البطاقات البالغ عددها 120 في هذه المجموعة.
فتح الحزمة
k this deck
61
When the U.S. government removes investment tax credits:
A) consumption spending falls.
B) the return on investment increases.
C) capacity utilization in the economy expands.
D) the cost of capital increases.
E) technological innovation advances more rapidly.
A) consumption spending falls.
B) the return on investment increases.
C) capacity utilization in the economy expands.
D) the cost of capital increases.
E) technological innovation advances more rapidly.
فتح الحزمة
افتح القفل للوصول البطاقات البالغ عددها 120 في هذه المجموعة.
فتح الحزمة
k this deck
62
Which of the following is least likely to contribute to the volatility of investment spending?
A) Expectations about business conditions
B) Changes in government spending
C) Changes in tax laws
D) Changes in capacity utilization
E) Interest rate fluctuations
A) Expectations about business conditions
B) Changes in government spending
C) Changes in tax laws
D) Changes in capacity utilization
E) Interest rate fluctuations
فتح الحزمة
افتح القفل للوصول البطاقات البالغ عددها 120 في هذه المجموعة.
فتح الحزمة
k this deck
63
In the table given below Y represents the aggregate expenditure of the economy on C = consumption, I = investment, G = government projects, and X = net exports.?
Refer to Table 9.3. Compute the marginal propensity to save in the economy.
A) 0.10
B) 0.20
C) 0.25
D) 0.50
E) 0.75
Refer to Table 9.3. Compute the marginal propensity to save in the economy.
A) 0.10
B) 0.20
C) 0.25
D) 0.50
E) 0.75
فتح الحزمة
افتح القفل للوصول البطاقات البالغ عددها 120 في هذه المجموعة.
فتح الحزمة
k this deck
64
When capacity utilization rate is high:
A) the price level is likely to go up.
B) consumption is likely to go down.
C) investment is likely to increase.
D) the rate of interest is likely to decrease.
E) aggregate supply of goods is likely to remain constant.
A) the price level is likely to go up.
B) consumption is likely to go down.
C) investment is likely to increase.
D) the rate of interest is likely to decrease.
E) aggregate supply of goods is likely to remain constant.
فتح الحزمة
افتح القفل للوصول البطاقات البالغ عددها 120 في هذه المجموعة.
فتح الحزمة
k this deck
65
Refer to Table 9.2. If a firm purchases the machine by taking out a one-year loan, what is the firm's profit from the investment?
A) $25,500
B) $35,000
C) $8,000
D) $0
E) $6,525
فتح الحزمة
افتح القفل للوصول البطاقات البالغ عددها 120 في هذه المجموعة.
فتح الحزمة
k this deck
66
The net export function illustrates that:
A) net exports are a positive function of domestic income.
B) net exports are independent of domestic income.
C) net exports are a negative function of domestic income.
D) exports are a negative function of foreign income.
E) exports are independent of foreign income.
A) net exports are a positive function of domestic income.
B) net exports are independent of domestic income.
C) net exports are a negative function of domestic income.
D) exports are a negative function of foreign income.
E) exports are independent of foreign income.
فتح الحزمة
افتح القفل للوصول البطاقات البالغ عددها 120 في هذه المجموعة.
فتح الحزمة
k this deck
67
As capacity utilization in an economy rises:
A) firms sell their fixed assets to remain solvent.
B) the gap between the potential output and actual output widens.
C) firms reduce their demand for labor.
D) employment of inputs by firms declines.
E) firms add more factories and machines and increase output.
A) firms sell their fixed assets to remain solvent.
B) the gap between the potential output and actual output widens.
C) firms reduce their demand for labor.
D) employment of inputs by firms declines.
E) firms add more factories and machines and increase output.
فتح الحزمة
افتح القفل للوصول البطاقات البالغ عددها 120 في هذه المجموعة.
فتح الحزمة
k this deck
68
Which of the following will cause the net export function to shift?
A) A change in real GDP
B) An increase in government spending
C) An increase in investment spending
D) A change in the exchange rate
E) A change in the domestic interest rate
A) A change in real GDP
B) An increase in government spending
C) An increase in investment spending
D) A change in the exchange rate
E) A change in the domestic interest rate
فتح الحزمة
افتح القفل للوصول البطاقات البالغ عددها 120 في هذه المجموعة.
فتح الحزمة
k this deck
69
What would be the impact of an increase in foreign income on the net export function?
A) The net export function would shift upward.
B) The net export function would shift downward.
C) The slope of the net export function would increase.
D) The slope of the net export function would decrease.
E) There would be a movement up along the net export function.
A) The net export function would shift upward.
B) The net export function would shift downward.
C) The slope of the net export function would increase.
D) The slope of the net export function would decrease.
E) There would be a movement up along the net export function.
فتح الحزمة
افتح القفل للوصول البطاقات البالغ عددها 120 في هذه المجموعة.
فتح الحزمة
k this deck
70
Other things equal, when Europeans want to buy more grains from the United States:
A) U.S. imports will increase.
B) European exports will increase at every level of domestic income.
C) U.S. exports will increase at every level of domestic income.
D) the U.S. balance of payments will show a deficit.
E) U.S. consumption spending will fall.
A) U.S. imports will increase.
B) European exports will increase at every level of domestic income.
C) U.S. exports will increase at every level of domestic income.
D) the U.S. balance of payments will show a deficit.
E) U.S. consumption spending will fall.
فتح الحزمة
افتح القفل للوصول البطاقات البالغ عددها 120 في هذه المجموعة.
فتح الحزمة
k this deck
71
Which of the following statements is true?
A) Real GDP is a positive function of net exports.
B) In the 1980s, the United States experienced a large trade surplus with Japan.
C) Positive net exports mean that the domestic country imports more than it exports.
D) Total U.S. net exports with Western Europe are zero.
E) U.S. net exports are negative because of large trade deficits with other industrial nations.
فتح الحزمة
افتح القفل للوصول البطاقات البالغ عددها 120 في هذه المجموعة.
فتح الحزمة
k this deck
72
In the table given below Y represents the aggregate expenditure of the economy on C = consumption, I = investment, G = government projects, and X = net exports.?
Refer to Table 9.3. Calculate the marginal propensity to consume in the economy.
A) 0.25
B) 0.50
C) 0.75
D) 0.80
E) 1.25
Refer to Table 9.3. Calculate the marginal propensity to consume in the economy.
A) 0.25
B) 0.50
C) 0.75
D) 0.80
E) 1.25
فتح الحزمة
افتح القفل للوصول البطاقات البالغ عددها 120 في هذه المجموعة.
فتح الحزمة
k this deck
73
An MPI of 0.4 indicates that for every 100 percent increase in domestic income:
A) there is a 40 percent increase in investment.
B) there is a $40 increase in investment.
C) there is a 40 percent decline in imports.
D) there is a $40 increase in imports.
E) there is a 40 percent increase in imports.
A) there is a 40 percent increase in investment.
B) there is a $40 increase in investment.
C) there is a 40 percent decline in imports.
D) there is a $40 increase in imports.
E) there is a 40 percent increase in imports.
فتح الحزمة
افتح القفل للوصول البطاقات البالغ عددها 120 في هذه المجموعة.
فتح الحزمة
k this deck
74
The second-largest component of aggregate expenditures in the United States is _____.
A) consumption
B) investment
C) government expenditure
D) imports
E) exports
A) consumption
B) investment
C) government expenditure
D) imports
E) exports
فتح الحزمة
افتح القفل للوصول البطاقات البالغ عددها 120 في هذه المجموعة.
فتح الحزمة
k this deck
75
Suppose the marginal propensity to import for country A is 0.4. Calculate the change in the total value of imports of the country if national income increases by $100,000.
A) $16,000
B) $20,000
C) $60,000
D) $40,000
E) $25,000
A) $16,000
B) $20,000
C) $60,000
D) $40,000
E) $25,000
فتح الحزمة
افتح القفل للوصول البطاقات البالغ عددها 120 في هذه المجموعة.
فتح الحزمة
k this deck
76
Which of the following would cause a change in imports?
A) A change in foreign income
B) A change in foreign consumption
C) A change in domestic tastes for foreign products
D) A change in foreign tastes for domestic products
E) A change in domestic investment spending
A) A change in foreign income
B) A change in foreign consumption
C) A change in domestic tastes for foreign products
D) A change in foreign tastes for domestic products
E) A change in domestic investment spending
فتح الحزمة
افتح القفل للوصول البطاقات البالغ عددها 120 في هذه المجموعة.
فتح الحزمة
k this deck
77
Refer to Table 9.2. If a firm purchases the machine by taking out a one-year loan, what happens to the firm's rate of return on the investment if the interest rate increases to 10 percent?
A) It increases to 1.5 percent
B) It increases to 0.15 percent
C) It decreases to 1.5 percent
D) It decreases to 1.7 percent
E) It decreases to 0.17 percent
فتح الحزمة
افتح القفل للوصول البطاقات البالغ عددها 120 في هذه المجموعة.
فتح الحزمة
k this deck
78
Which of the following factors will not affect the profit expectations of business firms and change the level of investment?
A) Entry of new firms into the market
B) Introduction of new taxes
C) Announcement of new government subsidies
D) The current level of GDP
E) The marginal propensity to consume
A) Entry of new firms into the market
B) Introduction of new taxes
C) Announcement of new government subsidies
D) The current level of GDP
E) The marginal propensity to consume
فتح الحزمة
افتح القفل للوصول البطاقات البالغ عددها 120 في هذه المجموعة.
فتح الحزمة
k this deck
79
All of the following would cause exports to decline, except:
A) a depreciation of the domestic currency.
B) a decline in foreign income.
C) stricter government regulations on international trade.
D) a decline in foreign preferences for domestic goods.
E) foreign import quotas on domestic products.
A) a depreciation of the domestic currency.
B) a decline in foreign income.
C) stricter government regulations on international trade.
D) a decline in foreign preferences for domestic goods.
E) foreign import quotas on domestic products.
فتح الحزمة
افتح القفل للوصول البطاقات البالغ عددها 120 في هذه المجموعة.
فتح الحزمة
k this deck
80
Which of the following will cause the investment function to shift upward?
A) A decrease in government subsidies to businesses
B) An increase in business profits
C) A decline in capacity utilization
D) Expectations of higher business taxes
E) An increase in the market rate of interest
A) A decrease in government subsidies to businesses
B) An increase in business profits
C) A decline in capacity utilization
D) Expectations of higher business taxes
E) An increase in the market rate of interest
فتح الحزمة
افتح القفل للوصول البطاقات البالغ عددها 120 في هذه المجموعة.
فتح الحزمة
k this deck
فتح الحزمة
افتح القفل للوصول البطاقات البالغ عددها 120 في هذه المجموعة.


