Deck 19: Applying graphs to economics
ملء الشاشة (f)
سؤال
Exhibit 1A-4 Straight line
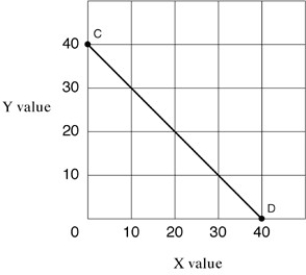
In Exhibit 1A-4,as X increases along the horizontal axis,corresponding to points C-D on the line,the Y values decrease.The relationship between the X and Y variables is:
A)direct.
B)inverse.
C)independent.
D)variable.
In Exhibit 1A-4,as X increases along the horizontal axis,corresponding to points C-D on the line,the Y values decrease.The relationship between the X and Y variables is:
A)direct.
B)inverse.
C)independent.
D)variable.
سؤال
سؤال
Exhibit 1A-4 Straight line
In Exhibit 1A-4,the slope of straight line CD is:
A)positive.
B)zero.
C)negative.
D)variable.
In Exhibit 1A-4,the slope of straight line CD is:
A)positive.
B)zero.
C)negative.
D)variable.
سؤال
سؤال
سؤال
سؤال
Exhibit 1A-4 Straight line
Straight line CD in Exhibit 1A-4 shows which of the following?
A)Increasing values for X increases the value of Y.
B)Decreasing values for X decreases the value of Y.
C)There is no association between X and Y.
D)Variables X and Y are negatively related.
Straight line CD in Exhibit 1A-4 shows which of the following?
A)Increasing values for X increases the value of Y.
B)Decreasing values for X decreases the value of Y.
C)There is no association between X and Y.
D)Variables X and Y are negatively related.
سؤال
سؤال
Exhibit 1A-3 Straight line
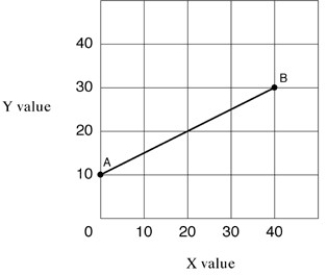
As shown in Exhibit 1A-3,the slope of straight line AB:
A)decreases with increases in X.
B)increases with increases in X.
C)increases with decreases in X.
D)remains constant with changes in X.
As shown in Exhibit 1A-3,the slope of straight line AB:
A)decreases with increases in X.
B)increases with increases in X.
C)increases with decreases in X.
D)remains constant with changes in X.
سؤال
سؤال
Exhibit 1A-3 Straight line
In Exhibit 1A-3,the slope of straight line AB is:
A)1.
B)5.
C)1/2.
D)-1.
E)not determinable from the information provided.
In Exhibit 1A-3,the slope of straight line AB is:
A)1.
B)5.
C)1/2.
D)-1.
E)not determinable from the information provided.
سؤال
Exhibit 1A-3 Straight line
In Exhibit 1A-3,the slope of straight line AB is:
A)variable.
B)zero.
C)negative.
D)positive.
E)not determinable from the information provided.
In Exhibit 1A-3,the slope of straight line AB is:
A)variable.
B)zero.
C)negative.
D)positive.
E)not determinable from the information provided.
سؤال
سؤال
Exhibit 1A-2 Straight line
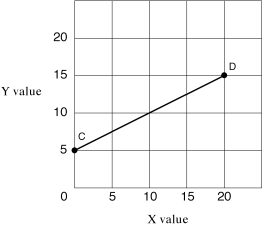
In Exhibit 1A-2,as X increases along the horizontal axis,corresponding to points C-D on the line,the Y values increase.The relationship between the X and Y variables is:
A)direct.
B)inverse.
C)independent.
D)variable.
In Exhibit 1A-2,as X increases along the horizontal axis,corresponding to points C-D on the line,the Y values increase.The relationship between the X and Y variables is:
A)direct.
B)inverse.
C)independent.
D)variable.
سؤال
Exhibit 1A-2 Straight line
Straight line CD in Exhibit 1A-2 shows which of the following?
A)The relationship between X and Y are unknown.
B)The values of Y are independent from the values of X.
C)There is an inverse relationship between X and Y.
D)There is a direct relationship between X and Y.
Straight line CD in Exhibit 1A-2 shows which of the following?
A)The relationship between X and Y are unknown.
B)The values of Y are independent from the values of X.
C)There is an inverse relationship between X and Y.
D)There is a direct relationship between X and Y.
سؤال
Exhibit 1A-1 Straight line
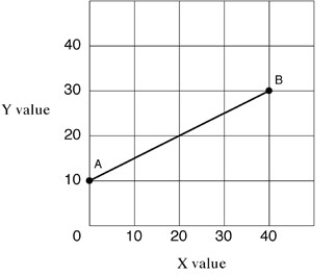
Straight line AB in Exhibit 1A-1 shows which of the following?
A)There is no relationship between variable X and variable Y.
B)Decreasing values for X will cause the values of Y to increase.
C)There is a direct relationship between X and Y.
D)There is a negative relationship between X and Y.
Straight line AB in Exhibit 1A-1 shows which of the following?
A)There is no relationship between variable X and variable Y.
B)Decreasing values for X will cause the values of Y to increase.
C)There is a direct relationship between X and Y.
D)There is a negative relationship between X and Y.
سؤال
سؤال
Exhibit 1A-1 Straight line
In Exhibit 1A-1,as X increases along the horizontal axis,corresponding to points A-B on the line,the Y values increase.The relationship between the X and Y variables is:
A)direct.
B)inverse.
C)independent.
D)variable.
In Exhibit 1A-1,as X increases along the horizontal axis,corresponding to points A-B on the line,the Y values increase.The relationship between the X and Y variables is:
A)direct.
B)inverse.
C)independent.
D)variable.
سؤال
Exhibit 1A-1 Straight line
Straight line AB in Exhibit 1A-1 shows which of the following?
A)X and Y have positive causation.
B)The higher the values of X, the higher the values of Y.
C)There is an inverse relationship between X and Y.
D)When values of X increase, values of Y are constant.
Straight line AB in Exhibit 1A-1 shows which of the following?
A)X and Y have positive causation.
B)The higher the values of X, the higher the values of Y.
C)There is an inverse relationship between X and Y.
D)When values of X increase, values of Y are constant.
سؤال
Exhibit 1A-3 Straight line
As shown in Exhibit 1A-3,the intercept of straight line AB is:
A)1.
B)10.
C)20.
D)30.
E)not determinable from the information provided.
As shown in Exhibit 1A-3,the intercept of straight line AB is:
A)1.
B)10.
C)20.
D)30.
E)not determinable from the information provided.
سؤال
سؤال
سؤال
Exhibit 1A-4 Straight line
In Exhibit 1A-4,the slope for straight line CD is:
A)5.
B)1.
C)-1.
D)-5.
In Exhibit 1A-4,the slope for straight line CD is:
A)5.
B)1.
C)-1.
D)-5.
سؤال
Exhibit 1A-6 Straight-line relationship
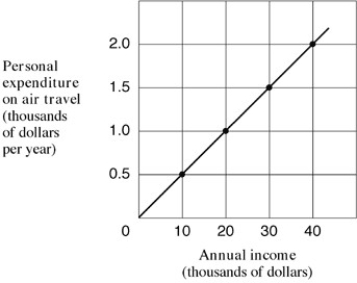
Which of the following would cause a shift in the relationship shown in Exhibit 1A-6?
A)A change in people's annual income.
B)A rise in people's expenditure on air travel.
C)Both a rise in income and a rise in expenditure on air travel.
D)A change in people's preferences in favour of air travel.
Which of the following would cause a shift in the relationship shown in Exhibit 1A-6?
A)A change in people's annual income.
B)A rise in people's expenditure on air travel.
C)Both a rise in income and a rise in expenditure on air travel.
D)A change in people's preferences in favour of air travel.
سؤال
سؤال
Exhibit 1A-6 Straight-line relationship
What is the slope of the line shown in Exhibit 1A-6?
A)1/20.
B)1/10.
C)1/5.
D)1/2.
What is the slope of the line shown in Exhibit 1A-6?
A)1/20.
B)1/10.
C)1/5.
D)1/2.
سؤال
سؤال
سؤال
Exhibit 1A-5 Straight line
In Exhibit 1A-5,the slope of the straight line A-D is:
A)zero.
B)1.
C)1/2.
D)-1.
In Exhibit 1A-5,the slope of the straight line A-D is:
A)zero.
B)1.
C)1/2.
D)-1.
سؤال
Exhibit 1A-5 Straight line
In Exhibit 1A-5,the slope of straight line A-D is:
A)positive.
B)zero.
C)negative.
D)variable.
In Exhibit 1A-5,the slope of straight line A-D is:
A)positive.
B)zero.
C)negative.
D)variable.
سؤال
سؤال
سؤال
سؤال
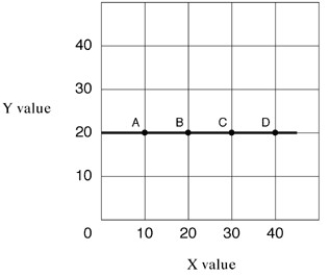
Exhibit 1A-5 Straight line
Straight line A-D in Exhibit 1A-5 shows which of the following?
A)Increasing values for X will increase the value of Y.
B)Increasing values for X will decrease the value of Y.
C)Increasing values for X does not affect the value of Y.
D)All of the above.
Straight line A-D in Exhibit 1A-5 shows which of the following?
A)Increasing values for X will increase the value of Y.
B)Increasing values for X will decrease the value of Y.
C)Increasing values for X does not affect the value of Y.
D)All of the above.
سؤال
سؤال
سؤال
Exhibit 1A-5 Straight line
In Exhibit 1A-5,as X increases along the horizontal axis,corresponding to points A-D on the line,the Y values remain unchanged at 20 units.The relationship between the X and Y variables is:
A)direct.
B)inverse.
C)independent.
D)undefined.
In Exhibit 1A-5,as X increases along the horizontal axis,corresponding to points A-D on the line,the Y values remain unchanged at 20 units.The relationship between the X and Y variables is:
A)direct.
B)inverse.
C)independent.
D)undefined.

فتح الحزمة
قم بالتسجيل لفتح البطاقات في هذه المجموعة!
Unlock Deck
Unlock Deck
1/37
العب
ملء الشاشة (f)
Deck 19: Applying graphs to economics
1
Exhibit 1A-4 Straight line
In Exhibit 1A-4,as X increases along the horizontal axis,corresponding to points C-D on the line,the Y values decrease.The relationship between the X and Y variables is:
A)direct.
B)inverse.
C)independent.
D)variable.
In Exhibit 1A-4,as X increases along the horizontal axis,corresponding to points C-D on the line,the Y values decrease.The relationship between the X and Y variables is:
A)direct.
B)inverse.
C)independent.
D)variable.
B
2
If the coordinates are x1=3,y1=6 and x2=1,y2=2.The slope of the line is:
A)1.
B)2.
C)3.
D)6.
A)1.
B)2.
C)3.
D)6.
B
3
Exhibit 1A-4 Straight line
In Exhibit 1A-4,the slope of straight line CD is:
A)positive.
B)zero.
C)negative.
D)variable.
In Exhibit 1A-4,the slope of straight line CD is:
A)positive.
B)zero.
C)negative.
D)variable.
C
4
Which of the following pairs is the most likely to exhibit an inverse relationship?
A)The amount of time you spend studying and your final marks.
B)Waiter's tips and her service.
C)The annual income and demand for overseas travel.
D)People's annual income and their expenditure on second-hand clothes.
A)The amount of time you spend studying and your final marks.
B)Waiter's tips and her service.
C)The annual income and demand for overseas travel.
D)People's annual income and their expenditure on second-hand clothes.
فتح الحزمة
افتح القفل للوصول البطاقات البالغ عددها 37 في هذه المجموعة.
فتح الحزمة
k this deck
5
Basic economic analysis typically concerns:
A)the relationship between two variables, one of which has negative values.
B)the relationship between two variables, both of which have negative values.
C)the relationship between two variables, both of which have positive values.
D)the relationship between two variables, one variable always increases and the other variable always decreases.
فتح الحزمة
افتح القفل للوصول البطاقات البالغ عددها 37 في هذه المجموعة.
فتح الحزمة
k this deck
6
Which of the following statements is not correct?
A)The slope is the ration of the rise to the run.
B)A direct relationship is one in which two variables change in the same direction.
C)Slope is the ratio of the change in variable on the horizontal axis to the change in the variable on the vertical axis.
D)An independent relationship is one in which two variables are unrelated.
فتح الحزمة
افتح القفل للوصول البطاقات البالغ عددها 37 في هذه المجموعة.
فتح الحزمة
k this deck
7
Exhibit 1A-4 Straight line
Straight line CD in Exhibit 1A-4 shows which of the following?
A)Increasing values for X increases the value of Y.
B)Decreasing values for X decreases the value of Y.
C)There is no association between X and Y.
D)Variables X and Y are negatively related.
Straight line CD in Exhibit 1A-4 shows which of the following?
A)Increasing values for X increases the value of Y.
B)Decreasing values for X decreases the value of Y.
C)There is no association between X and Y.
D)Variables X and Y are negatively related.
فتح الحزمة
افتح القفل للوصول البطاقات البالغ عددها 37 في هذه المجموعة.
فتح الحزمة
k this deck
8
Measured between two points on a curve,the ratio of the change in the variable on the vertical axis to the change in the variable on the horizontal axis is the:
A)axis.
B)slope.
C)dependent curve.
D)independent curve.
A)axis.
B)slope.
C)dependent curve.
D)independent curve.
فتح الحزمة
افتح القفل للوصول البطاقات البالغ عددها 37 في هذه المجموعة.
فتح الحزمة
k this deck
9
Exhibit 1A-3 Straight line
As shown in Exhibit 1A-3,the slope of straight line AB:
A)decreases with increases in X.
B)increases with increases in X.
C)increases with decreases in X.
D)remains constant with changes in X.
As shown in Exhibit 1A-3,the slope of straight line AB:
A)decreases with increases in X.
B)increases with increases in X.
C)increases with decreases in X.
D)remains constant with changes in X.
فتح الحزمة
افتح القفل للوصول البطاقات البالغ عددها 37 في هذه المجموعة.
فتح الحزمة
k this deck
10
An upward-sloping line or curve is used to illustrate:
A)the ceteris paribus assumption.
B)an inverse relationship.
C)two unrelated variables.
D)a direct relationship.
A)the ceteris paribus assumption.
B)an inverse relationship.
C)two unrelated variables.
D)a direct relationship.
فتح الحزمة
افتح القفل للوصول البطاقات البالغ عددها 37 في هذه المجموعة.
فتح الحزمة
k this deck
11
Exhibit 1A-3 Straight line
In Exhibit 1A-3,the slope of straight line AB is:
A)1.
B)5.
C)1/2.
D)-1.
E)not determinable from the information provided.
In Exhibit 1A-3,the slope of straight line AB is:
A)1.
B)5.
C)1/2.
D)-1.
E)not determinable from the information provided.
فتح الحزمة
افتح القفل للوصول البطاقات البالغ عددها 37 في هذه المجموعة.
فتح الحزمة
k this deck
12
Exhibit 1A-3 Straight line
In Exhibit 1A-3,the slope of straight line AB is:
A)variable.
B)zero.
C)negative.
D)positive.
E)not determinable from the information provided.
In Exhibit 1A-3,the slope of straight line AB is:
A)variable.
B)zero.
C)negative.
D)positive.
E)not determinable from the information provided.
فتح الحزمة
افتح القفل للوصول البطاقات البالغ عددها 37 في هذه المجموعة.
فتح الحزمة
k this deck
13
When one variable increases,the other variable increases - it is called:
A)an inverse relationship.
B)causation.
C)horizontal line.
D)a direct relationship.
A)an inverse relationship.
B)causation.
C)horizontal line.
D)a direct relationship.
فتح الحزمة
افتح القفل للوصول البطاقات البالغ عددها 37 في هذه المجموعة.
فتح الحزمة
k this deck
14
Exhibit 1A-2 Straight line
In Exhibit 1A-2,as X increases along the horizontal axis,corresponding to points C-D on the line,the Y values increase.The relationship between the X and Y variables is:
A)direct.
B)inverse.
C)independent.
D)variable.
In Exhibit 1A-2,as X increases along the horizontal axis,corresponding to points C-D on the line,the Y values increase.The relationship between the X and Y variables is:
A)direct.
B)inverse.
C)independent.
D)variable.
فتح الحزمة
افتح القفل للوصول البطاقات البالغ عددها 37 في هذه المجموعة.
فتح الحزمة
k this deck
15
Exhibit 1A-2 Straight line
Straight line CD in Exhibit 1A-2 shows which of the following?
A)The relationship between X and Y are unknown.
B)The values of Y are independent from the values of X.
C)There is an inverse relationship between X and Y.
D)There is a direct relationship between X and Y.
Straight line CD in Exhibit 1A-2 shows which of the following?
A)The relationship between X and Y are unknown.
B)The values of Y are independent from the values of X.
C)There is an inverse relationship between X and Y.
D)There is a direct relationship between X and Y.
فتح الحزمة
افتح القفل للوصول البطاقات البالغ عددها 37 في هذه المجموعة.
فتح الحزمة
k this deck
16
Exhibit 1A-1 Straight line
Straight line AB in Exhibit 1A-1 shows which of the following?
A)There is no relationship between variable X and variable Y.
B)Decreasing values for X will cause the values of Y to increase.
C)There is a direct relationship between X and Y.
D)There is a negative relationship between X and Y.
Straight line AB in Exhibit 1A-1 shows which of the following?
A)There is no relationship between variable X and variable Y.
B)Decreasing values for X will cause the values of Y to increase.
C)There is a direct relationship between X and Y.
D)There is a negative relationship between X and Y.
فتح الحزمة
افتح القفل للوصول البطاقات البالغ عددها 37 في هذه المجموعة.
فتح الحزمة
k this deck
17
A direct relationship exists when:
A)there is no association between two variables.
B)one variable increases and there is no change in the other variable.
C)one variable increases and the other variable increases.
D)one variable increases and the other variable decreases.
A)there is no association between two variables.
B)one variable increases and there is no change in the other variable.
C)one variable increases and the other variable increases.
D)one variable increases and the other variable decreases.
فتح الحزمة
افتح القفل للوصول البطاقات البالغ عددها 37 في هذه المجموعة.
فتح الحزمة
k this deck
18
Exhibit 1A-1 Straight line
In Exhibit 1A-1,as X increases along the horizontal axis,corresponding to points A-B on the line,the Y values increase.The relationship between the X and Y variables is:
A)direct.
B)inverse.
C)independent.
D)variable.
In Exhibit 1A-1,as X increases along the horizontal axis,corresponding to points A-B on the line,the Y values increase.The relationship between the X and Y variables is:
A)direct.
B)inverse.
C)independent.
D)variable.
فتح الحزمة
افتح القفل للوصول البطاقات البالغ عددها 37 في هذه المجموعة.
فتح الحزمة
k this deck
19
Exhibit 1A-1 Straight line
Straight line AB in Exhibit 1A-1 shows which of the following?
A)X and Y have positive causation.
B)The higher the values of X, the higher the values of Y.
C)There is an inverse relationship between X and Y.
D)When values of X increase, values of Y are constant.
Straight line AB in Exhibit 1A-1 shows which of the following?
A)X and Y have positive causation.
B)The higher the values of X, the higher the values of Y.
C)There is an inverse relationship between X and Y.
D)When values of X increase, values of Y are constant.
فتح الحزمة
افتح القفل للوصول البطاقات البالغ عددها 37 في هذه المجموعة.
فتح الحزمة
k this deck
20
Exhibit 1A-3 Straight line
As shown in Exhibit 1A-3,the intercept of straight line AB is:
A)1.
B)10.
C)20.
D)30.
E)not determinable from the information provided.
As shown in Exhibit 1A-3,the intercept of straight line AB is:
A)1.
B)10.
C)20.
D)30.
E)not determinable from the information provided.
فتح الحزمة
افتح القفل للوصول البطاقات البالغ عددها 37 في هذه المجموعة.
فتح الحزمة
k this deck
21
A downward-sloping line has a negative slope.
فتح الحزمة
افتح القفل للوصول البطاقات البالغ عددها 37 في هذه المجموعة.
فتح الحزمة
k this deck
22
A direct relationship is a relationship between two variables in which they move in different directions (if one increases,the other decreases).
فتح الحزمة
افتح القفل للوصول البطاقات البالغ عددها 37 في هذه المجموعة.
فتح الحزمة
k this deck
23
Exhibit 1A-4 Straight line
In Exhibit 1A-4,the slope for straight line CD is:
A)5.
B)1.
C)-1.
D)-5.
In Exhibit 1A-4,the slope for straight line CD is:
A)5.
B)1.
C)-1.
D)-5.
فتح الحزمة
افتح القفل للوصول البطاقات البالغ عددها 37 في هذه المجموعة.
فتح الحزمة
k this deck
24
Exhibit 1A-6 Straight-line relationship
Which of the following would cause a shift in the relationship shown in Exhibit 1A-6?
A)A change in people's annual income.
B)A rise in people's expenditure on air travel.
C)Both a rise in income and a rise in expenditure on air travel.
D)A change in people's preferences in favour of air travel.
Which of the following would cause a shift in the relationship shown in Exhibit 1A-6?
A)A change in people's annual income.
B)A rise in people's expenditure on air travel.
C)Both a rise in income and a rise in expenditure on air travel.
D)A change in people's preferences in favour of air travel.
فتح الحزمة
افتح القفل للوصول البطاقات البالغ عددها 37 في هذه المجموعة.
فتح الحزمة
k this deck
25
In a graphic relationship,shifts in a curve are caused by a change in:
A)the slope of the curve.
B)a factor not measured on the axes of the graph.
C)one of the factors measured on either axes of the graph.
D)any factor, whether measured on the axes of the graph or not.
A)the slope of the curve.
B)a factor not measured on the axes of the graph.
C)one of the factors measured on either axes of the graph.
D)any factor, whether measured on the axes of the graph or not.
فتح الحزمة
افتح القفل للوصول البطاقات البالغ عددها 37 في هذه المجموعة.
فتح الحزمة
k this deck
26
Exhibit 1A-6 Straight-line relationship
What is the slope of the line shown in Exhibit 1A-6?
A)1/20.
B)1/10.
C)1/5.
D)1/2.
What is the slope of the line shown in Exhibit 1A-6?
A)1/20.
B)1/10.
C)1/5.
D)1/2.
فتح الحزمة
افتح القفل للوصول البطاقات البالغ عددها 37 في هذه المجموعة.
فتح الحزمة
k this deck
27
The graph of a direct relationship will have a negative slope.
فتح الحزمة
افتح القفل للوصول البطاقات البالغ عددها 37 في هذه المجموعة.
فتح الحزمة
k this deck
28
An inverse relationship is a negative causation between two variables.
فتح الحزمة
افتح القفل للوصول البطاقات البالغ عددها 37 في هذه المجموعة.
فتح الحزمة
k this deck
29
Exhibit 1A-5 Straight line
In Exhibit 1A-5,the slope of the straight line A-D is:
A)zero.
B)1.
C)1/2.
D)-1.
In Exhibit 1A-5,the slope of the straight line A-D is:
A)zero.
B)1.
C)1/2.
D)-1.
فتح الحزمة
افتح القفل للوصول البطاقات البالغ عددها 37 في هذه المجموعة.
فتح الحزمة
k this deck
30
Exhibit 1A-5 Straight line
In Exhibit 1A-5,the slope of straight line A-D is:
A)positive.
B)zero.
C)negative.
D)variable.
In Exhibit 1A-5,the slope of straight line A-D is:
A)positive.
B)zero.
C)negative.
D)variable.
فتح الحزمة
افتح القفل للوصول البطاقات البالغ عددها 37 في هذه المجموعة.
فتح الحزمة
k this deck
31
A graph can be used to illustrate the relationship between the price of compact discs and the quantity of compact discs demanded.If there is evidence that buyers' income also influences the demand for compact discs,then a movement along the curve can be caused by a change in the price of compact discs.
فتح الحزمة
افتح القفل للوصول البطاقات البالغ عددها 37 في هذه المجموعة.
فتح الحزمة
k this deck
32
Adding a third variable to a two dimensional graph:
A)makes it impossible to interpret the graph.
B)helps to show the effect of factors that are not on the graph.
C)creates unnecessary complexity and should be avoided.
D)provides a point of intersection.
A)makes it impossible to interpret the graph.
B)helps to show the effect of factors that are not on the graph.
C)creates unnecessary complexity and should be avoided.
D)provides a point of intersection.
فتح الحزمة
افتح القفل للوصول البطاقات البالغ عددها 37 في هذه المجموعة.
فتح الحزمة
k this deck
33
A horizontal line indicates an independent relationship between two variables.
فتح الحزمة
افتح القفل للوصول البطاقات البالغ عددها 37 في هذه المجموعة.
فتح الحزمة
k this deck
34
Exhibit 1A-5 Straight line
Straight line A-D in Exhibit 1A-5 shows which of the following?
A)Increasing values for X will increase the value of Y.
B)Increasing values for X will decrease the value of Y.
C)Increasing values for X does not affect the value of Y.
D)All of the above.
Straight line A-D in Exhibit 1A-5 shows which of the following?
A)Increasing values for X will increase the value of Y.
B)Increasing values for X will decrease the value of Y.
C)Increasing values for X does not affect the value of Y.
D)All of the above.
فتح الحزمة
افتح القفل للوصول البطاقات البالغ عددها 37 في هذه المجموعة.
فتح الحزمة
k this deck
35
A change in a third variable not on either axis of a graph is illustrated with:
A)a horizontal or vertical line.
B)a movement along a curve.
C)a shift of a curve.
D)a point of intersection.
A)a horizontal or vertical line.
B)a movement along a curve.
C)a shift of a curve.
D)a point of intersection.
فتح الحزمة
افتح القفل للوصول البطاقات البالغ عددها 37 في هذه المجموعة.
فتح الحزمة
k this deck
36
Direct relationships are illustrated using upward-sloping lines and curves.
فتح الحزمة
افتح القفل للوصول البطاقات البالغ عددها 37 في هذه المجموعة.
فتح الحزمة
k this deck
37
Exhibit 1A-5 Straight line
In Exhibit 1A-5,as X increases along the horizontal axis,corresponding to points A-D on the line,the Y values remain unchanged at 20 units.The relationship between the X and Y variables is:
A)direct.
B)inverse.
C)independent.
D)undefined.
In Exhibit 1A-5,as X increases along the horizontal axis,corresponding to points A-D on the line,the Y values remain unchanged at 20 units.The relationship between the X and Y variables is:
A)direct.
B)inverse.
C)independent.
D)undefined.
فتح الحزمة
افتح القفل للوصول البطاقات البالغ عددها 37 في هذه المجموعة.
فتح الحزمة
k this deck
فتح الحزمة
افتح القفل للوصول البطاقات البالغ عددها 37 في هذه المجموعة.


