Deck 2: Descriptive Statistics
ملء الشاشة (f)
سؤال
سؤال
سؤال
سؤال
سؤال
سؤال
سؤال
سؤال
سؤال
سؤال
سؤال
سؤال
سؤال
Consider the data below. What percentage of students scored grade C? 
A) 33%
B) 31%
C) 37%
D) 28%
A) 33%
B) 31%
C) 37%
D) 28%
سؤال
سؤال
سؤال
سؤال
سؤال
سؤال
سؤال
Compute the relative frequencies for the data given in the table below: 
A) 0.31, 0.14, 0.37, 0.18
B) 0.37, 0.14, 0.31, 0.18
C) 0.14, 0.31, 0.37, 0.18
D) 0.18, 0.31, 0.37, 0.14
A) 0.31, 0.14, 0.37, 0.18
B) 0.37, 0.14, 0.31, 0.18
C) 0.14, 0.31, 0.37, 0.18
D) 0.18, 0.31, 0.37, 0.14
سؤال
سؤال
سؤال
سؤال
سؤال
سؤال
سؤال
سؤال
سؤال
سؤال
سؤال
سؤال
Identify the shape of the distribution in the below figure. 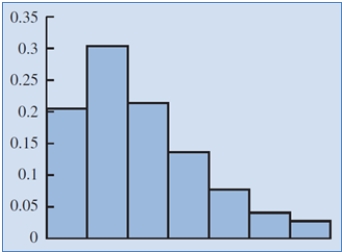
A) Moderately skewed left
B) Symmetric
C) Highly skewed right
D) Moderately skewed right
A) Moderately skewed left
B) Symmetric
C) Highly skewed right
D) Moderately skewed right
سؤال
سؤال
سؤال
سؤال
سؤال
سؤال
سؤال
سؤال
سؤال
سؤال
سؤال
The partial relative frequency distribution is given below:

a. What is the relative frequency of group 4?
b. The total sample size is 400. What is the frequency of group 4?
c. Show the frequency distribution.
d. Show the percent frequency distribution.
a. What is the relative frequency of group 4?
b. The total sample size is 400. What is the frequency of group 4?
c. Show the frequency distribution.
d. Show the percent frequency distribution.
سؤال
Suppose that the average time an employee takes to reach the office is 35 minutes. To address the issue of late comers, the mode of transport chosen by the employee is tracked: private transport (two-wheelers and four-wheelers) and public transport. The data on the average time (in minutes) taken using both a private transportation system and a public transportation system for a sample of employees are given below:

a. Considering the travel times (in minutes) of employees using private transport. Compute the z-score for the tenth employee with travel time of 29 minutes.
b. Considering the travel times (in minutes) of employees using public transport. Compute the z-score for the second employee with travel time of 29 minutes. How does this z-score compare with the z-score you calculated for part a?
c. Based on z-scores, do the data for employees using private transport and public transport contain any outliers?
سؤال
سؤال
The following table provides information on the number of billionaires in a country and the continents on which these countries are located.
 a. Sort the countries from largest to smallest based on the number of billionaires. What are the top 5 countries according to the number of billionaires? b. Filter the countries to display only the countries located in North America.
a. Sort the countries from largest to smallest based on the number of billionaires. What are the top 5 countries according to the number of billionaires? b. Filter the countries to display only the countries located in North America. سؤال
سؤال
Suppose that you make a fixed deposit of $1,000 in Bank X, and $500 in Bank Y. The value of each investment at the end of each subsequent year is provided in the table:

Which of the two banks provide a better return over this time period?
Which of the two banks provide a better return over this time period?
سؤال
The manager of an automobile showroom studied the time spent by each salesman interacting with the customer in a month apart from the other jobs assigned to them. The data in hours are given below.

Using classes 1013, 1417, and so on, show: Using classes 10-13, 14-17, and so on, show:
The frequency distribution.
The relative frequency distribution.
The cumulative frequency distribution.
The cumulative relative frequency distribution.
The proportion of salesmen who spend 13 hours of time or less with the customers.
Prepare a histogram and comment on the shape of the distribution.
سؤال
A survey on the most preferred newspaper in USA listed The New York Times(TNYT), Washington Post(WP), Daily News(DN), New York Post(NYP), and Los Angeles Times (LAT) as the top five most preferred newspapers. The table below shows the preferences of 50 citizens.

a. Are these data categorical or quantitative?
b. Provide frequency and percent frequency distributions.
c. On the basis of the sample, which newspaper is preferred the most?
a. Are these data categorical or quantitative?
b. Provide frequency and percent frequency distributions.
c. On the basis of the sample, which newspaper is preferred the most?
سؤال
Suppose that the average time an employee takes to reach the office is 35 minutes. To address the issue of late comers, the mode of transport chosen by the employee is tracked: private transport (two-wheelers and four-wheelers) and public transport. The data on the average time (in minutes) taken using both a private transportation system and a public transportation system for a sample of employees are given below:

a. What are the mean and median travel times for employees using a private transport? What are the mean and median travel times for employees using a public transport?
b. What are the variance and standard deviation of travel times for employees using a private transport? What are the variance and standard deviation of travel times for employees using a public transport?
c. Comment.
سؤال
سؤال
The average time a customer service executive takes to resolve an issue on a mobile handset is 26.4 minutes. The average time taken to resolve the issue by a sample of 15 such executives are shown below:

a. What is the mean resolution time?
b. What is the median resolution time?
c. What is the mode for these 15 executives?
d. What is the variance and standard deviation?
e. What is the third quartile?
a. What is the mean resolution time?
b. What is the median resolution time?
c. What is the mode for these 15 executives?
d. What is the variance and standard deviation?
e. What is the third quartile?
سؤال
سؤال
The mentor of a class researched on the number of hours spent on study in a week by each student of the class, to analyze the correlation between the study hours and the marks obtained by each student. The data on the hours spent per week by 25 students are listed below:

a. What is the least amount of time a student spent per week on studying after school hours in this sample? The highest?
b. Use a class width of 2 hours to prepare a frequency distribution, a relative frequency distribution, and a percent frequency distribution for the data.
c. Prepare a histogram and comment on the shape of the distribution.
سؤال
Eight observations taken for two variables are as follows:

a. Develop a scatter diagram with x on the horizontal axis.
b. What does the scatter diagram developed in part a indicate about the relationship between the two variables?
c. Compute and interpret the sample covariance.
d. Compute and interpret the sample correlation coefficient.
a. Develop a scatter diagram with x on the horizontal axis.
b. What does the scatter diagram developed in part a indicate about the relationship between the two variables?
c. Compute and interpret the sample covariance.
d. Compute and interpret the sample correlation coefficient.
سؤال
The data on the percentage of visitors in the previous and current years at 12 well-known national parks of Unites States are given below:

a. Sort the parks in descending order by their current year's visitor percentage. Which park has the highest number of visitors in the current year? Which park has the lowest number of visitors in the current year?
b. Calculate the change in visitor percentage from the previous to the current year for each park. Use Excel's conditional formatting to highlight the park whose visitor percentage decreased from the previous year to the current year.
c. Use Excel's conditional formatting tool to create data bars for the change in visitor percentage from the previous year to the current year for each park calculated in part b.
سؤال
سؤال
سؤال
Consider the following data on income and savings of a sample of residents in a locality:

a. Compute the correlation coefficient. Is there a positive correlation between the income and savings? What is your interpretation?
b. Show a scatter diagram of the relationship between the income and savings.
a. Compute the correlation coefficient. Is there a positive correlation between the income and savings? What is your interpretation?
b. Show a scatter diagram of the relationship between the income and savings.

فتح الحزمة
قم بالتسجيل لفتح البطاقات في هذه المجموعة!
Unlock Deck
Unlock Deck
1/60
العب
ملء الشاشة (f)
Deck 2: Descriptive Statistics
1
The data on grades (A, B, C, and D) scored by all students in a test is an example of
A) quantitative datA)
B) sample data.
C) categorical data.
D) analytical data.
A) quantitative datA)
B) sample data.
C) categorical data.
D) analytical data.
categorical data.
2
A variable whose values are not known with certainty is called a _____.
A) certain variable
B) random variable
C) constant variable
D) decision variable
A) certain variable
B) random variable
C) constant variable
D) decision variable
random variable
3
The act of collecting data that are representative of the population data is called
A) random sampling.
B) sample data.
C) population sampling.
D) applications of business analytics.
A) random sampling.
B) sample data.
C) population sampling.
D) applications of business analytics.
random sampling.
4
_____ are collected from several entities at the same point in time.
A) Time series data
B) Categorical and quantitative data
C) Cross-sectional data
D) Random data
A) Time series data
B) Categorical and quantitative data
C) Cross-sectional data
D) Random data
فتح الحزمة
افتح القفل للوصول البطاقات البالغ عددها 60 في هذه المجموعة.
فتح الحزمة
k this deck
5
The difference in a variable measured over observations (time, customers, items, etc.) is called as _____.
A) observed differences
B) variation
C) variable change
D) descriptive analytics
A) observed differences
B) variation
C) variable change
D) descriptive analytics
فتح الحزمة
افتح القفل للوصول البطاقات البالغ عددها 60 في هذه المجموعة.
فتح الحزمة
k this deck
6
A set of values corresponding to a set of variables is defined as a(n) _____.
A) quantity
B) event
C) factor
D) observation
A) quantity
B) event
C) factor
D) observation
فتح الحزمة
افتح القفل للوصول البطاقات البالغ عددها 60 في هذه المجموعة.
فتح الحزمة
k this deck
7
A variable is defined as a
A) quantity of interest that can take on same values.
B) set of values.
C) quantity of interest that can take on different values.
D) characteristic that takes on same values from a set of values.
A) quantity of interest that can take on same values.
B) set of values.
C) quantity of interest that can take on different values.
D) characteristic that takes on same values from a set of values.
فتح الحزمة
افتح القفل للوصول البطاقات البالغ عددها 60 في هذه المجموعة.
فتح الحزمة
k this deck
8
_____ act(s) as a representative of the population.
A) The analytics
B) The variance
C) A sample
D) The random variables
A) The analytics
B) The variance
C) A sample
D) The random variables
فتح الحزمة
افتح القفل للوصول البطاقات البالغ عددها 60 في هذه المجموعة.
فتح الحزمة
k this deck
9
The data collected from the customers in restaurants about the quality of food is an example of
A) variable study.
B) cross-sectional study.
C) experimental study.
D) observational study.
A) variable study.
B) cross-sectional study.
C) experimental study.
D) observational study.
فتح الحزمة
افتح القفل للوصول البطاقات البالغ عددها 60 في هذه المجموعة.
فتح الحزمة
k this deck
10
In a(n) _____, one or more variables are identified and controlled or manipulated so that data can be obtained about how they influence the variable of interest identified first.
A) experimental study
B) observational study
C) categorical study
D) variable study
A) experimental study
B) observational study
C) categorical study
D) variable study
فتح الحزمة
افتح القفل للوصول البطاقات البالغ عددها 60 في هذه المجموعة.
فتح الحزمة
k this deck
11
A summary of data that shows the number of observations in each of several nonoverlapping bins is called
A) a frequency distribution.
B) a sample summary.
C) a bin distribution.
D) an observed distribution.
A) a frequency distribution.
B) a sample summary.
C) a bin distribution.
D) an observed distribution.
فتح الحزمة
افتح القفل للوصول البطاقات البالغ عددها 60 في هذه المجموعة.
فتح الحزمة
k this deck
12
Which of the following are necessary to be determined to define the classes for a frequency distribution with quantitative data?
A) Number of nonoverlapping bins, width of each bin, and bin limits
B) Width of each bin and bin lower limits
C) Number of overlapping bins, width of each bin, and bin upper limits
D) Width of each bin and number of bins
A) Number of nonoverlapping bins, width of each bin, and bin limits
B) Width of each bin and bin lower limits
C) Number of overlapping bins, width of each bin, and bin upper limits
D) Width of each bin and number of bins
فتح الحزمة
افتح القفل للوصول البطاقات البالغ عددها 60 في هذه المجموعة.
فتح الحزمة
k this deck
13
Consider the data below. What percentage of students scored grade C?
A) 33%
B) 31%
C) 37%
D) 28%
A) 33%
B) 31%
C) 37%
D) 28%
فتح الحزمة
افتح القفل للوصول البطاقات البالغ عددها 60 في هذه المجموعة.
فتح الحزمة
k this deck
14
The purpose of using enough bins is to show the
A) number of observations.
B) number of variables.
C) variation in the data.
D) correlation in the data.
A) number of observations.
B) number of variables.
C) variation in the data.
D) correlation in the data.
فتح الحزمة
افتح القفل للوصول البطاقات البالغ عددها 60 في هذه المجموعة.
فتح الحزمة
k this deck
15
Data collected from several entities over several time periods is
A) categorical and quantitative datA)
B) time series data.
C) source data.
D) cross-sectional data.
A) categorical and quantitative datA)
B) time series data.
C) source data.
D) cross-sectional data.
فتح الحزمة
افتح القفل للوصول البطاقات البالغ عددها 60 في هذه المجموعة.
فتح الحزمة
k this deck
16
When the data are large and when it is difficult to analyze all at once, which of the following feature in Excel is used to make the data more manageable and to develop insights?
A) Frequency table
B) Sorting and filtering
C) Fill color
D) Charts
A) Frequency table
B) Sorting and filtering
C) Fill color
D) Charts
فتح الحزمة
افتح القفل للوصول البطاقات البالغ عددها 60 في هذه المجموعة.
فتح الحزمة
k this deck
17
Which of the following gives the proportion of items in each bin?
A) Frequency
B) Percent frequency
C) Relative frequency
D) Bin proportion
A) Frequency
B) Percent frequency
C) Relative frequency
D) Bin proportion
فتح الحزمة
افتح القفل للوصول البطاقات البالغ عددها 60 في هذه المجموعة.
فتح الحزمة
k this deck
18
The data on the time taken by₁₀ students in a class to answer a test is an example of
A) population datA)
B) categorical data.
C) time series data.
D) quantitative data.
A) population datA)
B) categorical data.
C) time series data.
D) quantitative data.
فتح الحزمة
افتح القفل للوصول البطاقات البالغ عددها 60 في هذه المجموعة.
فتح الحزمة
k this deck
19
_____ provide facts and figures that can be used for analysis and interpretation of a population of interest.
A) Data
B) Variables
C) Range
D) Query
A) Data
B) Variables
C) Range
D) Query
فتح الحزمة
افتح القفل للوصول البطاقات البالغ عددها 60 في هذه المجموعة.
فتح الحزمة
k this deck
20
Compute the relative frequencies for the data given in the table below:
A) 0.31, 0.14, 0.37, 0.18
B) 0.37, 0.14, 0.31, 0.18
C) 0.14, 0.31, 0.37, 0.18
D) 0.18, 0.31, 0.37, 0.14
A) 0.31, 0.14, 0.37, 0.18
B) 0.37, 0.14, 0.31, 0.18
C) 0.14, 0.31, 0.37, 0.18
D) 0.18, 0.31, 0.37, 0.14
فتح الحزمة
افتح القفل للوصول البطاقات البالغ عددها 60 في هذه المجموعة.
فتح الحزمة
k this deck
21
Compute the standard deviation for the following sample data. 32 41 36 24 29 30 40 22 25 37
A) 5.96
B) 6.41
C) 5.42
D) 6.75
A) 5.96
B) 6.41
C) 5.42
D) 6.75
فتح الحزمة
افتح القفل للوصول البطاقات البالغ عددها 60 في هذه المجموعة.
فتح الحزمة
k this deck
22
Any data value with a z-score less than -3 or greater than +3 is treated as a(n)
A) outlier.
B) usual value.
C) whisker.
D) z-score value.
A) outlier.
B) usual value.
C) whisker.
D) z-score value.
فتح الحزمة
افتح القفل للوصول البطاقات البالغ عددها 60 في هذه المجموعة.
فتح الحزمة
k this deck
23
The variance is based on the
A) deviation about the median.
B) number of variables.
C) deviation about the mean.
D) correlation in the data.
A) deviation about the median.
B) number of variables.
C) deviation about the mean.
D) correlation in the data.
فتح الحزمة
افتح القفل للوصول البطاقات البالغ عددها 60 في هذه المجموعة.
فتح الحزمة
k this deck
24
Compute the mode for the following data: 12 16 19 10 12 11 21 12 21 10
A) 21
B) 11
C) 12
D) 10
A) 21
B) 11
C) 12
D) 10
فتح الحزمة
افتح القفل للوصول البطاقات البالغ عددها 60 في هذه المجموعة.
فتح الحزمة
k this deck
25
The simplest measure of variability is the
A) variance.
B) standard deviation.
C) coefficient of variation.
D) range.
A) variance.
B) standard deviation.
C) coefficient of variation.
D) range.
فتح الحزمة
افتح القفل للوصول البطاقات البالغ عددها 60 في هذه المجموعة.
فتح الحزمة
k this deck
26
Compute the geometric mean for the following data on growth factors of an investment for 10 years: 1.10 0.50 0.70 1.21 1.25 1.12 1.16 1.11 1.13 1.22
A) 1.0221
B) 1.0148
C) 1.0363
D) 1.1475
A) 1.0221
B) 1.0148
C) 1.0363
D) 1.1475
فتح الحزمة
افتح القفل للوصول البطاقات البالغ عددها 60 في هذه المجموعة.
فتح الحزمة
k this deck
27
Compute the 50th percentile for the following data: 10 15 17 21 25 12 16 11 13 22
A) 18.6
B) 13.3
C) 15.5
D) 17.7
A) 18.6
B) 13.3
C) 15.5
D) 17.7
فتح الحزمة
افتح القفل للوصول البطاقات البالغ عددها 60 في هذه المجموعة.
فتح الحزمة
k this deck
28
Compute the third quartile for the following data. 10 15 17 21 25 12 16 11 13 22
A) 21.25
B) 15.5
C) 21.5
D) 11.75
A) 21.25
B) 15.5
C) 21.5
D) 11.75
فتح الحزمة
افتح القفل للوصول البطاقات البالغ عددها 60 في هذه المجموعة.
فتح الحزمة
k this deck
29
Compute IQR for the following data. 10 15 17 21 25 12 16 11 13 22
A) 6.25
B) 7.75
C) 5.14
D) 9.50
A) 6.25
B) 7.75
C) 5.14
D) 9.50
فتح الحزمة
افتح القفل للوصول البطاقات البالغ عددها 60 في هذه المجموعة.
فتح الحزمة
k this deck
30
The _____ shows the number of data items with values less than or equal to the upper class limit of each class.
A) cumulative frequency distribution
B) frequency distribution
C) percent frequency distribution
D) relative frequency distribution
A) cumulative frequency distribution
B) frequency distribution
C) percent frequency distribution
D) relative frequency distribution
فتح الحزمة
افتح القفل للوصول البطاقات البالغ عددها 60 في هذه المجموعة.
فتح الحزمة
k this deck
31
Compute the mean of the following data: 56 42 37 29 45 51 30 25 34 57
A) 42.8
B) 52.1
C) 40.6
D) 39.4
A) 42.8
B) 52.1
C) 40.6
D) 39.4
فتح الحزمة
افتح القفل للوصول البطاقات البالغ عددها 60 في هذه المجموعة.
فتح الحزمة
k this deck
32
Identify the shape of the distribution in the below figure.
A) Moderately skewed left
B) Symmetric
C) Highly skewed right
D) Moderately skewed right
A) Moderately skewed left
B) Symmetric
C) Highly skewed right
D) Moderately skewed right
فتح الحزمة
افتح القفل للوصول البطاقات البالغ عددها 60 في هذه المجموعة.
فتح الحزمة
k this deck
33
For the following sample data, compute the variance. 32 41 36 24 29 30 40 22 25 37
A) 45.6
B) 35.5
C) 41.04
D) 29.4
A) 45.6
B) 35.5
C) 41.04
D) 29.4
فتح الحزمة
افتح القفل للوصول البطاقات البالغ عددها 60 في هذه المجموعة.
فتح الحزمة
k this deck
34
A _____ determines how far a particular value is from the mean relative to the data set's standard deviation.
A) coefficient of variation
B) z-score
C) variance
D) percentile
A) coefficient of variation
B) z-score
C) variance
D) percentile
فتح الحزمة
افتح القفل للوصول البطاقات البالغ عددها 60 في هذه المجموعة.
فتح الحزمة
k this deck
35
Compute the median of the following data: 32 41 36 24 29 30 40 22 25 37
A) 28
B) 31
C) 40
D) 34
A) 28
B) 31
C) 40
D) 34
فتح الحزمة
افتح القفل للوصول البطاقات البالغ عددها 60 في هذه المجموعة.
فتح الحزمة
k this deck
36
Which of the following graphs provide information on outliers and IQR of a data set?
A) Histogram
B) Line chart
C) Scatter chart
D) Box plot
A) Histogram
B) Line chart
C) Scatter chart
D) Box plot
فتح الحزمة
افتح القفل للوصول البطاقات البالغ عددها 60 في هذه المجموعة.
فتح الحزمة
k this deck
37
_____ is a graphical summary of data previously summarized in a frequency distribution.
A) Box plot
B) Histogram
C) Line chart
D) Scatter chart
A) Box plot
B) Histogram
C) Line chart
D) Scatter chart
فتح الحزمة
افتح القفل للوصول البطاقات البالغ عددها 60 في هذه المجموعة.
فتح الحزمة
k this deck
38
The _____ is a point estimate of the population mean for the variable of interest.
A) sample mean
B) median
C) Sample
D) geometric mean
A) sample mean
B) median
C) Sample
D) geometric mean
فتح الحزمة
افتح القفل للوصول البطاقات البالغ عددها 60 في هذه المجموعة.
فتح الحزمة
k this deck
39
For data having a bell-shaped distribution, approximately _____ percent of the data values will be within one standard deviation of the mean.
A) 95
B) 66
C) 68
D) 97
A) 95
B) 66
C) 68
D) 97
فتح الحزمة
افتح القفل للوصول البطاقات البالغ عددها 60 في هذه المجموعة.
فتح الحزمة
k this deck
40
Compute the coefficient of variation for the following sample data. 32 41 36 24 29 30 40 22 25 37
A) 18.64 percent
B) 21.36 percent
C) 20.28 percent
D) 21.67 percent
A) 18.64 percent
B) 21.36 percent
C) 20.28 percent
D) 21.67 percent
فتح الحزمة
افتح القفل للوصول البطاقات البالغ عددها 60 في هذه المجموعة.
فتح الحزمة
k this deck
41
Consider a sample on the waiting times (in minutes) at the billing counter in a grocery store to be 15, 24, 18, 15, 21, 20, 15, 22, 19, 16, 15, 22, 20, 15, and 21. Compute the 25th, 50th, and 75th percentiles.
فتح الحزمة
افتح القفل للوصول البطاقات البالغ عددها 60 في هذه المجموعة.
فتح الحزمة
k this deck
42
Consider a sample on the waiting times (in minutes), at the billing counter in a grocery store, to be 15, 24, 18, 15, 21, 20, 15, 22, 19, 16, 15, 22, 20, 15, and 21. Compute the mean, median, and mode.
فتح الحزمة
افتح القفل للوصول البطاقات البالغ عددها 60 في هذه المجموعة.
فتح الحزمة
k this deck
43
The partial relative frequency distribution is given below:
a. What is the relative frequency of group 4?
b. The total sample size is 400. What is the frequency of group 4?
c. Show the frequency distribution.
d. Show the percent frequency distribution.
a. What is the relative frequency of group 4?
b. The total sample size is 400. What is the frequency of group 4?
c. Show the frequency distribution.
d. Show the percent frequency distribution.
فتح الحزمة
افتح القفل للوصول البطاقات البالغ عددها 60 في هذه المجموعة.
فتح الحزمة
k this deck
44
Suppose that the average time an employee takes to reach the office is 35 minutes. To address the issue of late comers, the mode of transport chosen by the employee is tracked: private transport (two-wheelers and four-wheelers) and public transport. The data on the average time (in minutes) taken using both a private transportation system and a public transportation system for a sample of employees are given below:
a. Considering the travel times (in minutes) of employees using private transport. Compute the z-score for the tenth employee with travel time of 29 minutes.
b. Considering the travel times (in minutes) of employees using public transport. Compute the z-score for the second employee with travel time of 29 minutes. How does this z-score compare with the z-score you calculated for part a?
c. Based on z-scores, do the data for employees using private transport and public transport contain any outliers?
فتح الحزمة
افتح القفل للوصول البطاقات البالغ عددها 60 في هذه المجموعة.
فتح الحزمة
k this deck
45
The results of a survey showed that on average, children spend 5.6 hours at PlayStation per week. Suppose that the standard deviation is 1.7 hours and that the number of hours at PlayStation follows a bell-shaped distribution.
a. Use the empirical rule to calculate the percentage of children who spend between 2.2 and 9 hours at PlayStation per week.
b. What is the z-value for a child who spends 7.5 hours at PlayStation per week?
c. What is the z-value for a child who spends 4.5 hours at PlayStation per week?
a. Use the empirical rule to calculate the percentage of children who spend between 2.2 and 9 hours at PlayStation per week.
b. What is the z-value for a child who spends 7.5 hours at PlayStation per week?
c. What is the z-value for a child who spends 4.5 hours at PlayStation per week?
فتح الحزمة
افتح القفل للوصول البطاقات البالغ عددها 60 في هذه المجموعة.
فتح الحزمة
k this deck
46
The following table provides information on the number of billionaires in a country and the continents on which these countries are located.
a. Sort the countries from largest to smallest based on the number of billionaires. What are the top 5 countries according to the number of billionaires? b. Filter the countries to display only the countries located in North America.
a. Sort the countries from largest to smallest based on the number of billionaires. What are the top 5 countries according to the number of billionaires? b. Filter the countries to display only the countries located in North America. فتح الحزمة
افتح القفل للوصول البطاقات البالغ عددها 60 في هذه المجموعة.
فتح الحزمة
k this deck
47
If covariance between two variables is near 0, then it implies that
A) there exists a positive relationship between the variables.
B) the variables are not linearly related.
C) the variables are negatively related.
D) the variables are strongly relateD)
A) there exists a positive relationship between the variables.
B) the variables are not linearly related.
C) the variables are negatively related.
D) the variables are strongly relateD)
فتح الحزمة
افتح القفل للوصول البطاقات البالغ عددها 60 في هذه المجموعة.
فتح الحزمة
k this deck
48
Suppose that you make a fixed deposit of $1,000 in Bank X, and $500 in Bank Y. The value of each investment at the end of each subsequent year is provided in the table:
Which of the two banks provide a better return over this time period?
Which of the two banks provide a better return over this time period?
فتح الحزمة
افتح القفل للوصول البطاقات البالغ عددها 60 في هذه المجموعة.
فتح الحزمة
k this deck
49
The manager of an automobile showroom studied the time spent by each salesman interacting with the customer in a month apart from the other jobs assigned to them. The data in hours are given below.
Using classes 1013, 1417, and so on, show: Using classes 10-13, 14-17, and so on, show:
The frequency distribution.
The relative frequency distribution.
The cumulative frequency distribution.
The cumulative relative frequency distribution.
The proportion of salesmen who spend 13 hours of time or less with the customers.
Prepare a histogram and comment on the shape of the distribution.
فتح الحزمة
افتح القفل للوصول البطاقات البالغ عددها 60 في هذه المجموعة.
فتح الحزمة
k this deck
50
A survey on the most preferred newspaper in USA listed The New York Times(TNYT), Washington Post(WP), Daily News(DN), New York Post(NYP), and Los Angeles Times (LAT) as the top five most preferred newspapers. The table below shows the preferences of 50 citizens.
a. Are these data categorical or quantitative?
b. Provide frequency and percent frequency distributions.
c. On the basis of the sample, which newspaper is preferred the most?
a. Are these data categorical or quantitative?
b. Provide frequency and percent frequency distributions.
c. On the basis of the sample, which newspaper is preferred the most?
فتح الحزمة
افتح القفل للوصول البطاقات البالغ عددها 60 في هذه المجموعة.
فتح الحزمة
k this deck
51
Suppose that the average time an employee takes to reach the office is 35 minutes. To address the issue of late comers, the mode of transport chosen by the employee is tracked: private transport (two-wheelers and four-wheelers) and public transport. The data on the average time (in minutes) taken using both a private transportation system and a public transportation system for a sample of employees are given below:
a. What are the mean and median travel times for employees using a private transport? What are the mean and median travel times for employees using a public transport?
b. What are the variance and standard deviation of travel times for employees using a private transport? What are the variance and standard deviation of travel times for employees using a public transport?
c. Comment.
فتح الحزمة
افتح القفل للوصول البطاقات البالغ عددها 60 في هذه المجموعة.
فتح الحزمة
k this deck
52
A student willing to participate in a debate competition required to fill a registration form. State whether each of the following information about the participant provides categorical or quantitative data.
a. What is your date of birth?
b. Have you participated in any debate competition previously?
c. If yes, how many debate competitions have you participated so far?
d. Have you won any of the competitions?
e. If yes, how many have you won?
a. What is your date of birth?
b. Have you participated in any debate competition previously?
c. If yes, how many debate competitions have you participated so far?
d. Have you won any of the competitions?
e. If yes, how many have you won?
فتح الحزمة
افتح القفل للوصول البطاقات البالغ عددها 60 في هذه المجموعة.
فتح الحزمة
k this deck
53
The average time a customer service executive takes to resolve an issue on a mobile handset is 26.4 minutes. The average time taken to resolve the issue by a sample of 15 such executives are shown below:
a. What is the mean resolution time?
b. What is the median resolution time?
c. What is the mode for these 15 executives?
d. What is the variance and standard deviation?
e. What is the third quartile?
a. What is the mean resolution time?
b. What is the median resolution time?
c. What is the mode for these 15 executives?
d. What is the variance and standard deviation?
e. What is the third quartile?
فتح الحزمة
افتح القفل للوصول البطاقات البالغ عددها 60 في هذه المجموعة.
فتح الحزمة
k this deck
54
The scores of a sample of students in a Math test are 20, 15, 19, 21, 22, 12, 17, 14, 24, 16 and in a Stat test are 16, 12, 19, 17, 22, 14, 20, 21, 24, 15, 13.
a. Compute the mean and median scores for both the Math and the Stat tests.
b. Compare the mean and median scores computed in part a. Comment.
a. Compute the mean and median scores for both the Math and the Stat tests.
b. Compare the mean and median scores computed in part a. Comment.
فتح الحزمة
افتح القفل للوصول البطاقات البالغ عددها 60 في هذه المجموعة.
فتح الحزمة
k this deck
55
The mentor of a class researched on the number of hours spent on study in a week by each student of the class, to analyze the correlation between the study hours and the marks obtained by each student. The data on the hours spent per week by 25 students are listed below:
a. What is the least amount of time a student spent per week on studying after school hours in this sample? The highest?
b. Use a class width of 2 hours to prepare a frequency distribution, a relative frequency distribution, and a percent frequency distribution for the data.
c. Prepare a histogram and comment on the shape of the distribution.
فتح الحزمة
افتح القفل للوصول البطاقات البالغ عددها 60 في هذه المجموعة.
فتح الحزمة
k this deck
56
Eight observations taken for two variables are as follows:
a. Develop a scatter diagram with x on the horizontal axis.
b. What does the scatter diagram developed in part a indicate about the relationship between the two variables?
c. Compute and interpret the sample covariance.
d. Compute and interpret the sample correlation coefficient.
a. Develop a scatter diagram with x on the horizontal axis.
b. What does the scatter diagram developed in part a indicate about the relationship between the two variables?
c. Compute and interpret the sample covariance.
d. Compute and interpret the sample correlation coefficient.
فتح الحزمة
افتح القفل للوصول البطاقات البالغ عددها 60 في هذه المجموعة.
فتح الحزمة
k this deck
57
The data on the percentage of visitors in the previous and current years at 12 well-known national parks of Unites States are given below:
a. Sort the parks in descending order by their current year's visitor percentage. Which park has the highest number of visitors in the current year? Which park has the lowest number of visitors in the current year?
b. Calculate the change in visitor percentage from the previous to the current year for each park. Use Excel's conditional formatting to highlight the park whose visitor percentage decreased from the previous year to the current year.
c. Use Excel's conditional formatting tool to create data bars for the change in visitor percentage from the previous year to the current year for each park calculated in part b.
فتح الحزمة
افتح القفل للوصول البطاقات البالغ عددها 60 في هذه المجموعة.
فتح الحزمة
k this deck
58
A study on the average minutes spent by students on internet usage is 300 with a standard deviation of 102. Answer the following questions assuming a bell-shaped distribution and using the empirical rule.
a. What percentage of students use internet for more than 402 minutes?
b. What percentage of students use internet for more than 504 minutes?
c. What percentage of students use internet between 198 minutes and 300 minutes?
a. What percentage of students use internet for more than 402 minutes?
b. What percentage of students use internet for more than 504 minutes?
c. What percentage of students use internet between 198 minutes and 300 minutes?
فتح الحزمة
افتح القفل للوصول البطاقات البالغ عددها 60 في هذه المجموعة.
فتح الحزمة
k this deck
59
The correlation coefficient will always take values
A) greater than 0.
B) between -1 and 0.
C) between -1 and +1.
D) less than -1.
A) greater than 0.
B) between -1 and 0.
C) between -1 and +1.
D) less than -1.
فتح الحزمة
افتح القفل للوصول البطاقات البالغ عددها 60 في هذه المجموعة.
فتح الحزمة
k this deck
60
Consider the following data on income and savings of a sample of residents in a locality:
a. Compute the correlation coefficient. Is there a positive correlation between the income and savings? What is your interpretation?
b. Show a scatter diagram of the relationship between the income and savings.
a. Compute the correlation coefficient. Is there a positive correlation between the income and savings? What is your interpretation?
b. Show a scatter diagram of the relationship between the income and savings.
فتح الحزمة
افتح القفل للوصول البطاقات البالغ عددها 60 في هذه المجموعة.
فتح الحزمة
k this deck
فتح الحزمة
افتح القفل للوصول البطاقات البالغ عددها 60 في هذه المجموعة.


