Deck 2: Frequency Distributions.
ملء الشاشة (f)
سؤال
سؤال
سؤال
سؤال
سؤال
سؤال
سؤال
سؤال
سؤال
سؤال
سؤال
سؤال
سؤال
سؤال
سؤال
سؤال
سؤال
سؤال
سؤال
سؤال
سؤال
سؤال
سؤال
سؤال
سؤال
سؤال
سؤال
سؤال
سؤال
سؤال
سؤال
سؤال
سؤال
سؤال
سؤال
سؤال
سؤال
How many individual scores are in the following distribution? 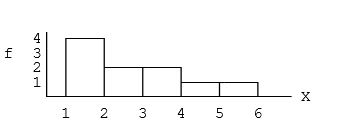
A)N = 5
B)N = 6
C)N = 10
D)cannot be determined
A)N = 5
B)N = 6
C)N = 10
D)cannot be determined
سؤال
سؤال
For the following distribution,what is ΣX? 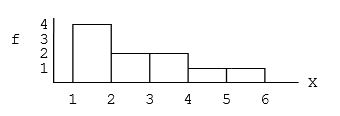
A)ΣX = 10
B)ΣX = 15
C)ΣX = 21
D)ΣX = 23
A)ΣX = 10
B)ΣX = 15
C)ΣX = 21
D)ΣX = 23
سؤال
سؤال
سؤال
سؤال
سؤال
سؤال
سؤال
سؤال
سؤال
سؤال
سؤال
سؤال
سؤال
سؤال
سؤال
سؤال
سؤال
سؤال
سؤال
سؤال
سؤال
سؤال
سؤال
سؤال
سؤال
سؤال
سؤال
سؤال
سؤال
سؤال
سؤال
سؤال
سؤال
سؤال
سؤال
سؤال
Find each value requested for the set of scores in the following frequency distribution table.
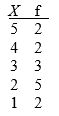
a.N
b.ΣX
c.ΣX²
a.N
b.ΣX
c.ΣX²
سؤال
سؤال
سؤال
سؤال
سؤال

فتح الحزمة
قم بالتسجيل لفتح البطاقات في هذه المجموعة!
Unlock Deck
Unlock Deck
1/83
العب
ملء الشاشة (f)
Deck 2: Frequency Distributions.
1
For the following data,N = _____.
A)10
B)11
C)28
D)Cannot be determined from the table
A)10
B)11
C)28
D)Cannot be determined from the table
11
2
A sample of n = 15 scores ranges from a high of X = 11 to a low of X = 3.If these scores are placed in a frequency distribution table,how many X values will be listed in the first column?
A)8
B)9
C)10
D)It depends on whether any scores have a zero frequency.
A)8
B)9
C)10
D)It depends on whether any scores have a zero frequency.
9
3
A set of scores ranges from a high of X = 72 to a low of X = 28.If these scores were put in a grouped frequency distribution table,what would be the best choice for the interval width?
A)2 points
B)5 points
C)7 points
D)10 points
A)2 points
B)5 points
C)7 points
D)10 points
5 points
4
For the data in the following table,what is the value of ?X?
A)10
B)15
C)20
D)Cannot be determined from the table
A)10
B)15
C)20
D)Cannot be determined from the table
فتح الحزمة
افتح القفل للوصول البطاقات البالغ عددها 83 في هذه المجموعة.
فتح الحزمة
k this deck
5
A set of scores ranges from a high of X = 24 to a low of X = 5.If these scores were put in a frequency distribution table with an interval width of 2 points,which of the following would be the top interval in the table?
A)4-5
B)23-24
C)24-25
D)22-24
A)4-5
B)23-24
C)24-25
D)22-24
فتح الحزمة
افتح القفل للوصول البطاقات البالغ عددها 83 في هذه المجموعة.
فتح الحزمة
k this deck
6
For the following frequency distribution of exam scores,how many students had scores higher than X = 79?
A)7
B)12
C)19
D)Cannot be determined
A)7
B)12
C)19
D)Cannot be determined
فتح الحزمة
افتح القفل للوصول البطاقات البالغ عددها 83 في هذه المجموعة.
فتح الحزمة
k this deck
7
For the following distribution,how many people had scores less than X = 19?
A)5
B)10
C)11
D)Cannot be determined
A)5
B)10
C)11
D)Cannot be determined
فتح الحزمة
افتح القفل للوصول البطاقات البالغ عددها 83 في هذه المجموعة.
فتح الحزمة
k this deck
8
For the following frequency distribution of quiz scores,how many individuals took the quiz?
A)5
B)15
C)21
D)Cannot be determined
A)5
B)15
C)21
D)Cannot be determined
فتح الحزمة
افتح القفل للوصول البطاقات البالغ عددها 83 في هذه المجموعة.
فتح الحزمة
k this deck
9
For the following frequency distribution of exam scores,what is the lowest score on the exam?
A)X = 70
B)X = 74
C)X = 90
D)Cannot be determined
A)X = 70
B)X = 74
C)X = 90
D)Cannot be determined
فتح الحزمة
افتح القفل للوصول البطاقات البالغ عددها 83 في هذه المجموعة.
فتح الحزمة
k this deck
10
What is the total number of scores for the distribution shown in the following table?
A)4
B)10
C)14
D)37
A)4
B)10
C)14
D)37
فتح الحزمة
افتح القفل للوصول البطاقات البالغ عددها 83 في هذه المجموعة.
فتح الحزمة
k this deck
11
A biologist records the number of trout,bass,perch,and other types of fish caught in a local lake during a 2-week period.If the results are organized in a frequency distribution table,what values would be listed in the first column?
A)Frequencies
B)Different types of fish
C)The 14 days
D)The days of the week
A)Frequencies
B)Different types of fish
C)The 14 days
D)The days of the week
فتح الحزمة
افتح القفل للوصول البطاقات البالغ عددها 83 في هذه المجموعة.
فتح الحزمة
k this deck
12
In a grouped frequency distribution,one interval is listed as 50-59.Assuming that the scores are measuring a continuous variable,what are the real limits for this interval?
A)50 and 59
B)50.5 and 59.5
C)49.5 and 59.5
D)49.5 and 60.5
A)50 and 59
B)50.5 and 59.5
C)49.5 and 59.5
D)49.5 and 60.5
فتح الحزمة
افتح القفل للوصول البطاقات البالغ عددها 83 في هذه المجموعة.
فتح الحزمة
k this deck
13
For the following frequency distribution of exam scores,how many students had scores lower than X = 80?
A)2
B)3
C)7
D)Cannot be determined
A)2
B)3
C)7
D)Cannot be determined
فتح الحزمة
افتح القفل للوصول البطاقات البالغ عددها 83 في هذه المجموعة.
فتح الحزمة
k this deck
14
For the following distribution of quiz scores,if a score of X = 3 or higher is needed for a passing grade,how many individuals failed the quiz?
A)2 X f
B)3 5 6
C)5 4 5
D)10 3 5 2 3
1 2
A)2 X f
B)3 5 6
C)5 4 5
D)10 3 5 2 3
1 2
فتح الحزمة
افتح القفل للوصول البطاقات البالغ عددها 83 في هذه المجموعة.
فتح الحزمة
k this deck
15
A set of scores ranges from a high of X = 96 to a low of X = 11.If these scores were placed in a grouped frequency distribution table,what is the best value for the interval width?
A)5 points
B)8 points
C)9 points
D)10 points
A)5 points
B)8 points
C)9 points
D)10 points
فتح الحزمة
افتح القفل للوصول البطاقات البالغ عددها 83 في هذه المجموعة.
فتح الحزمة
k this deck
16
For the following distribution of quiz scores,how many individuals had a score of X = 2?
A)1
B)3
C)5
D)Cannot be determined
A)1
B)3
C)5
D)Cannot be determined
فتح الحزمة
افتح القفل للوصول البطاقات البالغ عددها 83 في هذه المجموعة.
فتح الحزمة
k this deck
17
For the following distribution,what percentage of the individuals have scores of X = 1?
A)2%
B)5%
C)10%
D)20%
A)2%
B)5%
C)10%
D)20%
فتح الحزمة
افتح القفل للوصول البطاقات البالغ عددها 83 في هذه المجموعة.
فتح الحزمة
k this deck
18
A researcher surveys a sample of n = 200 college students and asks each person to identify his or her favorite movie from the past year.If the data were organized in a frequency distribution table,what would be listed in the first column?
A)A list of movies
B)A list of students
C)A list of frequencies
D)None of the other options is correct
A)A list of movies
B)A list of students
C)A list of frequencies
D)None of the other options is correct
فتح الحزمة
افتح القفل للوصول البطاقات البالغ عددها 83 في هذه المجموعة.
فتح الحزمة
k this deck
19
For the following frequency distribution,what is ?X?
A)8
B)90
C)110
D)Cannot be determined
A)8
B)90
C)110
D)Cannot be determined
فتح الحزمة
افتح القفل للوصول البطاقات البالغ عددها 83 في هذه المجموعة.
فتح الحزمة
k this deck
20
For the scores in the following table,what is the value of ?X²?
A)30
B)41
C)65
D)225
A)30
B)41
C)65
D)225
فتح الحزمة
افتح القفل للوصول البطاقات البالغ عددها 83 في هذه المجموعة.
فتح الحزمة
k this deck
21
If the following distribution were shown in a histogram,the width of the bar above the 15-19 interval would reach from _____ to _____.
A)X = 14.5 to X = 19.5
B)X = 15.5 to X = 18.5
C)X = 15.5 to X = 19.5
D)X = 15.0 to X = 19.0
A)X = 14.5 to X = 19.5
B)X = 15.5 to X = 18.5
C)X = 15.5 to X = 19.5
D)X = 15.0 to X = 19.0
فتح الحزمة
افتح القفل للوصول البطاقات البالغ عددها 83 في هذه المجموعة.
فتح الحزمة
k this deck
22
For the following distribution,what is the highest score?
A)5
B)20
C)24
D)Cannot be determined
A)5
B)20
C)24
D)Cannot be determined
فتح الحزمة
افتح القفل للوصول البطاقات البالغ عددها 83 في هذه المجموعة.
فتح الحزمة
k this deck
23
If a distribution of scores is shown in a bar graph,you know that the scores were measured on a(n)_________ scale of measurement.
A)nominal or ordinal
B)ordinal or interval
C)interval or ratio
D)discrete or continuous
A)nominal or ordinal
B)ordinal or interval
C)interval or ratio
D)discrete or continuous
فتح الحزمة
افتح القفل للوصول البطاقات البالغ عددها 83 في هذه المجموعة.
فتح الحزمة
k this deck
24
For the following distribution,what is the width of each class interval?
A)4
B)4.5
C)5
D)10
A)4
B)4.5
C)5
D)10
فتح الحزمة
افتح القفل للوصول البطاقات البالغ عددها 83 في هذه المجموعة.
فتح الحزمة
k this deck
25
For the following distribution,how many people have scores greater than X = 14?
A)2
B)5
C)7
D)11
A)2
B)5
C)7
D)11
فتح الحزمة
افتح القفل للوصول البطاقات البالغ عددها 83 في هذه المجموعة.
فتح الحزمة
k this deck
26
What kind of frequency distribution graph shows the frequencies as bars that are separated by spaces?
A)A bar graph
B)A histogram
C)A polygon
D)All of these
A)A bar graph
B)A histogram
C)A polygon
D)All of these
فتح الحزمة
افتح القفل للوصول البطاقات البالغ عددها 83 في هذه المجموعة.
فتح الحزمة
k this deck
27
What frequency distribution graph is appropriate for scores measured on a nominal scale?
A)Only a histogram
B)Only a polygon
C)Either a histogram or a polygon
D)Only a bar graph
A)Only a histogram
B)Only a polygon
C)Either a histogram or a polygon
D)Only a bar graph
فتح الحزمة
افتح القفل للوصول البطاقات البالغ عددها 83 في هذه المجموعة.
فتح الحزمة
k this deck
28
In a frequency distribution graph,frequencies are presented on the ,and the scores (categories)are listed on the .
A)X axis; Y axis
B)horizontal line; vertical line
C)Y axis; X axis
D)class interval; horizontal line
A)X axis; Y axis
B)horizontal line; vertical line
C)Y axis; X axis
D)class interval; horizontal line
فتح الحزمة
افتح القفل للوصول البطاقات البالغ عددها 83 في هذه المجموعة.
فتح الحزمة
k this deck
29
A researcher surveys a sample of n = 200 college students and asks each person to identify his or her favorite movie from the past year.If the results were presented in a frequency distribution graph,what kind of graph would be appropriate?
A)A histogram
B)A polygon
C)A histogram or a polygon
D)A bar graph
A)A histogram
B)A polygon
C)A histogram or a polygon
D)A bar graph
فتح الحزمة
افتح القفل للوصول البطاقات البالغ عددها 83 في هذه المجموعة.
فتح الحزمة
k this deck
30
After recording the final grade (A,B,C,D,F)for each individual in a class of N = 26 students,the professor would like to display the grade distribution in a frequency distribution graph.What kind of graph should be used?
A)A bar graph
B)A histogram
C)A polygon
D)Either a histogram or a polygon
A)A bar graph
B)A histogram
C)A polygon
D)Either a histogram or a polygon
فتح الحزمة
افتح القفل للوصول البطاقات البالغ عددها 83 في هذه المجموعة.
فتح الحزمة
k this deck
31
If a set of scores is displayed in a frequency distribution bar graph,what scale of measurement was used to measure the scores?
A)Nominal
B)Ordinal
C)Nominal or ordinal
D)Interval or ratio
A)Nominal
B)Ordinal
C)Nominal or ordinal
D)Interval or ratio
فتح الحزمة
افتح القفل للوصول البطاقات البالغ عددها 83 في هذه المجموعة.
فتح الحزمة
k this deck
32
A biologist records the number of trout,bass,perch,and other types of fish caught in a local lake during a 2-week period.If the results are organized in a frequency distribution graph,what kind of graph should be used?
A)A bar graph
B)A histogram
C)A polygon
D)Either a histogram or a polygon
A)A bar graph
B)A histogram
C)A polygon
D)Either a histogram or a polygon
فتح الحزمة
افتح القفل للوصول البطاقات البالغ عددها 83 في هذه المجموعة.
فتح الحزمة
k this deck
33
If a set of scores is displayed in a frequency distribution polygon,what scale of measurement was used to measure the scores?
A)Nominal or ordinal
B)Interval
C)Ratio
D)Interval or ratio
A)Nominal or ordinal
B)Interval
C)Ratio
D)Interval or ratio
فتح الحزمة
افتح القفل للوصول البطاقات البالغ عددها 83 في هذه المجموعة.
فتح الحزمة
k this deck
34
A researcher collects a sample of n = 20 Introductory Psychology textbooks and records the number of pages in each book.The results are then placed in a grouped frequency distribution table using intervals of 0-99 pages,100-199 pages,200-299 pages,and so on.If the results were converted into a frequency distribution graph,what kind of graph should be used?
A)A bar graph
B)A histogram
C)A polygon
D)Either a histogram or a polygon
A)A bar graph
B)A histogram
C)A polygon
D)Either a histogram or a polygon
فتح الحزمة
افتح القفل للوصول البطاقات البالغ عددها 83 في هذه المجموعة.
فتح الحزمة
k this deck
35
The normal distribution is an example of
A)a histogram showing data from a sample.
B)a polygon showing data from a sample.
C)a bar graph showing data from a population.
D)a smooth curve showing data from a population.
A)a histogram showing data from a sample.
B)a polygon showing data from a sample.
C)a bar graph showing data from a population.
D)a smooth curve showing data from a population.
فتح الحزمة
افتح القفل للوصول البطاقات البالغ عددها 83 في هذه المجموعة.
فتح الحزمة
k this deck
36
A frequency distribution graph represents frequencies with vertical bars without space between them.What scale of measurement was used to measure the scores?
A)Nominal
B)Ordinal
C)Nominal or ordinal
D)Interval or ratio
A)Nominal
B)Ordinal
C)Nominal or ordinal
D)Interval or ratio
فتح الحزمة
افتح القفل للوصول البطاقات البالغ عددها 83 في هذه المجموعة.
فتح الحزمة
k this deck
37
How many individual scores are in the following distribution?
A)N = 5
B)N = 6
C)N = 10
D)cannot be determined
A)N = 5
B)N = 6
C)N = 10
D)cannot be determined
فتح الحزمة
افتح القفل للوصول البطاقات البالغ عددها 83 في هذه المجموعة.
فتح الحزمة
k this deck
38
Which types of graphs are used for data from an interval scale?
A)Histograms and bar graphs
B)Polygons and bar graphs
C)Histograms and polygons
D)Histograms, bar graphs, and polygons
A)Histograms and bar graphs
B)Polygons and bar graphs
C)Histograms and polygons
D)Histograms, bar graphs, and polygons
فتح الحزمة
افتح القفل للوصول البطاقات البالغ عددها 83 في هذه المجموعة.
فتح الحزمة
k this deck
39
For the following distribution,what is ΣX?
A)ΣX = 10
B)ΣX = 15
C)ΣX = 21
D)ΣX = 23
A)ΣX = 10
B)ΣX = 15
C)ΣX = 21
D)ΣX = 23
فتح الحزمة
افتح القفل للوصول البطاقات البالغ عددها 83 في هذه المجموعة.
فتح الحزمة
k this deck
40
What kind of frequency distribution graph shows the frequencies as bars,with no space between adjacent bars?
A)A bar graph
B)A histogram
C)A polygon
D)All of these
A)A bar graph
B)A histogram
C)A polygon
D)All of these
فتح الحزمة
افتح القفل للوصول البطاقات البالغ عددها 83 في هذه المجموعة.
فتح الحزمة
k this deck
41
The students in a psychology class seemed to think that the midterm exam was very easy.If they are correct,what is the most likely shape for the distribution of exam scores?
A)Symmetrical
B)Positively skewed
C)Negatively skewed
D)Normal
A)Symmetrical
B)Positively skewed
C)Negatively skewed
D)Normal
فتح الحزمة
افتح القفل للوصول البطاقات البالغ عددها 83 في هذه المجموعة.
فتح الحزمة
k this deck
42
It is customary to list the score categories in a frequency distribution from the highest down to the lowest.
فتح الحزمة
افتح القفل للوصول البطاقات البالغ عددها 83 في هذه المجموعة.
فتح الحزمة
k this deck
43
For the following distribution of scores,?X = 18.
فتح الحزمة
افتح القفل للوصول البطاقات البالغ عددها 83 في هذه المجموعة.
فتح الحزمة
k this deck
44
If a set of exam scores forms a negatively skewed distribution,what can you likely conclude about the students' scores?
A)Most of the students had relatively high scores.
B)Most of the students had relatively low scores.
C)About an equal number of students had relatively high and relatively low scores.
D)It is not possible to draw any conclusions about students' scores.
A)Most of the students had relatively high scores.
B)Most of the students had relatively low scores.
C)About an equal number of students had relatively high and relatively low scores.
D)It is not possible to draw any conclusions about students' scores.
فتح الحزمة
افتح القفل للوصول البطاقات البالغ عددها 83 في هذه المجموعة.
فتح الحزمة
k this deck
45
A skewed distribution typically has _____ tail(s)and a normal distribution has ____ tail(s).
A)1; 1
B)1; 2
C)2; 1
D)2; 2
A)1; 1
B)1; 2
C)2; 1
D)2; 2
فتح الحزمة
افتح القفل للوصول البطاقات البالغ عددها 83 في هذه المجموعة.
فتح الحزمة
k this deck
46
If a distribution with more than 15 or 20 possible scores is being organized in a frequency distribution table,a grouped table should be used.
فتح الحزمة
افتح القفل للوصول البطاقات البالغ عددها 83 في هذه المجموعة.
فتح الحزمة
k this deck
47
What term is used to describe the shape of a distribution in which the scores pile up on the left-hand side of the graph and taper off to the right?
A)Symmetrical
B)Positively skewed
C)Negatively skewed
D)Normal
A)Symmetrical
B)Positively skewed
C)Negatively skewed
D)Normal
فتح الحزمة
افتح القفل للوصول البطاقات البالغ عددها 83 في هذه المجموعة.
فتح الحزمة
k this deck
48
In a grouped frequency distribution table,one interval is identified as 30-34.This interval has a width of 5 points.
فتح الحزمة
افتح القفل للوصول البطاقات البالغ عددها 83 في هذه المجموعة.
فتح الحزمة
k this deck
49
A group of quiz scores ranges from 3 to 10,but no student had a score of X = 5.If the scores are put in a frequency distribution table,X = 5 would not be listed in the X column.
فتح الحزمة
افتح القفل للوصول البطاقات البالغ عددها 83 في هذه المجموعة.
فتح الحزمة
k this deck
50
What is the shape of the distribution for the following set of data?
A)Symmetrical
B)Positively skewed
C)Negatively skewed
D)Normal
A)Symmetrical
B)Positively skewed
C)Negatively skewed
D)Normal
فتح الحزمة
افتح القفل للوصول البطاقات البالغ عددها 83 في هذه المجموعة.
فتح الحزمة
k this deck
51
If a set of exam scores forms a symmetrical distribution,what can you likely conclude about the students' scores?
A)Most of the students had relatively high scores.
B)Most of the students had relatively low scores.
C)About an equal number of students had relatively high and relatively low scores.
D)It is not possible to draw any conclusions about students' scores.
A)Most of the students had relatively high scores.
B)Most of the students had relatively low scores.
C)About an equal number of students had relatively high and relatively low scores.
D)It is not possible to draw any conclusions about students' scores.
فتح الحزمة
افتح القفل للوصول البطاقات البالغ عددها 83 في هذه المجموعة.
فتح الحزمة
k this deck
52
What is the shape of the distribution for the following set of data?
A)Symmetrical
B)Positively skewed
C)Negatively skewed
D)Normal
A)Symmetrical
B)Positively skewed
C)Negatively skewed
D)Normal
فتح الحزمة
افتح القفل للوصول البطاقات البالغ عددها 83 في هذه المجموعة.
فتح الحزمة
k this deck
53
A grouped frequency distribution table lists one interval as 20-29.The width of this interval is 9 points.
فتح الحزمة
افتح القفل للوصول البطاقات البالغ عددها 83 في هذه المجموعة.
فتح الحزمة
k this deck
54
What is the shape of the distribution for the following set of data? Scores: 1,2,3,3,4,4,4 5,5,5,5,6
A)Symmetrical
B)Positively skewed
C)Negatively skewed
D)Normal
A)Symmetrical
B)Positively skewed
C)Negatively skewed
D)Normal
فتح الحزمة
افتح القفل للوصول البطاقات البالغ عددها 83 في هذه المجموعة.
فتح الحزمة
k this deck
55
If a set of scores covers a range of 80 points,then the grouped frequency table for the scores should use an interval width of 8 points.
فتح الحزمة
افتح القفل للوصول البطاقات البالغ عددها 83 في هذه المجموعة.
فتح الحزمة
k this deck
56
For the following distribution of scores,?X² = 92.
فتح الحزمة
افتح القفل للوصول البطاقات البالغ عددها 83 في هذه المجموعة.
فتح الحزمة
k this deck
57
For the following distribution of scores,20% of the individuals have scores of X = 1.
فتح الحزمة
افتح القفل للوصول البطاقات البالغ عددها 83 في هذه المجموعة.
فتح الحزمة
k this deck
58
In a distribution with positive skew,scores with the highest frequencies are _____.
A)on the right side of the distribution
B)on the left side of the distribution
C)in the middle of the distribution
D)represented at two distinct peaks
A)on the right side of the distribution
B)on the left side of the distribution
C)in the middle of the distribution
D)represented at two distinct peaks
فتح الحزمة
افتح القفل للوصول البطاقات البالغ عددها 83 في هذه المجموعة.
فتح الحزمة
k this deck
59
For the distribution shown in the following table,N = 5.
فتح الحزمة
افتح القفل للوصول البطاقات البالغ عددها 83 في هذه المجموعة.
فتح الحزمة
k this deck
60
A researcher surveys a sample of n = 200 college students and asks each person to identify his or her favorite movie from the past year.If the data were organized in a frequency distribution table,the first column would be a list of movies.
فتح الحزمة
افتح القفل للوصول البطاقات البالغ عددها 83 في هذه المجموعة.
فتح الحزمة
k this deck
61
In a grouped frequency distribution table,the top value in each class interval should be a multiple of the interval width.
فتح الحزمة
افتح القفل للوصول البطاقات البالغ عددها 83 في هذه المجموعة.
فتح الحزمة
k this deck
62
A sports historian recorded the number of times that the New York Yankees finished 1ˢᵗ,2ⁿᵈ,3ʳᵈ,and so on,in their division for the past 20 years.If the results are presented in a frequency distribution graph,then a histogram must be used.
فتح الحزمة
افتح القفل للوصول البطاقات البالغ عددها 83 في هذه المجموعة.
فتح الحزمة
k this deck
63
The normal distribution is an example of a symmetrical distribution.
فتح الحزمة
افتح القفل للوصول البطاقات البالغ عددها 83 في هذه المجموعة.
فتح الحزمة
k this deck
64
A grouped frequency distribution table does not provide enough information to obtain a complete listing of the original set of scores.
فتح الحزمة
افتح القفل للوصول البطاقات البالغ عددها 83 في هذه المجموعة.
فتح الحزمة
k this deck
65
In a positively skewed distribution,the scores pile up on the left side of the distribution and taper off to the right.
فتح الحزمة
افتح القفل للوصول البطاقات البالغ عددها 83 في هذه المجموعة.
فتح الحزمة
k this deck
66
If a set of exam scores forms a negatively skewed distribution,it suggests that the majority of the students did not score well on the exam.
فتح الحزمة
افتح القفل للوصول البطاقات البالغ عددها 83 في هذه المجموعة.
فتح الحزمة
k this deck
67
A space is left between adjacent bars in a bar graph.
فتح الحزمة
افتح القفل للوصول البطاقات البالغ عددها 83 في هذه المجموعة.
فتح الحزمة
k this deck
68
A set of scores ranges from a low of X = 18 to a high of X = 98.If the scores are put in a grouped frequency distribution table with an interval width of 10 points,the bottom interval should be 10-19.
فتح الحزمة
افتح القفل للوصول البطاقات البالغ عددها 83 في هذه المجموعة.
فتح الحزمة
k this deck
69
A professor records the number of students who are absent each day for the semester.Because this is a discrete variable,a bar graph should be used to show the frequency distribution.
فتح الحزمة
افتح القفل للوصول البطاقات البالغ عددها 83 في هذه المجموعة.
فتح الحزمة
k this deck
70
The scores for a very easy exam would probably form a positively skewed distribution.
فتح الحزمة
افتح القفل للوصول البطاقات البالغ عددها 83 في هذه المجموعة.
فتح الحزمة
k this deck
71
If a frequency distribution is presented in a polygon,then the scores were measured on an interval or a ratio scale.
فتح الحزمة
افتح القفل للوصول البطاقات البالغ عددها 83 في هذه المجموعة.
فتح الحزمة
k this deck
72
For the following distribution,11 people have scores greater than X = 14.
فتح الحزمة
افتح القفل للوصول البطاقات البالغ عددها 83 في هذه المجموعة.
فتح الحزمة
k this deck
73
A histogram is constructed so that adjacent bars touch.
فتح الحزمة
افتح القفل للوصول البطاقات البالغ عددها 83 في هذه المجموعة.
فتح الحزمة
k this deck
74
A set of scores ranges from X = 18 to X = 91.If the scores were put in a grouped frequency distribution table with an interval width of 10 points,the top interval would be 91-100.
فتح الحزمة
افتح القفل للوصول البطاقات البالغ عددها 83 في هذه المجموعة.
فتح الحزمة
k this deck
75
Find each value requested for the set of scores in the following frequency distribution table.
a.N
b.ΣX
c.ΣX²
a.N
b.ΣX
c.ΣX²
فتح الحزمة
افتح القفل للوصول البطاقات البالغ عددها 83 في هذه المجموعة.
فتح الحزمة
k this deck
76
In February in New York,the daily high temperatures are typically low with only a few relatively warm days.A frequency distribution showing the daily high temperatures would probably form a negatively skewed distribution.
فتح الحزمة
افتح القفل للوصول البطاقات البالغ عددها 83 في هذه المجموعة.
فتح الحزمة
k this deck
77
The classrooms in the Psychology department are numbered from 100 to 108.A professor records the number of classes held in each room during the fall semester.If the results were presented in a frequency distribution graph,the professor should use a bar graph.
فتح الحزمة
افتح القفل للوصول البطاقات البالغ عددها 83 في هذه المجموعة.
فتح الحزمة
k this deck
78
If it is appropriate to present a distribution of scores in a polygon,then it would also be appropriate to present the scores in a bar graph.
فتح الحزمة
افتح القفل للوصول البطاقات البالغ عددها 83 في هذه المجموعة.
فتح الحزمة
k this deck
79
A set of scores ranging from a high of 47 to a low of 6 is organized in a grouped frequency distribution table using an interval width of 5 points.If the distribution is shown in a graph,then a histogram or polygon should be used.
فتح الحزمة
افتح القفل للوصول البطاقات البالغ عددها 83 في هذه المجموعة.
فتح الحزمة
k this deck
80
In the following distribution,the scores are grouped into class intervals that are each 5 points wide.
فتح الحزمة
افتح القفل للوصول البطاقات البالغ عددها 83 في هذه المجموعة.
فتح الحزمة
k this deck
فتح الحزمة
افتح القفل للوصول البطاقات البالغ عددها 83 في هذه المجموعة.


