Deck 11: Statistically Based Quality Improvement for Variables
ملء الشاشة (f)
سؤال
سؤال
سؤال
سؤال
سؤال
سؤال
سؤال
سؤال
سؤال
سؤال
سؤال
سؤال
سؤال
سؤال
سؤال
سؤال
سؤال
سؤال
سؤال
سؤال
سؤال
سؤال
سؤال
سؤال
سؤال
سؤال
سؤال
سؤال
The ________ chart is used in monitoring process dispersion.
A) chart
chart
B) c chart
C) p chart
D) R chart
E) X chart
A)
chartB) c chart
C) p chart
D) R chart
E) X chart
سؤال
سؤال
The  chart is a process chart used to monitor the ________ of the characteristic being measured.
A) range
B) average
C) mode
D) median
E) standard deviation
chart is a process chart used to monitor the ________ of the characteristic being measured.A) range
B) average
C) mode
D) median
E) standard deviation
سؤال
سؤال
سؤال
The ________ is a process chart used to monitor the average of the characteristic being measured.
A) chart
chart
B) R chart
C) c chart
D) p chart
E) MR chart
A)
chartB) R chart
C) c chart
D) p chart
E) MR chart
سؤال
سؤال
سؤال
سؤال
سؤال
سؤال
سؤال
سؤال
سؤال
سؤال
سؤال
Although  charts generally are preferred for variables data, sometimes it is too time consuming or inconvenient to compute subgroup averages. In these cases, a(n) ________ is used.
A) chart
chart
B) X chart
C) p chart
D) s chart
E) R chart
charts generally are preferred for variables data, sometimes it is too time consuming or inconvenient to compute subgroup averages. In these cases, a(n) ________ is used.A)
chartB) X chart
C) p chart
D) s chart
E) R chart
سؤال
Use the following table to answer the question(s) below.
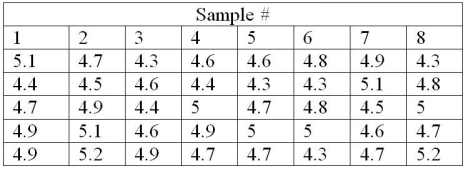
A machine shop owner wishes to monitor the diameter of an engine boring operation where the piston bore should be 4.25". He obtains 8 samples of 5 and records the data in the table above. What should the lower and upper control limits be for an X-bar chart?
A) (5.00, 8.00)
B) (-1.50, 1.50)
C) (4.33, 5.12)
D) (0.00, 1.45)
E) (-5.10, 5.10)
سؤال
سؤال
سؤال
سؤال
Use the following table to answer the question(s) below.
A machine shop owner wishes to monitor the diameter of an engine boring operation where the piston bore should be 4.25". He obtains 8 samples of 5 and records the data in the table above. What should the upper and lower control limits be for an R chart?
A) (5.00, 8.00)
B) (0.00, 2.50)
C) (4.33, 5.12)
D) (0.00, 1.45)
E) (-5.10, 5.10)
سؤال
Use the following table to answer the question(s) below.
A machine shop owner wishes to monitor the diameter of an engine boring operation where the piston bore should be 4.25". He obtains 8 samples of 5 and records the data in the table above. What should the center line be for a chart that monitors process average?
A) 4.58
B) 4.66
C) 4.73
D) 4.78
E) 4.82
سؤال
Use the following table to answer the question(s) below.
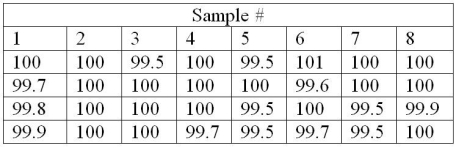
Close tolerances are required in the manufacturing section of an automotive parts business. Since the customers demand quality, the owner wants to monitor the operation closely using statistical process control. After taking 8 samples of size 4, the owner finds himself with the data in the table above. What are the lower and upper limits for a chart that will monitor process average?
A) (99.68, 100.36)
B) (99.56, 100.21)
C) (99.41, 100.59)
D) (99.38, 100.82)
E) (99.99, 100.01)
سؤال
سؤال
سؤال
Use the following table to answer the question(s) below.
A machine shop owner wishes to monitor the diameter of an engine boring operation where the piston bore should be 4.25". He obtains 8 samples of 5 and records the data in the table above. What should the center line be for a chart that monitors process dispersion?
A) 0.50
B) 0.55
C) 0.60
D) 0.69
E) 0.80
سؤال
Use the following table to answer the question(s) below.
Close tolerances are required in the manufacturing section of an automotive parts business. Since the customers demand quality, the owner wants to monitor the operation closely using statistical process control. After taking 8 samples of size 4, the owner finds himself with the data in the table above. What is the center line for a chart that will monitor process dispersion?
A) 0.45
B) 0.30
C) 0.00
D) 0.75
E) cannot be determined from the information given
سؤال
Use the following table to answer the question(s) below.
Close tolerances are required in the manufacturing section of an automotive parts business. Since the customers demand quality, the owner wants to monitor the operation closely using statistical process control. After taking 8 samples of size 4, the owner records the data in the table above. What are the lower and upper limits for a chart that will monitor process dispersion?
A) (0.00, 1.85)
B) (0.00, 2.11)
C) (0.00, 2.28)
D) (0.00, 1.03)
E) (0.00, 1.45)
سؤال
Use the following table to answer the question(s) below.
Close tolerances are required in the manufacturing section of an automotive parts business. Since the customers demand quality, the owner wants to monitor the operation closely using statistical process control. After taking 8 samples of size 4, the owner finds himself with the data in the table above. What is the center line for a chart that will monitor process average?
A) 100.20
B) 102.00
C) 99.88
D) 98.00
E) cannot be determined from the information given
سؤال
سؤال
سؤال
سؤال
سؤال
سؤال
سؤال
سؤال
سؤال
سؤال
سؤال
سؤال
سؤال
سؤال
سؤال
سؤال
The upper and lower specifications for metal head plates are 5  0.1 cm. A sample of the metal head plates in 25 undergraduates yields a mean of 5.05. We know that the population standard deviation is 0.04. What is the population capability index?
A) 2.15
B) 2.51
C) 1.25
D) 1.52
E) 0.42
0.1 cm. A sample of the metal head plates in 25 undergraduates yields a mean of 5.05. We know that the population standard deviation is 0.04. What is the population capability index?A) 2.15
B) 2.51
C) 1.25
D) 1.52
E) 0.42
سؤال
سؤال
سؤال
سؤال
سؤال
سؤال
The upper and lower specifications for metal head plates are 5  0.1 cm. A sample of the metal head plates in 25 undergraduates yields a mean of 5.05. What is the population standard deviation if the population capability index is 1.666?
A) 0.01
B) 0.02
C) 0.03
D) 0.04
E) 0.05
0.1 cm. A sample of the metal head plates in 25 undergraduates yields a mean of 5.05. What is the population standard deviation if the population capability index is 1.666?A) 0.01
B) 0.02
C) 0.03
D) 0.04
E) 0.05
سؤال

فتح الحزمة
قم بالتسجيل لفتح البطاقات في هذه المجموعة!
Unlock Deck
Unlock Deck
1/105
العب
ملء الشاشة (f)
Deck 11: Statistically Based Quality Improvement for Variables
1
________ variation is centered on a mean and occurs with a somewhat consistent amount of dispersion.
A) Nonrandom
B) Specific
C) Systematic
D) Abnormal
E) Random
A) Nonrandom
B) Specific
C) Systematic
D) Abnormal
E) Random
E
2
________ variation results from some event, such as shift in a process mean or some unexpected occurrence.
A) Uncontrollable
B) Nonrandom
C) Stochastic
D) Random
E) Indefinite
A) Uncontrollable
B) Nonrandom
C) Stochastic
D) Random
E) Indefinite
B
3
To ________ means to sample in such a way that every piece of product has an equal chance of being selected for inspection.
A) randomize
B) optimize
C) stabilize
D) rectify
E) modify
A) randomize
B) optimize
C) stabilize
D) rectify
E) modify
A
4
Which of the following is true of nonrandom variation?
A) It is uncontrollable.
B) It is centered on a mean.
C) It occurs with a somewhat consistent amount of dispersion.
D) It results from a shift in a process mean or some unexpected occurrence.
E) It results in a process that is repeatable.
A) It is uncontrollable.
B) It is centered on a mean.
C) It occurs with a somewhat consistent amount of dispersion.
D) It results from a shift in a process mean or some unexpected occurrence.
E) It results in a process that is repeatable.
فتح الحزمة
افتح القفل للوصول البطاقات البالغ عددها 105 في هذه المجموعة.
فتح الحزمة
k this deck
5
A ________ subgroup is a group of data that is logically homogeneous.
A) primary
B) rational
C) process
D) variable
E) stable
A) primary
B) rational
C) process
D) variable
E) stable
فتح الحزمة
افتح القفل للوصول البطاقات البالغ عددها 105 في هذه المجموعة.
فتح الحزمة
k this deck
6
Variation within the data in a ________ subgroup can provide a yardstick for computing limits on the standard variation between subgroups.
A) process
B) variable
C) primary
D) stable
E) rational
A) process
B) variable
C) primary
D) stable
E) rational
فتح الحزمة
افتح القفل للوصول البطاقات البالغ عددها 105 في هذه المجموعة.
فتح الحزمة
k this deck
7
To ensure that processes are stable, data are gathered in ________.
A) batches
B) networks
C) samples
D) lots
E) sets
A) batches
B) networks
C) samples
D) lots
E) sets
فتح الحزمة
افتح القفل للوصول البطاقات البالغ عددها 105 في هذه المجموعة.
فتح الحزمة
k this deck
8
Which of the following is not one of the alternative names for one hundred percent samples?
A) screening samples
B) sorting samples
C) rectifying samples
D) detailing samples
E) stabilizing samples
A) screening samples
B) sorting samples
C) rectifying samples
D) detailing samples
E) stabilizing samples
فتح الحزمة
افتح القفل للوصول البطاقات البالغ عددها 105 في هذه المجموعة.
فتح الحزمة
k this deck
9
Consumer's risk is also called a ________ error.
A) processing
B) non-response
C) type II
D) response
E) type I
A) processing
B) non-response
C) type II
D) response
E) type I
فتح الحزمة
افتح القفل للوصول البطاقات البالغ عددها 105 في هذه المجموعة.
فتح الحزمة
k this deck
10
________ happens when statistical quality analysis fails to result in the scrapping or reworking of a defective product.
A) Management's risk
B) Producer's risk
C) Manufacturer's risk
D) Retailer's risk
E) Consumer's risk
A) Management's risk
B) Producer's risk
C) Manufacturer's risk
D) Retailer's risk
E) Consumer's risk
فتح الحزمة
افتح القفل للوصول البطاقات البالغ عددها 105 في هذه المجموعة.
فتح الحزمة
k this deck
11
Which of the following is true of random variation?
A) It has a cause that can be identified.
B) It can be easily controlled.
C) It occurs with a somewhat consistent amount of dispersion.
D) It results in a process that is not repeatable.
E) It results from a shift in a process mean or some unexpected occurrence.
A) It has a cause that can be identified.
B) It can be easily controlled.
C) It occurs with a somewhat consistent amount of dispersion.
D) It results in a process that is not repeatable.
E) It results from a shift in a process mean or some unexpected occurrence.
فتح الحزمة
افتح القفل للوصول البطاقات البالغ عددها 105 في هذه المجموعة.
فتح الحزمة
k this deck
12
Process ________ means that the variation we observe in the process is random variation and not nonrandom variation.
A) optimization
B) capability
C) control
D) variability
E) stability
A) optimization
B) capability
C) control
D) variability
E) stability
فتح الحزمة
افتح القفل للوصول البطاقات البالغ عددها 105 في هذه المجموعة.
فتح الحزمة
k this deck
13
________ is the probability that a good product will be rejected.
A) Retailer's risk
B) Consumer's risk
C) Manufacturer's risk
D) Management's risk
E) Producer's risk
A) Retailer's risk
B) Consumer's risk
C) Manufacturer's risk
D) Management's risk
E) Producer's risk
فتح الحزمة
افتح القفل للوصول البطاقات البالغ عددها 105 في هذه المجموعة.
فتح الحزمة
k this deck
14
Producer's risk is also called a ________ error.
A) type I
B) non-response
C) type II
D) processing
E) response
A) type I
B) non-response
C) type II
D) processing
E) response
فتح الحزمة
افتح القفل للوصول البطاقات البالغ عددها 105 في هذه المجموعة.
فتح الحزمة
k this deck
15
Samples can be ________ according to time or according to sequence.
A) random
B) uncontrollable
C) indefinite
D) systematic
E) stochastic
A) random
B) uncontrollable
C) indefinite
D) systematic
E) stochastic
فتح الحزمة
افتح القفل للوصول البطاقات البالغ عددها 105 في هذه المجموعة.
فتح الحزمة
k this deck
16
________ is based on the concept that all work occurs in a system of interconnected processes.
A) Statistical thinking
B) Qualitative modeling
C) Process benchmarking
D) Rational subgrouping
E) Data interlinking
A) Statistical thinking
B) Qualitative modeling
C) Process benchmarking
D) Rational subgrouping
E) Data interlinking
فتح الحزمة
افتح القفل للوصول البطاقات البالغ عددها 105 في هذه المجموعة.
فتح الحزمة
k this deck
17
________ is the probability that a nonconforming product will be available for sale.
A) Producer's risk
B) Consumer's risk
C) Retailer's risk
D) Management's risk
E) Manufacturer's risk
A) Producer's risk
B) Consumer's risk
C) Retailer's risk
D) Management's risk
E) Manufacturer's risk
فتح الحزمة
افتح القفل للوصول البطاقات البالغ عددها 105 في هذه المجموعة.
فتح الحزمة
k this deck
18
________ is a decision-making skill demonstrated by the ability to draw conclusions based on data.
A) Data interlinking
B) Process benchmarking
C) Rational subgrouping
D) Statistical thinking
E) Qualitative modeling
A) Data interlinking
B) Process benchmarking
C) Rational subgrouping
D) Statistical thinking
E) Qualitative modeling
فتح الحزمة
افتح القفل للوصول البطاقات البالغ عددها 105 في هذه المجموعة.
فتح الحزمة
k this deck
19
Process stability means that the variation we observe in the process is ________ variation.
A) abnormal
B) specific
C) random
D) systematic
E) nonrandom
A) abnormal
B) specific
C) random
D) systematic
E) nonrandom
فتح الحزمة
افتح القفل للوصول البطاقات البالغ عددها 105 في هذه المجموعة.
فتح الحزمة
k this deck
20
________ is useful because it ensures independence among observations.
A) Process capability
B) Optimization
C) Population distribution
D) Process stability
E) Randomization
A) Process capability
B) Optimization
C) Population distribution
D) Process stability
E) Randomization
فتح الحزمة
افتح القفل للوصول البطاقات البالغ عددها 105 في هذه المجموعة.
فتح الحزمة
k this deck
21
In a variables control chart, which of the following is likely to occur if two points in succession are farther than two standard deviations from the mean?
A) erratic behavior
B) nonrandom event
C) process drift
D) natural variation
E) process run
A) erratic behavior
B) nonrandom event
C) process drift
D) natural variation
E) process run
فتح الحزمة
افتح القفل للوصول البطاقات البالغ عددها 105 في هذه المجموعة.
فتح الحزمة
k this deck
22
A(n) ________ is a continuous measurement such as weight, height, or volume.
A) variable
B) attribute
C) paradigm
D) criterion
E) element
A) variable
B) attribute
C) paradigm
D) criterion
E) element
فتح الحزمة
افتح القفل للوصول البطاقات البالغ عددها 105 في هذه المجموعة.
فتح الحزمة
k this deck
23
In a variables control chart, which of the following is likely to occur if seven points, either increasing or decreasing, are in succession?
A) erratic behavior
B) nonrandom event
C) process drift
D) natural variation
E) process run
A) erratic behavior
B) nonrandom event
C) process drift
D) natural variation
E) process run
فتح الحزمة
افتح القفل للوصول البطاقات البالغ عددها 105 في هذه المجموعة.
فتح الحزمة
k this deck
24
Process population average, mean, range, moving range, and standard deviation are examples of ________.
A) attributes
B) variables
C) elements
D) criteria
E) paradigms
A) attributes
B) variables
C) elements
D) criteria
E) paradigms
فتح الحزمة
افتح القفل للوصول البطاقات البالغ عددها 105 في هذه المجموعة.
فتح الحزمة
k this deck
25
Which of the following is an example of an attributes chart?
A) s chart
B) R chart
C) p chart
D) MR chart
E) X chart
A) s chart
B) R chart
C) p chart
D) MR chart
E) X chart
فتح الحزمة
افتح القفل للوصول البطاقات البالغ عددها 105 في هذه المجموعة.
فتح الحزمة
k this deck
26
________ are tools for monitoring process variation.
A) Pareto charts
B) Control charts
C) Histograms
D) Scatter diagrams
E) Cause-and-effect diagrams
A) Pareto charts
B) Control charts
C) Histograms
D) Scatter diagrams
E) Cause-and-effect diagrams
فتح الحزمة
افتح القفل للوصول البطاقات البالغ عددها 105 في هذه المجموعة.
فتح الحزمة
k this deck
27
A(n) ________ is used when data are hypergeometrically distributed.
A) p chart
B) u chart
C) c chart
D) h chart
E) g chart
A) p chart
B) u chart
C) c chart
D) h chart
E) g chart
فتح الحزمة
افتح القفل للوصول البطاقات البالغ عددها 105 في هذه المجموعة.
فتح الحزمة
k this deck
28
The ________ chart is used in monitoring process dispersion.
A) chart
B) c chart
C) p chart
D) R chart
E) X chart
A)
chartB) c chart
C) p chart
D) R chart
E) X chart
فتح الحزمة
افتح القفل للوصول البطاقات البالغ عددها 105 في هذه المجموعة.
فتح الحزمة
k this deck
29
Which of the following is an example of a variables chart?
A) u chart
B) c chart
C) np chart
D) p chart
E) X chart
A) u chart
B) c chart
C) np chart
D) p chart
E) X chart
فتح الحزمة
افتح القفل للوصول البطاقات البالغ عددها 105 في هذه المجموعة.
فتح الحزمة
k this deck
30
The chart is a process chart used to monitor the ________ of the characteristic being measured.
A) range
B) average
C) mode
D) median
E) standard deviation
chart is a process chart used to monitor the ________ of the characteristic being measured.A) range
B) average
C) mode
D) median
E) standard deviation
فتح الحزمة
افتح القفل للوصول البطاقات البالغ عددها 105 في هذه المجموعة.
فتح الحزمة
k this deck
31
What is the first step in developing process control charts?
A) identify critical product characteristics
B) select the appropriate process control chart
C) determine whether the critical product characteristic is a variable or an attribute
D) identify critical operations in the process
E) establish the control limits
A) identify critical product characteristics
B) select the appropriate process control chart
C) determine whether the critical product characteristic is a variable or an attribute
D) identify critical operations in the process
E) establish the control limits
فتح الحزمة
افتح القفل للوصول البطاقات البالغ عددها 105 في هذه المجموعة.
فتح الحزمة
k this deck
32
A ________ is used when data are geometrically distributed.
A) p chart
B) u chart
C) c chart
D) h chart
E) g chart
A) p chart
B) u chart
C) c chart
D) h chart
E) g chart
فتح الحزمة
افتح القفل للوصول البطاقات البالغ عددها 105 في هذه المجموعة.
فتح الحزمة
k this deck
33
The ________ is a process chart used to monitor the average of the characteristic being measured.
A) chart
B) R chart
C) c chart
D) p chart
E) MR chart
A)
chartB) R chart
C) c chart
D) p chart
E) MR chart
فتح الحزمة
افتح القفل للوصول البطاقات البالغ عددها 105 في هذه المجموعة.
فتح الحزمة
k this deck
34
What is the lower limit of R for sample sizes less than or equal to six?
A) -1
B) 6
C) 0
D) -6
E) 1
A) -1
B) 6
C) 0
D) -6
E) 1
فتح الحزمة
افتح القفل للوصول البطاقات البالغ عددها 105 في هذه المجموعة.
فتح الحزمة
k this deck
35
In a variables control chart, which of the following is likely to occur if five points are in succession, either all above or below the center line?
A) erratic behavior
B) nonrandom event
C) process drift
D) natural variation
E) process run
A) erratic behavior
B) nonrandom event
C) process drift
D) natural variation
E) process run
فتح الحزمة
افتح القفل للوصول البطاقات البالغ عددها 105 في هذه المجموعة.
فتح الحزمة
k this deck
36
In a variables control chart, which of the following is likely to occur if large jumps of more than three or four standard deviations take place?
A) erratic behavior
B) nonrandom event
C) process drift
D) natural variation
E) process run
A) erratic behavior
B) nonrandom event
C) process drift
D) natural variation
E) process run
فتح الحزمة
افتح القفل للوصول البطاقات البالغ عددها 105 في هذه المجموعة.
فتح الحزمة
k this deck
37
Proportion defective, number defective, number nonconforming in a consistent sample space, and number defects per unit are examples of ________.
A) criteria
B) paradigms
C) elements
D) variables
E) attributes
A) criteria
B) paradigms
C) elements
D) variables
E) attributes
فتح الحزمة
افتح القفل للوصول البطاقات البالغ عددها 105 في هذه المجموعة.
فتح الحزمة
k this deck
38
The ________ reflects a population distribution.
A) p chart
B) s chart
C) u chart
D) X chart
E) R chart
A) p chart
B) s chart
C) u chart
D) X chart
E) R chart
فتح الحزمة
افتح القفل للوصول البطاقات البالغ عددها 105 في هذه المجموعة.
فتح الحزمة
k this deck
39
A(n) ________ is an either-or-situation resulting from a binomial process.
A) variable
B) paradigm
C) criterion
D) attribute
E) element
A) variable
B) paradigm
C) criterion
D) attribute
E) element
فتح الحزمة
افتح القفل للوصول البطاقات البالغ عددها 105 في هذه المجموعة.
فتح الحزمة
k this deck
40
The ________ is the difference between the largest measurement and the smallest measurement in a particular sample.
A) range
B) median
C) mode
D) standard deviation
E) mean
A) range
B) median
C) mode
D) standard deviation
E) mean
فتح الحزمة
افتح القفل للوصول البطاقات البالغ عددها 105 في هذه المجموعة.
فتح الحزمة
k this deck
41
The ________ uses past information to predict what the next process outcome will be.
A) np chart
B) u chart
C) moving average chart
D) cusum chart
E) p chart
A) np chart
B) u chart
C) moving average chart
D) cusum chart
E) p chart
فتح الحزمة
افتح القفل للوصول البطاقات البالغ عددها 105 في هذه المجموعة.
فتح الحزمة
k this deck
42
The ________ is used to identify slight but sustained shifts in a universe where there is no independence between observations.
A) cusum chart
B) moving average chart
C) s chart
D) np chart
E) R chart
A) cusum chart
B) moving average chart
C) s chart
D) np chart
E) R chart
فتح الحزمة
افتح القفل للوصول البطاقات البالغ عددها 105 في هذه المجموعة.
فتح الحزمة
k this deck
43
A 50 volt battery must be between 55 and 45 volts when it leaves the factory. Two hundred samples of batteries have yielded the following data: average charge of 49 volts with a standard deviation of 2.5 volts. What is the process capability?
A) 0.06
B) 0.80
C) 0.53
D) 0.12
E) 0.38
A) 0.06
B) 0.80
C) 0.53
D) 0.12
E) 0.38
فتح الحزمة
افتح القفل للوصول البطاقات البالغ عددها 105 في هذه المجموعة.
فتح الحزمة
k this deck
44
Although charts generally are preferred for variables data, sometimes it is too time consuming or inconvenient to compute subgroup averages. In these cases, a(n) ________ is used.
A) chart
B) X chart
C) p chart
D) s chart
E) R chart
charts generally are preferred for variables data, sometimes it is too time consuming or inconvenient to compute subgroup averages. In these cases, a(n) ________ is used.A)
chartB) X chart
C) p chart
D) s chart
E) R chart
فتح الحزمة
افتح القفل للوصول البطاقات البالغ عددها 105 في هذه المجموعة.
فتح الحزمة
k this deck
45
Use the following table to answer the question(s) below.
A machine shop owner wishes to monitor the diameter of an engine boring operation where the piston bore should be 4.25". He obtains 8 samples of 5 and records the data in the table above. What should the lower and upper control limits be for an X-bar chart?
A) (5.00, 8.00)
B) (-1.50, 1.50)
C) (4.33, 5.12)
D) (0.00, 1.45)
E) (-5.10, 5.10)
فتح الحزمة
افتح القفل للوصول البطاقات البالغ عددها 105 في هذه المجموعة.
فتح الحزمة
k this deck
46
The ________ is often used where variation in a process is small.
A) s chart
B) X chart
C) np chart
D) u chart
E) c chart
A) s chart
B) X chart
C) np chart
D) u chart
E) c chart
فتح الحزمة
افتح القفل للوصول البطاقات البالغ عددها 105 في هذه المجموعة.
فتح الحزمة
k this deck
47
The ________ is used for monitoring variables and measurement on a continuous scale.
A) cusum chart
B) c chart
C) X chart
D) np chart
E) moving average chart
A) cusum chart
B) c chart
C) X chart
D) np chart
E) moving average chart
فتح الحزمة
افتح القفل للوصول البطاقات البالغ عددها 105 في هذه المجموعة.
فتح الحزمة
k this deck
48
________ are often used in monitoring the production of silicon chips for computers.
A) X charts
B) c charts
C) np charts
D) R charts
E) s charts
A) X charts
B) c charts
C) np charts
D) R charts
E) s charts
فتح الحزمة
افتح القفل للوصول البطاقات البالغ عددها 105 في هذه المجموعة.
فتح الحزمة
k this deck
49
Use the following table to answer the question(s) below.
A machine shop owner wishes to monitor the diameter of an engine boring operation where the piston bore should be 4.25". He obtains 8 samples of 5 and records the data in the table above. What should the upper and lower control limits be for an R chart?
A) (5.00, 8.00)
B) (0.00, 2.50)
C) (4.33, 5.12)
D) (0.00, 1.45)
E) (-5.10, 5.10)
فتح الحزمة
افتح القفل للوصول البطاقات البالغ عددها 105 في هذه المجموعة.
فتح الحزمة
k this deck
50
Use the following table to answer the question(s) below.
A machine shop owner wishes to monitor the diameter of an engine boring operation where the piston bore should be 4.25". He obtains 8 samples of 5 and records the data in the table above. What should the center line be for a chart that monitors process average?
A) 4.58
B) 4.66
C) 4.73
D) 4.78
E) 4.82
فتح الحزمة
افتح القفل للوصول البطاقات البالغ عددها 105 في هذه المجموعة.
فتح الحزمة
k this deck
51
Use the following table to answer the question(s) below.
Close tolerances are required in the manufacturing section of an automotive parts business. Since the customers demand quality, the owner wants to monitor the operation closely using statistical process control. After taking 8 samples of size 4, the owner finds himself with the data in the table above. What are the lower and upper limits for a chart that will monitor process average?
A) (99.68, 100.36)
B) (99.56, 100.21)
C) (99.41, 100.59)
D) (99.38, 100.82)
E) (99.99, 100.01)
فتح الحزمة
افتح القفل للوصول البطاقات البالغ عددها 105 في هذه المجموعة.
فتح الحزمة
k this deck
52
World-class levels of process capability are measured by ________ defect levels.
A) parts per million
B) parts per hundred thousand
C) parts per ten thousand
D) parts per thousand
E) parts per hundred
A) parts per million
B) parts per hundred thousand
C) parts per ten thousand
D) parts per thousand
E) parts per hundred
فتح الحزمة
افتح القفل للوصول البطاقات البالغ عددها 105 في هذه المجموعة.
فتح الحزمة
k this deck
53
The diameter of a mason jar is 3 inches but can be as large as 3.03 inches and as small as 2.97 inches. Twenty five samples of mason jars are taken and it is discovered that these components have a grand mean of 3.01 inches and a standard deviation of 0.02 inches. What is the capability of this process?
A) 0.08
B) 0.16
C) 0.33
D) 0.49
E) 0.66
A) 0.08
B) 0.16
C) 0.33
D) 0.49
E) 0.66
فتح الحزمة
افتح القفل للوصول البطاقات البالغ عددها 105 في هذه المجموعة.
فتح الحزمة
k this deck
54
Use the following table to answer the question(s) below.
A machine shop owner wishes to monitor the diameter of an engine boring operation where the piston bore should be 4.25". He obtains 8 samples of 5 and records the data in the table above. What should the center line be for a chart that monitors process dispersion?
A) 0.50
B) 0.55
C) 0.60
D) 0.69
E) 0.80
فتح الحزمة
افتح القفل للوصول البطاقات البالغ عددها 105 في هذه المجموعة.
فتح الحزمة
k this deck
55
Use the following table to answer the question(s) below.
Close tolerances are required in the manufacturing section of an automotive parts business. Since the customers demand quality, the owner wants to monitor the operation closely using statistical process control. After taking 8 samples of size 4, the owner finds himself with the data in the table above. What is the center line for a chart that will monitor process dispersion?
A) 0.45
B) 0.30
C) 0.00
D) 0.75
E) cannot be determined from the information given
فتح الحزمة
افتح القفل للوصول البطاقات البالغ عددها 105 في هذه المجموعة.
فتح الحزمة
k this deck
56
Use the following table to answer the question(s) below.
Close tolerances are required in the manufacturing section of an automotive parts business. Since the customers demand quality, the owner wants to monitor the operation closely using statistical process control. After taking 8 samples of size 4, the owner records the data in the table above. What are the lower and upper limits for a chart that will monitor process dispersion?
A) (0.00, 1.85)
B) (0.00, 2.11)
C) (0.00, 2.28)
D) (0.00, 1.03)
E) (0.00, 1.45)
فتح الحزمة
افتح القفل للوصول البطاقات البالغ عددها 105 في هذه المجموعة.
فتح الحزمة
k this deck
57
Use the following table to answer the question(s) below.
Close tolerances are required in the manufacturing section of an automotive parts business. Since the customers demand quality, the owner wants to monitor the operation closely using statistical process control. After taking 8 samples of size 4, the owner finds himself with the data in the table above. What is the center line for a chart that will monitor process average?
A) 100.20
B) 102.00
C) 99.88
D) 98.00
E) cannot be determined from the information given
فتح الحزمة
افتح القفل للوصول البطاقات البالغ عددها 105 في هذه المجموعة.
فتح الحزمة
k this deck
58
The diameter of a mason jar is 3 inches but can be as large as 3.03 inches and as small as 2.97 inches. Twenty-five samples of mason jars are taken and it is discovered that these components have a grand mean of 3.01 inches and a standard deviation of 0.02 inches. What is the probability of producing a bad product?
A) 0.60
B) 0.18
C) 0.32
D) 0.45
E) 0.84
A) 0.60
B) 0.18
C) 0.32
D) 0.45
E) 0.84
فتح الحزمة
افتح القفل للوصول البطاقات البالغ عددها 105 في هذه المجموعة.
فتح الحزمة
k this deck
59
________ refers to the ability of a process to produce a product that meets specifications.
A) Process stability
B) Process attribute
C) Process variability
D) Process capability
E) Process conformance
A) Process stability
B) Process attribute
C) Process variability
D) Process capability
E) Process conformance
فتح الحزمة
افتح القفل للوصول البطاقات البالغ عددها 105 في هذه المجموعة.
فتح الحزمة
k this deck
60
A 50 volt battery must be between 55 and 45 volts when it leaves the factory. Two hundred samples of batteries have yielded the following data: average charge of 49 volts with a standard deviation of 2.5 volts. What is the probability of producing an out-of-spec battery?
A) 0.06
B) 0.80
C) 0.53
D) 0.12
E) 0.32
A) 0.06
B) 0.80
C) 0.53
D) 0.12
E) 0.32
فتح الحزمة
افتح القفل للوصول البطاقات البالغ عددها 105 في هذه المجموعة.
فتح الحزمة
k this deck
61
One hundred percent samples are also known as screening samples.
فتح الحزمة
افتح القفل للوصول البطاقات البالغ عددها 105 في هذه المجموعة.
فتح الحزمة
k this deck
62
Process charts are graphs designed to signal process workers when nonrandom variation is occurring in a process.
فتح الحزمة
افتح القفل للوصول البطاقات البالغ عددها 105 في هذه المجموعة.
فتح الحزمة
k this deck
63
Statistical tools focus on causes rather than effects.
فتح الحزمة
افتح القفل للوصول البطاقات البالغ عددها 105 في هذه المجموعة.
فتح الحزمة
k this deck
64
Statistical tools are deemed to fail because people have a poor understanding of the scientific method.
فتح الحزمة
افتح القفل للوصول البطاقات البالغ عددها 105 في هذه المجموعة.
فتح الحزمة
k this deck
65
Statistical thinking is based on the concept that understanding variation and increasing variation are important keys to success.
فتح الحزمة
افتح القفل للوصول البطاقات البالغ عددها 105 في هذه المجموعة.
فتح الحزمة
k this deck
66
Random variation is also referred to as uncontrollable variation.
فتح الحزمة
افتح القفل للوصول البطاقات البالغ عددها 105 في هذه المجموعة.
فتح الحزمة
k this deck
67
X chart is an example of a variables chart.
فتح الحزمة
افتح القفل للوصول البطاقات البالغ عددها 105 في هذه المجموعة.
فتح الحزمة
k this deck
68
Statistical thinking is a decision-making skill demonstrated by the ability to draw conclusions based on data.
فتح الحزمة
افتح القفل للوصول البطاقات البالغ عددها 105 في هذه المجموعة.
فتح الحزمة
k this deck
69
Process stability means that the variation observed in the process is nonrandom variation and not random variation.
فتح الحزمة
افتح القفل للوصول البطاقات البالغ عددها 105 في هذه المجموعة.
فتح الحزمة
k this deck
70
Consumer's risk happens when statistical quality analysis fails to result in the scrapping or reworking of a defective product.
فتح الحزمة
افتح القفل للوصول البطاقات البالغ عددها 105 في هذه المجموعة.
فتح الحزمة
k this deck
71
An attribute is a continuous measurement such as weight, height, or volume.
فتح الحزمة
افتح القفل للوصول البطاقات البالغ عددها 105 في هذه المجموعة.
فتح الحزمة
k this deck
72
Random variation results from an event such as a shift in a process mean or some unexpected occurrence.
فتح الحزمة
افتح القفل للوصول البطاقات البالغ عددها 105 في هذه المجموعة.
فتح الحزمة
k this deck
73
The upper and lower specifications for metal head plates are 5 0.1 cm. A sample of the metal head plates in 25 undergraduates yields a mean of 5.05. We know that the population standard deviation is 0.04. What is the population capability index?
A) 2.15
B) 2.51
C) 1.25
D) 1.52
E) 0.42
0.1 cm. A sample of the metal head plates in 25 undergraduates yields a mean of 5.05. We know that the population standard deviation is 0.04. What is the population capability index?A) 2.15
B) 2.51
C) 1.25
D) 1.52
E) 0.42
فتح الحزمة
افتح القفل للوصول البطاقات البالغ عددها 105 في هذه المجموعة.
فتح الحزمة
k this deck
74
Nonrandom variation is centered on a mean and occurs with a consistent amount of dispersion.
فتح الحزمة
افتح القفل للوصول البطاقات البالغ عددها 105 في هذه المجموعة.
فتح الحزمة
k this deck
75
In the study of quality, Type I error is called consumer's risk.
فتح الحزمة
افتح القفل للوصول البطاقات البالغ عددها 105 في هذه المجموعة.
فتح الحزمة
k this deck
76
Producer's risk is the probability that a nonconforming product will be available for sale.
فتح الحزمة
افتح القفل للوصول البطاقات البالغ عددها 105 في هذه المجموعة.
فتح الحزمة
k this deck
77
Statistical process control charts are tools for monitoring process variation.
فتح الحزمة
افتح القفل للوصول البطاقات البالغ عددها 105 في هذه المجموعة.
فتح الحزمة
k this deck
78
Nonrandom variation results in a process that is not repeatable.
فتح الحزمة
افتح القفل للوصول البطاقات البالغ عددها 105 في هذه المجموعة.
فتح الحزمة
k this deck
79
The upper and lower specifications for metal head plates are 5 0.1 cm. A sample of the metal head plates in 25 undergraduates yields a mean of 5.05. What is the population standard deviation if the population capability index is 1.666?
A) 0.01
B) 0.02
C) 0.03
D) 0.04
E) 0.05
0.1 cm. A sample of the metal head plates in 25 undergraduates yields a mean of 5.05. What is the population standard deviation if the population capability index is 1.666?A) 0.01
B) 0.02
C) 0.03
D) 0.04
E) 0.05
فتح الحزمة
افتح القفل للوصول البطاقات البالغ عددها 105 في هذه المجموعة.
فتح الحزمة
k this deck
80
If a systematic sample is performed according to sequence, the product is inspected at regular intervals of time.
فتح الحزمة
افتح القفل للوصول البطاقات البالغ عددها 105 في هذه المجموعة.
فتح الحزمة
k this deck
فتح الحزمة
افتح القفل للوصول البطاقات البالغ عددها 105 في هذه المجموعة.


