Deck 1: Describing Data: Graphical
ملء الشاشة (f)
سؤال
سؤال
سؤال
Consider the following frequency distributions generated by Excel.What is the missing cumulative % value identified by the asterisk? 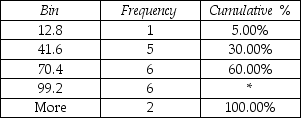
A)60.00%
B)5)00%
C)100%
D)90%
A)60.00%
B)5)00%
C)100%
D)90%
سؤال
The length of time it takes to assemble a particular electronic component varies from one employee to another.Management has collected the time (in minutes)it took 20 different employees to assemble the component.The information is summarized in the following frequency distribution generated by Excel: 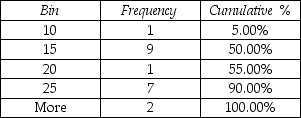
Which of the following statements is true?
A)50% of all the workers took exactly 15 minutes to assemble the component.
B)100% of all the workers took longer than 25 minutes to assemble the component.
C)Eleven workers assembled the component in 20 minutes or less.
D)Seven workers took 25 minutes or longer to assemble the component.
سؤال
A sample of 30 professional men was asked to estimate their yearly expenditures on clothes for work.The data are summarized in the following stem-and-leaf display. Stem = 100 Leaf = 10 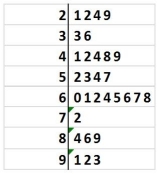
What percentage of these men spent more than $600 and less than $700 on professional attire? (Round to nearest tenth of a percent. )
A)20.0%
B)23.3%
C)26.7%
D)30.0%
What percentage of these men spent more than $600 and less than $700 on professional attire? (Round to nearest tenth of a percent. )
A)20.0%
B)23.3%
C)26.7%
D)30.0%
سؤال
سؤال
Consider the following frequency distribution generated by Excel.What is the missing frequency value identified by the asterisk? 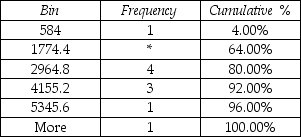
A)3
B)15
C)16
D)25
A)3
B)15
C)16
D)25
سؤال
سؤال
سؤال
سؤال
سؤال
سؤال
سؤال
سؤال
سؤال
سؤال
سؤال
سؤال
سؤال
Consider the following frequency distribution generated by Excel.What proportion of these values are less than 63? 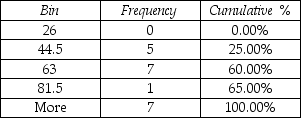
A)25%
B)60%
C)65%
D)35%
A)25%
B)60%
C)65%
D)35%
سؤال
سؤال
سؤال
سؤال
سؤال
سؤال
سؤال
سؤال
سؤال
سؤال
سؤال
سؤال
سؤال
سؤال
سؤال
سؤال
سؤال
سؤال
Companies are often interested in knowing how customers learned about their products.They often solicit this information on mail-in warranty cards.The customers' responses for a particular product were gathered and the data are presented in the pie chart below. 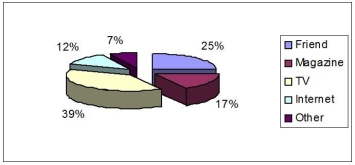 What percentage of respondents learned about the product through television or the Internet?
A)12%
B)39%
C)51%
D)100%
What percentage of respondents learned about the product through television or the Internet?A)12%
B)39%
C)51%
D)100%
سؤال
سؤال
سؤال
سؤال
سؤال
THE NEXT QUESTIONS ARE BASED ON THE FOLLOWING INFORMATION:
In a recent marketing experiment,consumers were given one of four different types of dishwashing detergent and asked to use it for a month.At the end of that time they were asked to rate the detergent in terms of overall quality.The results are presented below.
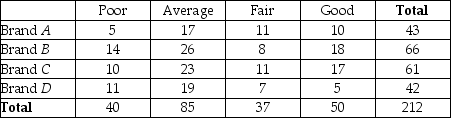
Of the customers who rated their detergent good,what percentage evaluated Brand C?
A)23.6%
B)34.0%
C)8)0%
D)28.8%
In a recent marketing experiment,consumers were given one of four different types of dishwashing detergent and asked to use it for a month.At the end of that time they were asked to rate the detergent in terms of overall quality.The results are presented below.
Of the customers who rated their detergent good,what percentage evaluated Brand C?
A)23.6%
B)34.0%
C)8)0%
D)28.8%
سؤال
سؤال
سؤال
THE NEXT QUESTIONS ARE BASED ON THE FOLLOWING INFORMATION:
In a recent marketing experiment,consumers were given one of four different types of dishwashing detergent and asked to use it for a month.At the end of that time they were asked to rate the detergent in terms of overall quality.The results are presented below.
Of the customers who were given Brand A,what percentage rated it poor?
A)12.5%
B)2)40%
C)11.6%
D)18.9%
سؤال
THE NEXT QUESTIONS ARE BASED ON THE FOLLOWING INFORMATION:
In a recent marketing experiment,consumers were given one of four different types of dishwashing detergent and asked to use it for a month.At the end of that time they were asked to rate the detergent in terms of overall quality.The results are presented below.
What percentage of the consumers evaluated Brand A?
A)20.3%
B)16.7%
C)23.0%
D)18.9%
سؤال
THE NEXT QUESTIONS ARE BASED ON THE FOLLOWING INFORMATION:
In a recent marketing experiment,consumers were given one of four different types of dishwashing detergent and asked to use it for a month.At the end of that time they were asked to rate the detergent in terms of overall quality.The results are presented below.
What percentage of the consumers rated their detergent fair or good?
A)49.0%
B)41.0%
C)17.5%
D)23.6%
سؤال
سؤال
سؤال
سؤال
سؤال
سؤال
سؤال
سؤال
سؤال
سؤال
THE NEXT QUESTIONS ARE BASED ON THE FOLLOWING INFORMATION:
In a recent marketing experiment,consumers were given one of four different types of dishwashing detergent and asked to use it for a month.At the end of that time they were asked to rate the detergent in terms of overall quality.The results are presented below.
What percentage of the consumers rated their detergent below average?
A)41.0%
B)59.0%
C)17.5%
D)18.9%
سؤال
سؤال
THE NEXT QUESTIONS ARE BASED ON THE FOLLOWING INFORMATION:
In a recent marketing experiment,consumers were given one of four different types of dishwashing detergent and asked to use it for a month.At the end of that time they were asked to rate the detergent in terms of overall quality.The results are presented below.
What percentage of the consumers rated their detergent average or better?
A)23.6%
B)40.1%
C)81.1%
D)17.5%
سؤال
سؤال
سؤال
سؤال
سؤال
سؤال
سؤال
سؤال
سؤال
THE NEXT QUESTIONS ARE BASED ON THE FOLLOWING INFORMATION: 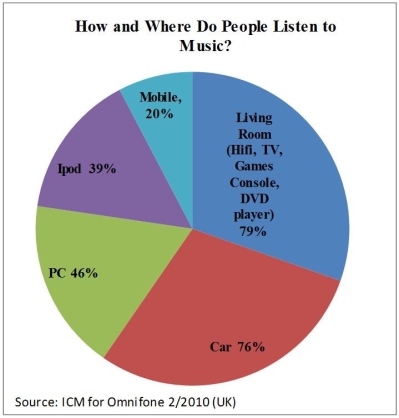
What percentage of music is listened to on mobile devices?
A)39%
B)76%
C)20%
D)46%
What percentage of music is listened to on mobile devices?
A)39%
B)76%
C)20%
D)46%
سؤال
سؤال
THE NEXT QUESTIONS ARE BASED ON THE FOLLOWING INFORMATION:
Where is most music listened to?
A)Car
B)Ipod
C)PC
D)Living Room
Where is most music listened to?
A)Car
B)Ipod
C)PC
D)Living Room
سؤال
سؤال
سؤال
سؤال
سؤال
سؤال
سؤال
سؤال
سؤال

فتح الحزمة
قم بالتسجيل لفتح البطاقات في هذه المجموعة!
Unlock Deck
Unlock Deck
1/247
العب
ملء الشاشة (f)
Deck 1: Describing Data: Graphical
1
Dr.Thomas graduated from West Virginia University with a code value = 1 while Professor Harrison graduated from the Marshall University with a code value = 2.The scale of measurement likely represented by this information is:
A)nominal.
B)ordinal.
C)interval.
D)ratio.
A)nominal.
B)ordinal.
C)interval.
D)ratio.
nominal.
2
Which of the following statements involve descriptive statistics as opposed to inferential statistics?
A)The Alcohol,Tobacco and Firearms Department reported that Seattle had 1,825 registered gun dealers in 2013.
B)Based on a survey of 380 magazine readers,the magazine reports that 30% of its readers prefer double column articles.
C)The FAA samples 425 traffic controllers in order to estimate the percent retiring due to job stress related illness.
D)Based on a sample of 350 professional baseball players,a baseball magazine reported that 23% of the parents of all professional baseball players did not play baseball.
The Alcohol,Tobacco and Firearms Department reported that Seattle had 1,825 registered gun dealers in 2013.
3
Consider the following frequency distributions generated by Excel.What is the missing cumulative % value identified by the asterisk?
A)60.00%
B)5)00%
C)100%
D)90%
A)60.00%
B)5)00%
C)100%
D)90%
90%
4
The length of time it takes to assemble a particular electronic component varies from one employee to another.Management has collected the time (in minutes)it took 20 different employees to assemble the component.The information is summarized in the following frequency distribution generated by Excel:
Which of the following statements is true?
A)50% of all the workers took exactly 15 minutes to assemble the component.
B)100% of all the workers took longer than 25 minutes to assemble the component.
C)Eleven workers assembled the component in 20 minutes or less.
D)Seven workers took 25 minutes or longer to assemble the component.
فتح الحزمة
افتح القفل للوصول البطاقات البالغ عددها 247 في هذه المجموعة.
فتح الحزمة
k this deck
5
A sample of 30 professional men was asked to estimate their yearly expenditures on clothes for work.The data are summarized in the following stem-and-leaf display. Stem = 100 Leaf = 10
What percentage of these men spent more than $600 and less than $700 on professional attire? (Round to nearest tenth of a percent. )
A)20.0%
B)23.3%
C)26.7%
D)30.0%
What percentage of these men spent more than $600 and less than $700 on professional attire? (Round to nearest tenth of a percent. )
A)20.0%
B)23.3%
C)26.7%
D)30.0%
فتح الحزمة
افتح القفل للوصول البطاقات البالغ عددها 247 في هذه المجموعة.
فتح الحزمة
k this deck
6
Which of the following statements is incorrect?
A)Ordinal data may be described as qualitative.
B)Nominal data may be described as quantitative.
C)A categorical variable may produce ordinal data.
D)A discrete numerical variable may produce ratio scale data.
A)Ordinal data may be described as qualitative.
B)Nominal data may be described as quantitative.
C)A categorical variable may produce ordinal data.
D)A discrete numerical variable may produce ratio scale data.
فتح الحزمة
افتح القفل للوصول البطاقات البالغ عددها 247 في هذه المجموعة.
فتح الحزمة
k this deck
7
Consider the following frequency distribution generated by Excel.What is the missing frequency value identified by the asterisk?
A)3
B)15
C)16
D)25
A)3
B)15
C)16
D)25
فتح الحزمة
افتح القفل للوصول البطاقات البالغ عددها 247 في هذه المجموعة.
فتح الحزمة
k this deck
8
Suppose a survey is taken of 300 high school seniors out of a total of 1,000 seniors.This group is probably a:
A)sample.
B)population.
C)system.
D)process.
A)sample.
B)population.
C)system.
D)process.
فتح الحزمة
افتح القفل للوصول البطاقات البالغ عددها 247 في هذه المجموعة.
فتح الحزمة
k this deck
9
What type of graph does a stem-and-leaf resemble when turned vertically?
A)pie chart
B)scatter plot
C)histogram
D)line chart
A)pie chart
B)scatter plot
C)histogram
D)line chart
فتح الحزمة
افتح القفل للوصول البطاقات البالغ عددها 247 في هذه المجموعة.
فتح الحزمة
k this deck
10
Consider the terms: information,data,and knowledge.From a statistical standpoint,list these terms in order of increasing usefulness in making decisions.
A)information,data,and knowledge
B)data,information,and knowledge
C)knowledge,information,and data
D)knowledge,data,and information
A)information,data,and knowledge
B)data,information,and knowledge
C)knowledge,information,and data
D)knowledge,data,and information
فتح الحزمة
افتح القفل للوصول البطاقات البالغ عددها 247 في هذه المجموعة.
فتح الحزمة
k this deck
11
When grouping data into classes it is recommended to have:
A)exactly 5 classes.
B)between 5 and 20 classes.
C)at least 5 classes.
D)at most 10 classes.
A)exactly 5 classes.
B)between 5 and 20 classes.
C)at least 5 classes.
D)at most 10 classes.
فتح الحزمة
افتح القفل للوصول البطاقات البالغ عددها 247 في هذه المجموعة.
فتح الحزمة
k this deck
12
What is the correct ranking of data from weakest or lowest level to strongest or highest level?
A)nominal,ordinal,interval and ratio
B)ordinal,nominal,interval and ratio
C)interval,nominal,ratio and ordinal
D)nominal,interval,ordinal,and ratio
A)nominal,ordinal,interval and ratio
B)ordinal,nominal,interval and ratio
C)interval,nominal,ratio and ordinal
D)nominal,interval,ordinal,and ratio
فتح الحزمة
افتح القفل للوصول البطاقات البالغ عددها 247 في هذه المجموعة.
فتح الحزمة
k this deck
13
Which of the following variables is an example of a categorical variable?
A)The amount of money you spend on eating out each month.
B)The time it takes you to write a test.
C)The geographic region of the country in which you live.
D)The weight of a cereal box.
A)The amount of money you spend on eating out each month.
B)The time it takes you to write a test.
C)The geographic region of the country in which you live.
D)The weight of a cereal box.
فتح الحزمة
افتح القفل للوصول البطاقات البالغ عددها 247 في هذه المجموعة.
فتح الحزمة
k this deck
14
A researcher used a procedure to select a sample of n objects from a population in such a way that each member of the population is chosen strictly by chance,is equally likely to be chosen,and every possible sample of size n has the same chance of selection.The procedure used by the researcher is known as:
A)descriptive statistics.
B)inferential statistics.
C)simple random sampling.
D)None of the above
A)descriptive statistics.
B)inferential statistics.
C)simple random sampling.
D)None of the above
فتح الحزمة
افتح القفل للوصول البطاقات البالغ عددها 247 في هذه المجموعة.
فتح الحزمة
k this deck
15
Which of the following is a quantitative variable?
A)the make of a washing machine
B)a person's gender
C)price of a car in thousands of dollars
D)whether a person is a college graduate or not
A)the make of a washing machine
B)a person's gender
C)price of a car in thousands of dollars
D)whether a person is a college graduate or not
فتح الحزمة
افتح القفل للوصول البطاقات البالغ عددها 247 في هذه المجموعة.
فتح الحزمة
k this deck
16
A measurement scale that rates product quality as either 1 = poor,2 = average and 3 = good is known as:
A)nominal.
B)ordinal.
C)interval.
D)ratio.
A)nominal.
B)ordinal.
C)interval.
D)ratio.
فتح الحزمة
افتح القفل للوصول البطاقات البالغ عددها 247 في هذه المجموعة.
فتح الحزمة
k this deck
17
Which of the following is an example of a discrete random variable?
A)The monthly electric bill for a local business.
B)The number of people eating at a local café between noon and 2:00 p.m.
C)The amount of time it takes for a worker to complete a complex task.
D)The percentage of people living below the poverty level in Boston.
A)The monthly electric bill for a local business.
B)The number of people eating at a local café between noon and 2:00 p.m.
C)The amount of time it takes for a worker to complete a complex task.
D)The percentage of people living below the poverty level in Boston.
فتح الحزمة
افتح القفل للوصول البطاقات البالغ عددها 247 في هذه المجموعة.
فتح الحزمة
k this deck
18
The width of each bar in a histogram corresponds to the:
A)midpoint of the class.
B)number of observations in the class.
C)boundaries of the class.
D)percentage of observations in the class.
A)midpoint of the class.
B)number of observations in the class.
C)boundaries of the class.
D)percentage of observations in the class.
فتح الحزمة
افتح القفل للوصول البطاقات البالغ عددها 247 في هذه المجموعة.
فتح الحزمة
k this deck
19
When data are collected in a statistical study for only a portion or subset of all elements of interest the researcher is using a:
A)parameter.
B)sample.
C)statistic.
D)population.
A)parameter.
B)sample.
C)statistic.
D)population.
فتح الحزمة
افتح القفل للوصول البطاقات البالغ عددها 247 في هذه المجموعة.
فتح الحزمة
k this deck
20
Consider the following frequency distribution generated by Excel.What proportion of these values are less than 63?
A)25%
B)60%
C)65%
D)35%
A)25%
B)60%
C)65%
D)35%
فتح الحزمة
افتح القفل للوصول البطاقات البالغ عددها 247 في هذه المجموعة.
فتح الحزمة
k this deck
21
You asked ten of your classmates about their weight.On the basis of this information,you stated that the average weight of all students in your university or college is 142.6 pounds.This is an example of:
A)descriptive statistics.
B)inferential statistics.
C)parameter.
D)population.
A)descriptive statistics.
B)inferential statistics.
C)parameter.
D)population.
فتح الحزمة
افتح القفل للوصول البطاقات البالغ عددها 247 في هذه المجموعة.
فتح الحزمة
k this deck
22
Which of the following is a categorical variable?
A)tire pressure
B)bank account balance
C)daily sales in a store
D)eye color
A)tire pressure
B)bank account balance
C)daily sales in a store
D)eye color
فتح الحزمة
افتح القفل للوصول البطاقات البالغ عددها 247 في هذه المجموعة.
فتح الحزمة
k this deck
23
Which of the following statements involve inferential statistics as opposed to descriptive statistics?
A)The FAA reported there were 180 near misses among commercial aircraft last year.
B)A class of fifty five statistics students earned an average grade of 72.5.
C)The city business office reported 50 building permits for new single-family housing units.
D)Based on a sample of 450 subscribers,a local satellite TV system estimates that 45 percent of its subscribers watch a premium channel at least once per day.
فتح الحزمة
افتح القفل للوصول البطاقات البالغ عددها 247 في هذه المجموعة.
فتح الحزمة
k this deck
24
THE NEXT QUESTIONS ARE BASED ON THE FOLLOWING INFORMATION:
The Quality Assurance Department of a large restaurant is attempting to monitor and evaluate customer satisfaction with restaurant services.Prior to their departure,a random sample of customers is asked to fill out a short questionnaire to rate such services as quality of food,price,waiting time to be served,and cleanliness of the place.The Quality Assurance Department prepares weekly reports that are used to improve the services.
In this restaurant services study,the process of using this information to predict future needs of customers in the restaurant is called:
A)statistical survey.
B)systemic sampling.
C)descriptive statistics.
D)forecasting.
فتح الحزمة
افتح القفل للوصول البطاقات البالغ عددها 247 في هذه المجموعة.
فتح الحزمة
k this deck
25
Which of the following best describes the data: grade point averages for athletes?
A)categorical
B)quantitative
C)qualitative
D)relative frequency
A)categorical
B)quantitative
C)qualitative
D)relative frequency
فتح الحزمة
افتح القفل للوصول البطاقات البالغ عددها 247 في هذه المجموعة.
فتح الحزمة
k this deck
26
Pareto's principle is applied to a wide variety of behavior over many systems.It is sometimes referred to as the:
A)"20-80" Rule.
B)"80-20" Rule.
C)"10-90" Rule.
D)"90-10" Rule.
A)"20-80" Rule.
B)"80-20" Rule.
C)"10-90" Rule.
D)"90-10" Rule.
فتح الحزمة
افتح القفل للوصول البطاقات البالغ عددها 247 في هذه المجموعة.
فتح الحزمة
k this deck
27
A line graph that connects points that represent the cumulative percentage of observations below the upper limit of each class interval in a cumulative frequency distribution is known as a(n):
A)ogive.
B)frequency histogram.
C)frequency polygon.
D)scatter plot.
A)ogive.
B)frequency histogram.
C)frequency polygon.
D)scatter plot.
فتح الحزمة
افتح القفل للوصول البطاقات البالغ عددها 247 في هذه المجموعة.
فتح الحزمة
k this deck
28
At a large company,the majority of the employees earn from $22,000 to $32,000 per year.Middle management employees earn between $32,000 and $52,000 per year while top management earn between $54,000 and $104,000 per year.A histogram of all salaries would have which of the following shapes?
A)symmetrical
B)uniform
C)skewed to right
D)skewed to left
A)symmetrical
B)uniform
C)skewed to right
D)skewed to left
فتح الحزمة
افتح القفل للوصول البطاقات البالغ عددها 247 في هذه المجموعة.
فتح الحزمة
k this deck
29
An automobile insurance agent believes that company A is more reliable than company B.Which level of measurement does this information represent?
A)nominal
B)ordinal
C)interval
D)ratio
A)nominal
B)ordinal
C)interval
D)ratio
فتح الحزمة
افتح القفل للوصول البطاقات البالغ عددها 247 في هذه المجموعة.
فتح الحزمة
k this deck
30
A summary measure that is computed from a population is known as a(n):
A)parameter.
B)statistic.
C)sample.
D)inferential statistic.
A)parameter.
B)statistic.
C)sample.
D)inferential statistic.
فتح الحزمة
افتح القفل للوصول البطاقات البالغ عددها 247 في هذه المجموعة.
فتح الحزمة
k this deck
31
A company has developed a new battery,but the average lifetime is unknown.In order to estimate this average,a sample of 110 batteries is tested and the average lifetime of this sample is found to be 200 hours.The 200 hours is the value of a:
A)parameter.
B)statistic.
C)sampling frame.
D)population.
A)parameter.
B)statistic.
C)sampling frame.
D)population.
فتح الحزمة
افتح القفل للوصول البطاقات البالغ عددها 247 في هذه المجموعة.
فتح الحزمة
k this deck
32
In rating the service provided by a restaurant server,the following responses are possible: excellent,above average,average,below average,and poor.The responses are coded from 1 to 5 with 5 being excellent.The level of measurement this scale represents is:
A)nominal.
B)ordinal.
C)interval.
D)ratio.
A)nominal.
B)ordinal.
C)interval.
D)ratio.
فتح الحزمة
افتح القفل للوصول البطاقات البالغ عددها 247 في هذه المجموعة.
فتح الحزمة
k this deck
33
Which of the following is most likely a continuous numerical variable?
A)the number of gallons of paint purchased
B)the number of reams of paper ordered
C)the population of Egypt in 2005
D)the number of miles of interstate highways
A)the number of gallons of paint purchased
B)the number of reams of paper ordered
C)the population of Egypt in 2005
D)the number of miles of interstate highways
فتح الحزمة
افتح القفل للوصول البطاقات البالغ عددها 247 في هذه المجموعة.
فتح الحزمة
k this deck
34
Which of the following best describes the data: zip codes for students attending Glenville College?
A)qualitative
B)numerical
C)quantitative
D)time-series
A)qualitative
B)numerical
C)quantitative
D)time-series
فتح الحزمة
افتح القفل للوصول البطاقات البالغ عددها 247 في هذه المجموعة.
فتح الحزمة
k this deck
35
Consider the following data: like,no preference,or dislike.Which of the following best describes these data?
A)qualitative
B)numerical
C)quantitative
D)attitude
A)qualitative
B)numerical
C)quantitative
D)attitude
فتح الحزمة
افتح القفل للوصول البطاقات البالغ عددها 247 في هذه المجموعة.
فتح الحزمة
k this deck
36
Which of the following statements is false?
A)Relative frequencies are often useful in a presentation because nearly everybody understands fractional parts when expressed as percents.
B)Relative frequencies are particularly useful when comparing the frequency distributions of two different size sets of data.
C)The histogram of a normal sample should have a distribution shape that is skewed.
D)A stem-and-leaf display contains all the information needed to create a histogram.
فتح الحزمة
افتح القفل للوصول البطاقات البالغ عددها 247 في هذه المجموعة.
فتح الحزمة
k this deck
37
THE NEXT QUESTIONS ARE BASED ON THE FOLLOWING INFORMATION:
The Quality Assurance Department of a large restaurant is attempting to monitor and evaluate customer satisfaction with restaurant services.Prior to their departure,a random sample of customers is asked to fill out a short questionnaire to rate such services as quality of food,price,waiting time to be served,and cleanliness of the place.The Quality Assurance Department prepares weekly reports that are used to improve the services.
In this restaurant services study,a listing of all customers in this restaurant over a particular week would constitute a:
A)sample.
B)population.
C)numerical variable.
D)process.
فتح الحزمة
افتح القفل للوصول البطاقات البالغ عددها 247 في هذه المجموعة.
فتح الحزمة
k this deck
38
Companies are often interested in knowing how customers learned about their products.They often solicit this information on mail-in warranty cards.The customers' responses for a particular product were gathered and the data are presented in the pie chart below. What percentage of respondents learned about the product through television or the Internet?
A)12%
B)39%
C)51%
D)100%
What percentage of respondents learned about the product through television or the Internet?A)12%
B)39%
C)51%
D)100%
فتح الحزمة
افتح القفل للوصول البطاقات البالغ عددها 247 في هذه المجموعة.
فتح الحزمة
k this deck
39
THE NEXT QUESTIONS ARE BASED ON THE FOLLOWING INFORMATION:
The Quality Assurance Department of a large restaurant is attempting to monitor and evaluate customer satisfaction with restaurant services.Prior to their departure,a random sample of customers is asked to fill out a short questionnaire to rate such services as quality of food,price,waiting time to be served,and cleanliness of the place.The Quality Assurance Department prepares weekly reports that are used to improve the services.
In this restaurant services study,the process of using sample information for predictions,forecasts,and estimates is called:
A)inferential statistics.
B)descriptive statistics.
C)statistical survey.
D)process.
فتح الحزمة
افتح القفل للوصول البطاقات البالغ عددها 247 في هذه المجموعة.
فتح الحزمة
k this deck
40
Which of the following is the graphical analog of a frequency table?
A)histogram
B)scatter plot
C)time series plot
D)contingency table
A)histogram
B)scatter plot
C)time series plot
D)contingency table
فتح الحزمة
افتح القفل للوصول البطاقات البالغ عددها 247 في هذه المجموعة.
فتح الحزمة
k this deck
41
When data is collected using a qualitative,nominal variable,what is true about a frequency distribution that summarizes the data?
A)Lower and upper class limits can be computed.
B)Class midpoints can be computed.
C)Number of classes corresponds to number of the variable's categories.
D)None of the above
A)Lower and upper class limits can be computed.
B)Class midpoints can be computed.
C)Number of classes corresponds to number of the variable's categories.
D)None of the above
فتح الحزمة
افتح القفل للوصول البطاقات البالغ عددها 247 في هذه المجموعة.
فتح الحزمة
k this deck
42
If three possible values of a variable represent distinct categories of similar objects or events,the variable is referred to as a:
A)numerical variable.
B)categorical variable.
C)binary variable.
D)none of the above
A)numerical variable.
B)categorical variable.
C)binary variable.
D)none of the above
فتح الحزمة
افتح القفل للوصول البطاقات البالغ عددها 247 في هذه المجموعة.
فتح الحزمة
k this deck
43
THE NEXT QUESTIONS ARE BASED ON THE FOLLOWING INFORMATION:
In a recent marketing experiment,consumers were given one of four different types of dishwashing detergent and asked to use it for a month.At the end of that time they were asked to rate the detergent in terms of overall quality.The results are presented below.
Of the customers who rated their detergent good,what percentage evaluated Brand C?
A)23.6%
B)34.0%
C)8)0%
D)28.8%
فتح الحزمة
افتح القفل للوصول البطاقات البالغ عددها 247 في هذه المجموعة.
فتح الحزمة
k this deck
44
A time-series plot is essentially a:
A)histogram.
B)scatter plot.
C)Pareto diagram.
D)pie chart.
A)histogram.
B)scatter plot.
C)Pareto diagram.
D)pie chart.
فتح الحزمة
افتح القفل للوصول البطاقات البالغ عددها 247 في هذه المجموعة.
فتح الحزمة
k this deck
45
A professor needs to select a volunteer for a project.Which of the following would not be an example of a simple random sample?
A)He chooses a number between 00 and 99.The student whose phone number has the last two digits closest to the one the professor has chosen is selected.
B)He chooses that individual whose name is first in alphabetical order.
C)He puts all student names in a bowl,mixes them up,and selects one.
D)He has each student select a number between 0 and 99 and write it down.He then selects the student whose number is closest to the last two digits of his social security number.
فتح الحزمة
افتح القفل للوصول البطاقات البالغ عددها 247 في هذه المجموعة.
فتح الحزمة
k this deck
46
THE NEXT QUESTIONS ARE BASED ON THE FOLLOWING INFORMATION:
In a recent marketing experiment,consumers were given one of four different types of dishwashing detergent and asked to use it for a month.At the end of that time they were asked to rate the detergent in terms of overall quality.The results are presented below.
Of the customers who were given Brand A,what percentage rated it poor?
A)12.5%
B)2)40%
C)11.6%
D)18.9%
فتح الحزمة
افتح القفل للوصول البطاقات البالغ عددها 247 في هذه المجموعة.
فتح الحزمة
k this deck
47
THE NEXT QUESTIONS ARE BASED ON THE FOLLOWING INFORMATION:
In a recent marketing experiment,consumers were given one of four different types of dishwashing detergent and asked to use it for a month.At the end of that time they were asked to rate the detergent in terms of overall quality.The results are presented below.
What percentage of the consumers evaluated Brand A?
A)20.3%
B)16.7%
C)23.0%
D)18.9%
فتح الحزمة
افتح القفل للوصول البطاقات البالغ عددها 247 في هذه المجموعة.
فتح الحزمة
k this deck
48
THE NEXT QUESTIONS ARE BASED ON THE FOLLOWING INFORMATION:
In a recent marketing experiment,consumers were given one of four different types of dishwashing detergent and asked to use it for a month.At the end of that time they were asked to rate the detergent in terms of overall quality.The results are presented below.
What percentage of the consumers rated their detergent fair or good?
A)49.0%
B)41.0%
C)17.5%
D)23.6%
فتح الحزمة
افتح القفل للوصول البطاقات البالغ عددها 247 في هذه المجموعة.
فتح الحزمة
k this deck
49
Which of the following statements is false?
A)A Pareto diagram is a bar graph with the bars arranged from the most numerous categories to the least numerous categories.
B)A Pareto diagram includes a line graph displaying the cumulative percentages and counts for the bars.
C)A Pareto diagram of types of defects will show the ones that have the greatest effect on the defective rate in order of effect.It is then easy to see which defects should be targeted in order to most effectively lower the defective rate.
D)A Pareto diagram shows the most frequent bars on the right.
فتح الحزمة
افتح القفل للوصول البطاقات البالغ عددها 247 في هذه المجموعة.
فتح الحزمة
k this deck
50
Numerical variables can be subdivided into two types.What are they?
A)diverse and categorical
B)discrete and continuous
C)nominal and progressive
D)cross-sectional and discrete
A)diverse and categorical
B)discrete and continuous
C)nominal and progressive
D)cross-sectional and discrete
فتح الحزمة
افتح القفل للوصول البطاقات البالغ عددها 247 في هذه المجموعة.
فتح الحزمة
k this deck
51
Which analytical tool is often used to separate the "vital few" from the "trivial many"?
A)Pareto diagram
B)pie chart
C)line chart
D)histogram
A)Pareto diagram
B)pie chart
C)line chart
D)histogram
فتح الحزمة
افتح القفل للوصول البطاقات البالغ عددها 247 في هذه المجموعة.
فتح الحزمة
k this deck
52
A variable within a range of real numbers is referred to as a:
A)continuous variable.
B)categorical variable.
C)discrete variable.
D)parameter.
A)continuous variable.
B)categorical variable.
C)discrete variable.
D)parameter.
فتح الحزمة
افتح القفل للوصول البطاقات البالغ عددها 247 في هذه المجموعة.
فتح الحزمة
k this deck
53
A summary measure that is computed from a sample to describe a characteristic of the population is known as a(n):
A)parameter.
B)statistic.
C)population.
D)inferential statistic.
A)parameter.
B)statistic.
C)population.
D)inferential statistic.
فتح الحزمة
افتح القفل للوصول البطاقات البالغ عددها 247 في هذه المجموعة.
فتح الحزمة
k this deck
54
Dimensional characteristics,such as height,are an example of a:
A)continuous random variable.
B)discrete random variable.
C)categorical random variable.
D)any of the above
A)continuous random variable.
B)discrete random variable.
C)categorical random variable.
D)any of the above
فتح الحزمة
افتح القفل للوصول البطاقات البالغ عددها 247 في هذه المجموعة.
فتح الحزمة
k this deck
55
Gender and state of birth are examples of which type of data?
A)discrete
B)continuous
C)categorical
D)ordinal
A)discrete
B)continuous
C)categorical
D)ordinal
فتح الحزمة
افتح القفل للوصول البطاقات البالغ عددها 247 في هذه المجموعة.
فتح الحزمة
k this deck
56
An observed subset of the population that is usually selected for analysis is called:
A)knowledge.
B)a sample.
C)a statistic.
D)a process.
A)knowledge.
B)a sample.
C)a statistic.
D)a process.
فتح الحزمة
افتح القفل للوصول البطاقات البالغ عددها 247 في هذه المجموعة.
فتح الحزمة
k this deck
57
In a frequency distribution,what is the number of observations in a class called?
A)class midpoint
B)class frequency
C)class interval
D)none of the above
A)class midpoint
B)class frequency
C)class interval
D)none of the above
فتح الحزمة
افتح القفل للوصول البطاقات البالغ عددها 247 في هذه المجموعة.
فتح الحزمة
k this deck
58
THE NEXT QUESTIONS ARE BASED ON THE FOLLOWING INFORMATION:
In a recent marketing experiment,consumers were given one of four different types of dishwashing detergent and asked to use it for a month.At the end of that time they were asked to rate the detergent in terms of overall quality.The results are presented below.
What percentage of the consumers rated their detergent below average?
A)41.0%
B)59.0%
C)17.5%
D)18.9%
فتح الحزمة
افتح القفل للوصول البطاقات البالغ عددها 247 في هذه المجموعة.
فتح الحزمة
k this deck
59
A variable is classified as ordinal if:
A)there is a natural ordering of categories.
B)there is no natural ordering of categories.
C)the data arise from continuous measurements.
D)the variable is tracked over a period of time.
A)there is a natural ordering of categories.
B)there is no natural ordering of categories.
C)the data arise from continuous measurements.
D)the variable is tracked over a period of time.
فتح الحزمة
افتح القفل للوصول البطاقات البالغ عددها 247 في هذه المجموعة.
فتح الحزمة
k this deck
60
THE NEXT QUESTIONS ARE BASED ON THE FOLLOWING INFORMATION:
In a recent marketing experiment,consumers were given one of four different types of dishwashing detergent and asked to use it for a month.At the end of that time they were asked to rate the detergent in terms of overall quality.The results are presented below.
What percentage of the consumers rated their detergent average or better?
A)23.6%
B)40.1%
C)81.1%
D)17.5%
فتح الحزمة
افتح القفل للوصول البطاقات البالغ عددها 247 في هذه المجموعة.
فتح الحزمة
k this deck
61
The bar chart that best identifies major causes of problems or defects by displaying the frequency of defect causes is called a:
A)pie chart.
B)scatter plot.
C)stem-and-leaf display.
D)Pareto diagram.
A)pie chart.
B)scatter plot.
C)stem-and-leaf display.
D)Pareto diagram.
فتح الحزمة
افتح القفل للوصول البطاقات البالغ عددها 247 في هذه المجموعة.
فتح الحزمة
k this deck
62
The type of variables which produce responses that belong to groups or categories,such as responses to yes or no questions,are called:
A)continuous numerical variables.
B)discrete numerical variables.
C)categorical variables.
D)inverse variables.
A)continuous numerical variables.
B)discrete numerical variables.
C)categorical variables.
D)inverse variables.
فتح الحزمة
افتح القفل للوصول البطاقات البالغ عددها 247 في هذه المجموعة.
فتح الحزمة
k this deck
63
A baseball player is assigned the number 15 and another one the number 25.This is an example of ________ data.
A)quantitative
B)interval
C)ratio levels
D)qualitative
A)quantitative
B)interval
C)ratio levels
D)qualitative
فتح الحزمة
افتح القفل للوصول البطاقات البالغ عددها 247 في هذه المجموعة.
فتح الحزمة
k this deck
64
Which of the following statements about a pie chart is false?
A)A pie chart is graphical representation of the proportion or percentage of frequency of each category of a categorical variable.
B)A pie chart is usually used to display the relative sizes of categories of a numerical variable.
C)A pie chart always has the shape of a circle.
D)The size of each slice of a pie chart is the proportion or percentage of frequency of the corresponding category of a categorical variable.
فتح الحزمة
افتح القفل للوصول البطاقات البالغ عددها 247 في هذه المجموعة.
فتح الحزمة
k this deck
65
A source of error resulting from the fact that information is available only on a subset of the total population is referred to as a(n):
A)nonsampling error.
B)irrelevant error.
C)inaccurate error.
D)sampling error.
A)nonsampling error.
B)irrelevant error.
C)inaccurate error.
D)sampling error.
فتح الحزمة
افتح القفل للوصول البطاقات البالغ عددها 247 في هذه المجموعة.
فتح الحزمة
k this deck
66
Annual university enrollment,annual interest rates,daily stock closing prices for shares,and monthly products sales are examples of which type of data?
A)parameters
B)Pareto diagram
C)time-series data
D)pie charts
A)parameters
B)Pareto diagram
C)time-series data
D)pie charts
فتح الحزمة
افتح القفل للوصول البطاقات البالغ عددها 247 في هذه المجموعة.
فتح الحزمة
k this deck
67
A more serious error resulting from errors in the kind of sampling procedure used is called a(n):
A)nonsampling error.
B)irrelevant error.
C)inaccurate error.
D)sampling error.
A)nonsampling error.
B)irrelevant error.
C)inaccurate error.
D)sampling error.
فتح الحزمة
افتح القفل للوصول البطاقات البالغ عددها 247 في هذه المجموعة.
فتح الحزمة
k this deck
68
What is the best type of chart for comparing two sets of categorical data?
A)Ogive
B)bar chart
C)pie chart
D)histogram
A)Ogive
B)bar chart
C)pie chart
D)histogram
فتح الحزمة
افتح القفل للوصول البطاقات البالغ عددها 247 في هذه المجموعة.
فتح الحزمة
k this deck
69
THE NEXT QUESTIONS ARE BASED ON THE FOLLOWING INFORMATION:
What percentage of music is listened to on mobile devices?
A)39%
B)76%
C)20%
D)46%
What percentage of music is listened to on mobile devices?
A)39%
B)76%
C)20%
D)46%
فتح الحزمة
افتح القفل للوصول البطاقات البالغ عددها 247 في هذه المجموعة.
فتح الحزمة
k this deck
70
One manner in which to bring attention to data summarized in a table showing relative frequencies is by the use of a:
A)bar chart.
B)pie chart.
C)scatter plot.
D)stem-and-leaf display.
A)bar chart.
B)pie chart.
C)scatter plot.
D)stem-and-leaf display.
فتح الحزمة
افتح القفل للوصول البطاقات البالغ عددها 247 في هذه المجموعة.
فتح الحزمة
k this deck
71
THE NEXT QUESTIONS ARE BASED ON THE FOLLOWING INFORMATION:
Where is most music listened to?
A)Car
B)Ipod
C)PC
D)Living Room
Where is most music listened to?
A)Car
B)Ipod
C)PC
D)Living Room
فتح الحزمة
افتح القفل للوصول البطاقات البالغ عددها 247 في هذه المجموعة.
فتح الحزمة
k this deck
72
Anita collected a data set on the weights (to the nearest pounds)of all students at her university.The best graph to describe this data is a:
A)histogram
B)pie chart
C)bar chart
D)scatter plot
A)histogram
B)pie chart
C)bar chart
D)scatter plot
فتح الحزمة
افتح القفل للوصول البطاقات البالغ عددها 247 في هذه المجموعة.
فتح الحزمة
k this deck
73
A table used to organize data where the left column includes classes or groups and the right column includes the frequencies or observation for each class is called a:
A)crosstab.
B)frequency distribution.
C)relative frequency distribution.
D)class chart.
A)crosstab.
B)frequency distribution.
C)relative frequency distribution.
D)class chart.
فتح الحزمة
افتح القفل للوصول البطاقات البالغ عددها 247 في هذه المجموعة.
فتح الحزمة
k this deck
74
If the observations are not symmetrically distributed on either side of its center,the histogram is said to be:
A)leaning.
B)pointing.
C)skewed.
D)wide.
A)leaning.
B)pointing.
C)skewed.
D)wide.
فتح الحزمة
افتح القفل للوصول البطاقات البالغ عددها 247 في هذه المجموعة.
فتح الحزمة
k this deck
75
The table which lists the number of observations for every combination of values for two categorical or ordinal variables is called a:
A)frequency distribution.
B)relative frequency distribution.
C)cross table.
D)class chart.
A)frequency distribution.
B)relative frequency distribution.
C)cross table.
D)class chart.
فتح الحزمة
افتح القفل للوصول البطاقات البالغ عددها 247 في هذه المجموعة.
فتح الحزمة
k this deck
76
The procedure used to select a sample of objects from a population in a way that each member of the population is chosen strictly by chance and is equally likely to be chosen is called:
A)sampled population.
B)systematic sampling.
C)simple random sampling.
D)self-selected sampling.
A)sampled population.
B)systematic sampling.
C)simple random sampling.
D)self-selected sampling.
فتح الحزمة
افتح القفل للوصول البطاقات البالغ عددها 247 في هذه المجموعة.
فتح الحزمة
k this deck
77
A frequency distribution of numerical data differs from a frequency distribution for categorical data in that a frequency distribution for numerical data:
A)focuses on number and width of classes.
B)does not contain classes.
C)lists the classes in the right column.
D)lists the observations in the left column.
A)focuses on number and width of classes.
B)does not contain classes.
C)lists the classes in the right column.
D)lists the observations in the left column.
فتح الحزمة
افتح القفل للوصول البطاقات البالغ عددها 247 في هذه المجموعة.
فتح الحزمة
k this deck
78
A researcher randomly picks the first item or subject from a population,N then selects each jth subject where j is the ratio of the population size,N to the desired sample size,n.In this case,the researcher is using:
A)random sampling.
B)systematic random sampling.
C)population sampling.
D)parameter sampling.
A)random sampling.
B)systematic random sampling.
C)population sampling.
D)parameter sampling.
فتح الحزمة
افتح القفل للوصول البطاقات البالغ عددها 247 في هذه المجموعة.
فتح الحزمة
k this deck
79
Suppose a sample size of 50 is desired and the population consists of 2,500 names in alphabetical order.The jth,or systematic sampling number would be:
A)50.
B)100.
C)250.
D)500.
A)50.
B)100.
C)250.
D)500.
فتح الحزمة
افتح القفل للوصول البطاقات البالغ عددها 247 في هذه المجموعة.
فتح الحزمة
k this deck
80
We can describe graphically the shape of a distribution by a:
A)pie chart.
B)histogram.
C)scatter plot.
D)line chart.
A)pie chart.
B)histogram.
C)scatter plot.
D)line chart.
فتح الحزمة
افتح القفل للوصول البطاقات البالغ عددها 247 في هذه المجموعة.
فتح الحزمة
k this deck
فتح الحزمة
افتح القفل للوصول البطاقات البالغ عددها 247 في هذه المجموعة.


