Deck 3: Descriptive Statistics
ملء الشاشة (f)
سؤال
سؤال
سؤال
سؤال
سؤال
سؤال
سؤال
سؤال
سؤال
سؤال
سؤال
سؤال
سؤال
سؤال
سؤال
سؤال
سؤال
سؤال
سؤال
سؤال
سؤال
سؤال
سؤال
سؤال
سؤال
سؤال
سؤال
سؤال
سؤال
سؤال
An instructor is evaluating the performance of students on a test. He records the number of points that each student missed and created a frequency distribution. This is provided below: 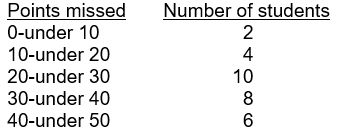
What is the variance for this population?
A) 11.43
B) 135.17
C) 130.67
D) 180.67
E) 198.07
What is the variance for this population?
A) 11.43
B) 135.17
C) 130.67
D) 180.67
E) 198.07
سؤال
سؤال
سؤال
سؤال
سؤال
سؤال
Liz Chapa manages a portfolio of 250 common stocks. Her staff compiled the following performance statistics for two new stocks:  The coefficient of variation for Salas Products, Inc. is ___.
A) 300%
B) 100%
C) 33%
D) 5%
E) 23%
The coefficient of variation for Salas Products, Inc. is ___.A) 300%
B) 100%
C) 33%
D) 5%
E) 23%
سؤال
سؤال
The ages of students in a class have been put into the frequency distribution below. 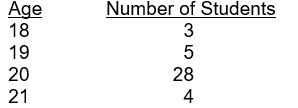
What is the standard deviation for this (population) set of data?
A) 0.494
B) 0.703
C) 1.12
D) 1.25
E) 1.35
What is the standard deviation for this (population) set of data?
A) 0.494
B) 0.703
C) 1.12
D) 1.25
E) 1.35
سؤال
سؤال
سؤال
The following frequency distribution was constructed for the age of accounts receivable: 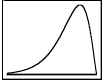 The frequency distribution reveals that the accounts receivable ages are ___.
A) skewed to the left
B) skewed to the right
C) not skewed
D) normally distributed
E) symmetrical
The frequency distribution reveals that the accounts receivable ages are ___.A) skewed to the left
B) skewed to the right
C) not skewed
D) normally distributed
E) symmetrical
سؤال
The following box and whisker plot was constructed for the age of accounts receivable: 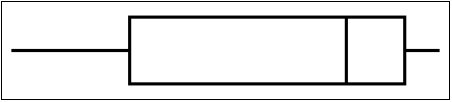 The box and whisker plot reveals that the accounts receivable ages are ___.
A) skewed to the left
B) skewed to the right
C) not skewed
D) normally distributed
E) symmetrical
The box and whisker plot reveals that the accounts receivable ages are ___.A) skewed to the left
B) skewed to the right
C) not skewed
D) normally distributed
E) symmetrical
سؤال
سؤال
Shaun Connor, Human Resources Manager for Oil Terminals (OT), is reviewing the operator training hours at OT nationally. His staff compiled the following table of national statistics on operators training hours.  What can Shaun conclude from these statistics?
A) The East Coast distribution is skewed to the left.
B) The East Coast distribution is skewed to the right.
C) The West Coast distribution is skewed to the left.
D) The West Coast distribution is skewed to the right.
E) Both distributions are symmetrical.
What can Shaun conclude from these statistics?A) The East Coast distribution is skewed to the left.
B) The East Coast distribution is skewed to the right.
C) The West Coast distribution is skewed to the left.
D) The West Coast distribution is skewed to the right.
E) Both distributions are symmetrical.
سؤال
سؤال
The following box and whisker plot was constructed for the age of accounts receivable: 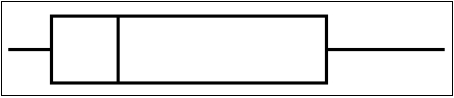 The box and whisker plot reveals that the accounts receivable ages are ___.
A) skewed to the left
B) skewed to the right
C) not skewed
D) normally distributed
E) symmetrical
The box and whisker plot reveals that the accounts receivable ages are ___.A) skewed to the left
B) skewed to the right
C) not skewed
D) normally distributed
E) symmetrical
سؤال
سؤال
سؤال
سؤال
سؤال
سؤال
The following frequency distribution was constructed for the age of accounts receivable: 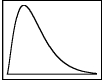 The frequency distribution reveals that the accounts receivable ages are ___.
A) skewed to the left
B) skewed to the right
C) not skewed
D) normally distributed
E) symmetrical
The frequency distribution reveals that the accounts receivable ages are ___.A) skewed to the left
B) skewed to the right
C) not skewed
D) normally distributed
E) symmetrical
سؤال
Karen Merlott, VP for Strategic Planning at a recruitment firm, recently conducts a survey to determine customer satisfaction with job placement. She distributed the survey to 45 of the most recently placed executives. Two items on a survey questionnaire them to rate the importance of "initial interview process" and "satisfaction of final job placement" on a scale of 1 to 10 (with 1 meaning " important" and 10 meaning "highly important"). Her staff assembled the following statistics on these two items.  What can Karen conclude from these statistics?
A) The Initial Interview Process distribution is positively skewed.
B) The Initial Interview Process distribution is not skewed.
C) The Satisfaction of Final Job Placement distribution is negatively skewed.
D) The Satisfaction of Final Job Placement distribution is positively skewed.
E) Both are symmetrically distributed.
What can Karen conclude from these statistics?A) The Initial Interview Process distribution is positively skewed.
B) The Initial Interview Process distribution is not skewed.
C) The Satisfaction of Final Job Placement distribution is negatively skewed.
D) The Satisfaction of Final Job Placement distribution is positively skewed.
E) Both are symmetrically distributed.

فتح الحزمة
قم بالتسجيل لفتح البطاقات في هذه المجموعة!
Unlock Deck
Unlock Deck
1/53
العب
ملء الشاشة (f)
Deck 3: Descriptive Statistics
1
Statistical measures used to yield information about the centre or the middle parts of a group of numbers are called the measures of central tendency.
True
2
A measure of how peaked the data is, is called kurtosis.
False
3
Box and whisker plots are a slow method to determine skewness.
False
4
The most frequently occurring value in a set of data is called the mode.
فتح الحزمة
افتح القفل للوصول البطاقات البالغ عددها 53 في هذه المجموعة.
فتح الحزمة
k this deck
5
One of the main uses of a box and whisker plot is to identify outliers.
فتح الحزمة
افتح القفل للوصول البطاقات البالغ عددها 53 في هذه المجموعة.
فتح الحزمة
k this deck
6
Skewness indicates that a data distribution is symmetrical or asymmetrical.
فتح الحزمة
افتح القفل للوصول البطاقات البالغ عددها 53 في هذه المجموعة.
فتح الحزمة
k this deck
7
A box and whisker plot is determined from the mean, the smallest and the largest values, and the lower and upper quartile.
فتح الحزمة
افتح القفل للوصول البطاقات البالغ عددها 53 في هذه المجموعة.
فتح الحزمة
k this deck
8
The sum of the squared deviations from the arithmetic mean, divided by the sample size minus one is called the sample variance.
فتح الحزمة
افتح القفل للوصول البطاقات البالغ عددها 53 في هذه المجموعة.
فتح الحزمة
k this deck
9
A nonzero value of the skewness indicates asymmetry of the distribution of the data.
فتح الحزمة
افتح القفل للوصول البطاقات البالغ عددها 53 في هذه المجموعة.
فتح الحزمة
k this deck
10
Average deviation is a common measure of the variability of data containing a set of numbers.
فتح الحزمة
افتح القفل للوصول البطاقات البالغ عددها 53 في هذه المجموعة.
فتح الحزمة
k this deck
11
The sample standard deviation is calculated by taking the square root of the population standard deviation.
فتح الحزمة
افتح القفل للوصول البطاقات البالغ عددها 53 في هذه المجموعة.
فتح الحزمة
k this deck
12
Kurtosis is a measure of the association between two numerical variables.
فتح الحزمة
افتح القفل للوصول البطاقات البالغ عددها 53 في هذه المجموعة.
فتح الحزمة
k this deck
13
The sum of deviations about the arithmetic mean is always equal to zero.
فتح الحزمة
افتح القفل للوصول البطاقات البالغ عددها 53 في هذه المجموعة.
فتح الحزمة
k this deck
14
The middle value in an ordered array of numbers is called the mode.
فتح الحزمة
افتح القفل للوصول البطاقات البالغ عددها 53 في هذه المجموعة.
فتح الحزمة
k this deck
15
Excel can produce individual or multiple descriptive statistics.
فتح الحزمة
افتح القفل للوصول البطاقات البالغ عددها 53 في هذه المجموعة.
فتح الحزمة
k this deck
16
If the median of a distribution is greater than mean, then the distribution is skewed to the left.
فتح الحزمة
افتح القفل للوصول البطاقات البالغ عددها 53 في هذه المجموعة.
فتح الحزمة
k this deck
17
Skewness and kurtosis of a data set are measures of the shape of the distribution.
فتح الحزمة
افتح القفل للوصول البطاقات البالغ عددها 53 في هذه المجموعة.
فتح الحزمة
k this deck
18
If the mean of a distribution is greater than the median, then the distribution is positively skewed.
فتح الحزمة
افتح القفل للوصول البطاقات البالغ عددها 53 في هذه المجموعة.
فتح الحزمة
k this deck
19
Box and whisker plots be generated in Excel.
فتح الحزمة
افتح القفل للوصول البطاقات البالغ عددها 53 في هذه المجموعة.
فتح الحزمة
k this deck
20
The range and interquartile range don't take into account all of the values in a data set when describing variation.
فتح الحزمة
افتح القفل للوصول البطاقات البالغ عددها 53 في هذه المجموعة.
فتح الحزمة
k this deck
21
The number of standard deviations that a value (x) is above or below the mean is the ___.
A) absolute deviation
B) coefficient of variation
C) interquartile range
D) z score
E) correlation coefficient
A) absolute deviation
B) coefficient of variation
C) interquartile range
D) z score
E) correlation coefficient
فتح الحزمة
افتح القفل للوصول البطاقات البالغ عددها 53 في هذه المجموعة.
فتح الحزمة
k this deck
22
A commuter travels many kilometres to work each morning. She has timed this trip 5 times during the last month. The time (in minutes) required to make this trip was 34, 39, 41, 35, and 41. The median time (in minutes) required for this trip was ___.
A) 39
B) 41
C) 37.5
D) 38
E) 35.5
A) 39
B) 41
C) 37.5
D) 38
E) 35.5
فتح الحزمة
افتح القفل للوصول البطاقات البالغ عددها 53 في هذه المجموعة.
فتح الحزمة
k this deck
23
A commuter travels many kilometres to work each morning. She has timed this trip 5 times during the last month. The time (in minutes) required to make this trip was 34, 39, 41, 35, and 41. The modal time required for this trip was ___.
A) 39
B) 41
C) 37.5
D) 38
E) 35
A) 39
B) 41
C) 37.5
D) 38
E) 35
فتح الحزمة
افتح القفل للوصول البطاقات البالغ عددها 53 في هذه المجموعة.
فتح الحزمة
k this deck
24
The quartile divides the first three quarters of the data from the last quarter and is equal to the value of the 75th percentile.
A) 1st
B) 2nd
C) 3rd
D) 4th
A) 1st
B) 2nd
C) 3rd
D) 4th
فتح الحزمة
افتح القفل للوصول البطاقات البالغ عددها 53 في هذه المجموعة.
فتح الحزمة
k this deck
25
Consider the following data: 0, 2, 4, 6, 11, 12, 13. The 35th percentile is
A) 5.
B) 4.
C) 2.
D) 6.
E) 11.
A) 5.
B) 4.
C) 2.
D) 6.
E) 11.
فتح الحزمة
افتح القفل للوصول البطاقات البالغ عددها 53 في هذه المجموعة.
فتح الحزمة
k this deck
26
The ages of ten seniors are 71, 68, 75, 68, 62, 80, 73, 68, 67, 70. The 90th percentile is
A) 68.0.
B) 75.5.
C) 70.5.
D) 77.5.
E) 73.0.
A) 68.0.
B) 75.5.
C) 70.5.
D) 77.5.
E) 73.0.
فتح الحزمة
افتح القفل للوصول البطاقات البالغ عددها 53 في هذه المجموعة.
فتح الحزمة
k this deck
27
A statistics student made the following grades on five tests: 84, 78, 88, 72, and 72. What is the median grade?
A) 88
B) 72
C) 78
D) 80
E) 82
A) 88
B) 72
C) 78
D) 80
E) 82
فتح الحزمة
افتح القفل للوصول البطاقات البالغ عددها 53 في هذه المجموعة.
فتح الحزمة
k this deck
28
In a hearing test, subjects estimate the loudness of a sound in decibels. The results are: 71, 68, 75, 68, 62, 80, 73, 68, 68, 67, 70. Compute the median.
A) 68
B) 75
C) 70
D) 69
E) 73
A) 68
B) 75
C) 70
D) 69
E) 73
فتح الحزمة
افتح القفل للوصول البطاقات البالغ عددها 53 في هذه المجموعة.
فتح الحزمة
k this deck
29
___ are quantiles that divide a group of data into 100 parts.
A) Quartiles
B) Quantiles
C) Percentiles
D) Qucentiles
A) Quartiles
B) Quantiles
C) Percentiles
D) Qucentiles
فتح الحزمة
افتح القفل للوصول البطاقات البالغ عددها 53 في هذه المجموعة.
فتح الحزمة
k this deck
30
An instructor is evaluating the performance of students on a test. He records the number of points that each student missed and created a frequency distribution. This is provided below:
What is the variance for this population?
A) 11.43
B) 135.17
C) 130.67
D) 180.67
E) 198.07
What is the variance for this population?
A) 11.43
B) 135.17
C) 130.67
D) 180.67
E) 198.07
فتح الحزمة
افتح القفل للوصول البطاقات البالغ عددها 53 في هذه المجموعة.
فتح الحزمة
k this deck
31
A statistics student made the following grades on five tests: 84, 78, 88, 78, and 82. What is the mode?
A) 78
B) 80
C) 88
D) 84
E) 82
A) 78
B) 80
C) 88
D) 84
E) 82
فتح الحزمة
افتح القفل للوصول البطاقات البالغ عددها 53 في هذه المجموعة.
فتح الحزمة
k this deck
32
Quantiles can be used with ___ data only.
A) qualitative
B) quantitative
C) numerical
D) individual points of
A) qualitative
B) quantitative
C) numerical
D) individual points of
فتح الحزمة
افتح القفل للوصول البطاقات البالغ عددها 53 في هذه المجموعة.
فتح الحزمة
k this deck
33
A statistics student made the following grades on five tests: 84, 78, 88, 78, and 72. What is the mean grade?
A) 78
B) 80
C) 72
D) 84
E) 88
A) 78
B) 80
C) 72
D) 84
E) 88
فتح الحزمة
افتح القفل للوصول البطاقات البالغ عددها 53 في هذه المجموعة.
فتح الحزمة
k this deck
34
The spread or dispersion of a set of data is called
A) range
B) coefficient of variation
C) measures of variation
D) mean absolute deviation
A) range
B) coefficient of variation
C) measures of variation
D) mean absolute deviation
فتح الحزمة
افتح القفل للوصول البطاقات البالغ عددها 53 في هذه المجموعة.
فتح الحزمة
k this deck
35
___ are used to describe the data set.
A) Quantiles
B) Quartiles
C) Percentiles
D) Qucentiles
A) Quantiles
B) Quartiles
C) Percentiles
D) Qucentiles
فتح الحزمة
افتح القفل للوصول البطاقات البالغ عددها 53 في هذه المجموعة.
فتح الحزمة
k this deck
36
Liz Chapa manages a portfolio of 250 common stocks. Her staff compiled the following performance statistics for two new stocks: The coefficient of variation for Salas Products, Inc. is ___.
A) 300%
B) 100%
C) 33%
D) 5%
E) 23%
The coefficient of variation for Salas Products, Inc. is ___.A) 300%
B) 100%
C) 33%
D) 5%
E) 23%
فتح الحزمة
افتح القفل للوصول البطاقات البالغ عددها 53 في هذه المجموعة.
فتح الحزمة
k this deck
37
A commuter travels many kilometres to work each morning. She has timed this trip 5 times during the last month. The time (in minutes) required to make this trip was 34, 39, 41, 35, and 41. The mean time (in minutes) required for this trip was ___.
A) 35
B) 41
C) 37.5
D) 38
E) 35.5
A) 35
B) 41
C) 37.5
D) 38
E) 35.5
فتح الحزمة
افتح القفل للوصول البطاقات البالغ عددها 53 في هذه المجموعة.
فتح الحزمة
k this deck
38
The ages of students in a class have been put into the frequency distribution below.
What is the standard deviation for this (population) set of data?
A) 0.494
B) 0.703
C) 1.12
D) 1.25
E) 1.35
What is the standard deviation for this (population) set of data?
A) 0.494
B) 0.703
C) 1.12
D) 1.25
E) 1.35
فتح الحزمة
افتح القفل للوصول البطاقات البالغ عددها 53 في هذه المجموعة.
فتح الحزمة
k this deck
39
Consider the following data: 0, 2, 4, 6, 11, 12, 13. The first (Q1) and third (Q3) quartiles are
A) 0 and 6.
B) 2 and 11.
C) 2 and 12.
D) 0 and 12.
E) 6 and 12.
A) 0 and 6.
B) 2 and 11.
C) 2 and 12.
D) 0 and 12.
E) 6 and 12.
فتح الحزمة
افتح القفل للوصول البطاقات البالغ عددها 53 في هذه المجموعة.
فتح الحزمة
k this deck
40
You do need to highlight the data in Excel to use it for your analysis.
فتح الحزمة
افتح القفل للوصول البطاقات البالغ عددها 53 في هذه المجموعة.
فتح الحزمة
k this deck
41
The following frequency distribution was constructed for the age of accounts receivable: The frequency distribution reveals that the accounts receivable ages are ___.
A) skewed to the left
B) skewed to the right
C) not skewed
D) normally distributed
E) symmetrical
The frequency distribution reveals that the accounts receivable ages are ___.A) skewed to the left
B) skewed to the right
C) not skewed
D) normally distributed
E) symmetrical
فتح الحزمة
افتح القفل للوصول البطاقات البالغ عددها 53 في هذه المجموعة.
فتح الحزمة
k this deck
42
The following box and whisker plot was constructed for the age of accounts receivable: The box and whisker plot reveals that the accounts receivable ages are ___.
A) skewed to the left
B) skewed to the right
C) not skewed
D) normally distributed
E) symmetrical
The box and whisker plot reveals that the accounts receivable ages are ___.A) skewed to the left
B) skewed to the right
C) not skewed
D) normally distributed
E) symmetrical
فتح الحزمة
افتح القفل للوصول البطاقات البالغ عددها 53 في هذه المجموعة.
فتح الحزمة
k this deck
43
Excel's most powerful statistical tools are found in the ___ ToolPak.
A) Statistics
B) Descriptive Statistics
C) Analysis
D) Data Analysis
A) Statistics
B) Descriptive Statistics
C) Analysis
D) Data Analysis
فتح الحزمة
افتح القفل للوصول البطاقات البالغ عددها 53 في هذه المجموعة.
فتح الحزمة
k this deck
44
Shaun Connor, Human Resources Manager for Oil Terminals (OT), is reviewing the operator training hours at OT nationally. His staff compiled the following table of national statistics on operators training hours. What can Shaun conclude from these statistics?
A) The East Coast distribution is skewed to the left.
B) The East Coast distribution is skewed to the right.
C) The West Coast distribution is skewed to the left.
D) The West Coast distribution is skewed to the right.
E) Both distributions are symmetrical.
What can Shaun conclude from these statistics?A) The East Coast distribution is skewed to the left.
B) The East Coast distribution is skewed to the right.
C) The West Coast distribution is skewed to the left.
D) The West Coast distribution is skewed to the right.
E) Both distributions are symmetrical.
فتح الحزمة
افتح القفل للوصول البطاقات البالغ عددها 53 في هذه المجموعة.
فتح الحزمة
k this deck
45
The number of speeding tickets given by a sample of 14 police officers in a month are as follows: 63, 35, 67, 63, 55, 75, 84, 13, 67, 54, 59, 49, 58, and 67. Compute the range, interquartile range and the standard deviation.
فتح الحزمة
افتح القفل للوصول البطاقات البالغ عددها 53 في هذه المجموعة.
فتح الحزمة
k this deck
46
The following box and whisker plot was constructed for the age of accounts receivable: The box and whisker plot reveals that the accounts receivable ages are ___.
A) skewed to the left
B) skewed to the right
C) not skewed
D) normally distributed
E) symmetrical
The box and whisker plot reveals that the accounts receivable ages are ___.A) skewed to the left
B) skewed to the right
C) not skewed
D) normally distributed
E) symmetrical
فتح الحزمة
افتح القفل للوصول البطاقات البالغ عددها 53 في هذه المجموعة.
فتح الحزمة
k this deck
47
When you use Excel's most powerful statistical tools, the results
A) update automatically when you change the data.
B) are static.
C) can only be run for one statistical test at a time.
D) are temporary.
A) update automatically when you change the data.
B) are static.
C) can only be run for one statistical test at a time.
D) are temporary.
فتح الحزمة
افتح القفل للوصول البطاقات البالغ عددها 53 في هذه المجموعة.
فتح الحزمة
k this deck
48
The A-Life and Kafi companies have 40 and 65 employees respectively. Their average weekly wages are $450 and $350. The standard deviations are 7 and 9 respectively. Which company has a larger variability in wages?
فتح الحزمة
افتح القفل للوصول البطاقات البالغ عددها 53 في هذه المجموعة.
فتح الحزمة
k this deck
49
In a hearing test, subjects estimated the loudness of a sound in decibels. The results are: 71, 68, 75, 68, 62, 80, 73, 68, 68, 67, 70. Compute the mean, median and mode.
فتح الحزمة
افتح القفل للوصول البطاقات البالغ عددها 53 في هذه المجموعة.
فتح الحزمة
k this deck
50
The number of speeding tickets given by a sample of 14 police officers in a month are as follows: 63, 35, 67, 63, 55, 75, 84, 13, 67, 54, 59, 49, 58, and 67. Compute the 5 Number Summary for the sample. (Note: The 5 Number Summary are the minimum, Q1, Q2, Q3 and the maximum).
فتح الحزمة
افتح القفل للوصول البطاقات البالغ عددها 53 في هذه المجموعة.
فتح الحزمة
k this deck
51
Data values outside the fences in a distribution using a box and whisker plot are ___.
A) inliers
B) outliers
C) boxliers
D) fenceliers
A) inliers
B) outliers
C) boxliers
D) fenceliers
فتح الحزمة
افتح القفل للوصول البطاقات البالغ عددها 53 في هذه المجموعة.
فتح الحزمة
k this deck
52
The following frequency distribution was constructed for the age of accounts receivable: The frequency distribution reveals that the accounts receivable ages are ___.
A) skewed to the left
B) skewed to the right
C) not skewed
D) normally distributed
E) symmetrical
The frequency distribution reveals that the accounts receivable ages are ___.A) skewed to the left
B) skewed to the right
C) not skewed
D) normally distributed
E) symmetrical
فتح الحزمة
افتح القفل للوصول البطاقات البالغ عددها 53 في هذه المجموعة.
فتح الحزمة
k this deck
53
Karen Merlott, VP for Strategic Planning at a recruitment firm, recently conducts a survey to determine customer satisfaction with job placement. She distributed the survey to 45 of the most recently placed executives. Two items on a survey questionnaire them to rate the importance of "initial interview process" and "satisfaction of final job placement" on a scale of 1 to 10 (with 1 meaning " important" and 10 meaning "highly important"). Her staff assembled the following statistics on these two items. What can Karen conclude from these statistics?
A) The Initial Interview Process distribution is positively skewed.
B) The Initial Interview Process distribution is not skewed.
C) The Satisfaction of Final Job Placement distribution is negatively skewed.
D) The Satisfaction of Final Job Placement distribution is positively skewed.
E) Both are symmetrically distributed.
What can Karen conclude from these statistics?A) The Initial Interview Process distribution is positively skewed.
B) The Initial Interview Process distribution is not skewed.
C) The Satisfaction of Final Job Placement distribution is negatively skewed.
D) The Satisfaction of Final Job Placement distribution is positively skewed.
E) Both are symmetrically distributed.
فتح الحزمة
افتح القفل للوصول البطاقات البالغ عددها 53 في هذه المجموعة.
فتح الحزمة
k this deck
فتح الحزمة
افتح القفل للوصول البطاقات البالغ عددها 53 في هذه المجموعة.


