Deck 9: Demand for Goods and Supply of Labor and Capital
ملء الشاشة (f)
سؤال
سؤال
سؤال
سؤال
سؤال
سؤال
سؤال
سؤال
سؤال
سؤال
سؤال
سؤال
Suppose that utility over consumption and leisure takes the constant elasticity of substitution form 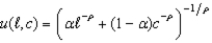 .If
.If  falls between 0 and -1, then the labor supply curve is backward bending.
.If falls between 0 and -1, then the labor supply curve is backward bending. سؤال
سؤال
سؤال
سؤال
سؤال
سؤال
سؤال
سؤال
سؤال
Suppose your utility function is given by 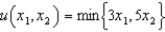 .What is your demand function for
  ?
?
.What is your demand function for ? سؤال
Suppose your tastes can be represented by the utility function 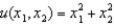 .Your demand for
  is
is
A) .
.
B) .
.
C)
D)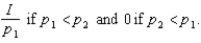
E)None of the above
.Your demand for isA)
.B)
.C)
D)
E)None of the above
سؤال
Consider a consumer who consumes only  and
and  .The price of
  falls.
a.On a graph with on the horizontal and
  on the vertical axis, illustrate the change in this consumer's budget constraint assuming exogenous income I.
b.Illustrate income and substitution effects for assuming that both goods are normal.
c.Can you tell whether the cross-price demand curve for is upward or downward sloping?
d.Suppose is leisure hours and
  is a composite consumption good.Consider an increase in the wage assuming a fixed endowment of leisure (and no exogenous source of income).How is your graph similar and how is it different from what you graphed in (a) through (c)?
e.Is the leisure-demand curve a cross-price demand curve? Why or why not?
and .The price of falls. a.On a graph with
on the horizontal and on the vertical axis, illustrate the change in this consumer's budget constraint assuming exogenous income I. b.Illustrate income and substitution effects for
assuming that both goods are normal. c.Can you tell whether the cross-price demand curve for
is upward or downward sloping? d.Suppose
is leisure hours and is a composite consumption good.Consider an increase in the wage assuming a fixed endowment of leisure (and no exogenous source of income).How is your graph similar and how is it different from what you graphed in (a) through (c)? e.Is the leisure-demand curve a cross-price demand curve? Why or why not?
سؤال
Suppose your tastes can be represented by the utility function  .Your demand function for
  is
is
A) .
.
B) .
.
C)
D)
.Your demand function for isA)
.B)
.C)
D)

فتح الحزمة
قم بالتسجيل لفتح البطاقات في هذه المجموعة!
Unlock Deck
Unlock Deck
1/24
العب
ملء الشاشة (f)
Deck 9: Demand for Goods and Supply of Labor and Capital
1
Holding all prices fixed, income-demand curves relate changes in exogenous income to changes in the quantity of a good demanded.
True
2
Since income and substitution effects point in the same direction for normal goods, the leisure demand curve will be shallower if leisure is a normal good than if leisure is an inferior good.
False
3
If future consumption is a normal good, the interest rate/borrowing relationship cannot be upward sloping.
True
4
The empirically observed backward-bending labor supply curve cannot arise from homothetic tastes.
فتح الحزمة
افتح القفل للوصول البطاقات البالغ عددها 24 في هذه المجموعة.
فتح الحزمة
k this deck
5
Leisure being an inferior good is necessary but not sufficient for labor supply to slope up.
فتح الحزمة
افتح القفل للوصول البطاقات البالغ عددها 24 في هذه المجموعة.
فتح الحزمة
k this deck
6
A downward sloping income-demand curve indicates that the good is a necessity.
فتح الحزمة
افتح القفل للوصول البطاقات البالغ عددها 24 في هذه المجموعة.
فتح الحزمة
k this deck
7
Assuming the same sized substitution effect, normal goods have steeper cross-price demand curves than inferior goods.
فتح الحزمة
افتح القفل للوصول البطاقات البالغ عددها 24 في هذه المجموعة.
فتح الحزمة
k this deck
8
Saving is equivalent to withdrawing financial capital from the market.
فتح الحزمة
افتح القفل للوصول البطاقات البالغ عددها 24 في هذه المجموعة.
فتح الحزمة
k this deck
9
Leisure being a normal good is neither necessary nor sufficient for labor supply to slope up.
فتح الحزمة
افتح القفل للوصول البطاقات البالغ عددها 24 في هذه المجموعة.
فتح الحزمة
k this deck
10
If a good is quasilinear, its own-price demand curve is vertical.
فتح الحزمة
افتح القفل للوصول البطاقات البالغ عددها 24 في هذه المجموعة.
فتح الحزمة
k this deck
11
The cross-price demand curve for Cobb-Douglas tastes is perfectly vertical.
فتح الحزمة
افتح القفل للوصول البطاقات البالغ عددها 24 في هذه المجموعة.
فتح الحزمة
k this deck
12
Suppose that utility over consumption and leisure takes the constant elasticity of substitution form .If falls between 0 and -1, then the labor supply curve is backward bending.
.If falls between 0 and -1, then the labor supply curve is backward bending. فتح الحزمة
افتح القفل للوصول البطاقات البالغ عددها 24 في هذه المجموعة.
فتح الحزمة
k this deck
13
If tastes are homothetic in leisure and consumption, labor supply curves slope up.
فتح الحزمة
افتح القفل للوصول البطاقات البالغ عددها 24 في هذه المجموعة.
فتح الحزمة
k this deck
14
For the same sized substitution effect, own-price demand curves for inferior goods are steeper than own price demand curves for normal goods.
فتح الحزمة
افتح القفل للوصول البطاقات البالغ عددها 24 في هذه المجموعة.
فتح الحزمة
k this deck
15
An increase in the price of good 2 will cause the demand curve for good 1 to shift out.
فتح الحزمة
افتح القفل للوصول البطاقات البالغ عددها 24 في هذه المجموعة.
فتح الحزمة
k this deck
16
Suppose your tastes over consumption and leisure have constant elasticity of substitution.I observe that, when your wage went up, you continued to work the same number of hours.From this, I can conclude that you have Cobb-Douglas tastes.
فتح الحزمة
افتح القفل للوصول البطاقات البالغ عددها 24 في هذه المجموعة.
فتح الحزمة
k this deck
17
Unless a good is a Giffen good, the demand curve shifts to the right as income rises.
فتح الحزمة
افتح القفل للوصول البطاقات البالغ عددها 24 في هذه المجموعة.
فتح الحزمة
k this deck
18
When tastes are quasilinear in leisure, the labor supply curve is vertical.
فتح الحزمة
افتح القفل للوصول البطاقات البالغ عددها 24 في هذه المجموعة.
فتح الحزمة
k this deck
19
In order for someone to switch from borrowing to saving when the interest rate falls, it must be that current consumption is an inferior good.
فتح الحزمة
افتح القفل للوصول البطاقات البالغ عددها 24 في هذه المجموعة.
فتح الحزمة
k this deck
20
Goods like exclusive designer clothes carry with them prestige value linked to their price.As a result, some people demand more of such goods as the price increases.For those people, such goods are Giffen goods.
فتح الحزمة
افتح القفل للوصول البطاقات البالغ عددها 24 في هذه المجموعة.
فتح الحزمة
k this deck
21
Suppose your utility function is given by .What is your demand function for ?
.What is your demand function for ? فتح الحزمة
افتح القفل للوصول البطاقات البالغ عددها 24 في هذه المجموعة.
فتح الحزمة
k this deck
22
Suppose your tastes can be represented by the utility function .Your demand for is
A) .
B) .
C)
D)
E)None of the above
.Your demand for isA)
.B)
.C)
D)
E)None of the above
فتح الحزمة
افتح القفل للوصول البطاقات البالغ عددها 24 في هذه المجموعة.
فتح الحزمة
k this deck
23
Consider a consumer who consumes only and .The price of falls.
a.On a graph with on the horizontal and on the vertical axis, illustrate the change in this consumer's budget constraint assuming exogenous income I.
b.Illustrate income and substitution effects for assuming that both goods are normal.
c.Can you tell whether the cross-price demand curve for is upward or downward sloping?
d.Suppose is leisure hours and is a composite consumption good.Consider an increase in the wage assuming a fixed endowment of leisure (and no exogenous source of income).How is your graph similar and how is it different from what you graphed in (a) through (c)?
e.Is the leisure-demand curve a cross-price demand curve? Why or why not?
and .The price of falls. a.On a graph with
on the horizontal and on the vertical axis, illustrate the change in this consumer's budget constraint assuming exogenous income I. b.Illustrate income and substitution effects for
assuming that both goods are normal. c.Can you tell whether the cross-price demand curve for
is upward or downward sloping? d.Suppose
is leisure hours and is a composite consumption good.Consider an increase in the wage assuming a fixed endowment of leisure (and no exogenous source of income).How is your graph similar and how is it different from what you graphed in (a) through (c)? e.Is the leisure-demand curve a cross-price demand curve? Why or why not?
فتح الحزمة
افتح القفل للوصول البطاقات البالغ عددها 24 في هذه المجموعة.
فتح الحزمة
k this deck
24
Suppose your tastes can be represented by the utility function .Your demand function for is
A) .
B) .
C)
D)
.Your demand function for isA)
.B)
.C)
D)
فتح الحزمة
افتح القفل للوصول البطاقات البالغ عددها 24 في هذه المجموعة.
فتح الحزمة
k this deck
فتح الحزمة
افتح القفل للوصول البطاقات البالغ عددها 24 في هذه المجموعة.


