Deck 10: Project Scheduling: Lagging, Crashing, and Activity Networks

ملء الشاشة (f)
exit full mode
سؤال
Consider the Gantt chart shown below where the time scale is in minutes and all activities are performed on an early start basis.How much slack is available in The Great Hair Washing project? <strong>Consider the Gantt chart shown below where the time scale is in minutes and all activities are performed on an early start basis.How much slack is available in The Great Hair Washing project?  </strong> A)10 minutes B)15 minutes C)0 minutes D)5 minutes <div style=padding-top: 35px>
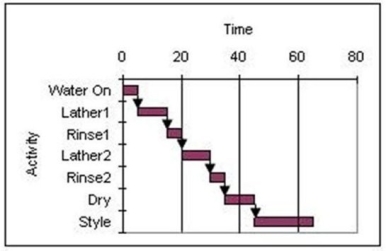
A)10 minutes
B)15 minutes
C)0 minutes
D)5 minutes
استخدم زر المسافة أو
up arrow
down arrow
لقلب البطاقة.
سؤال
 <strong>   -Use the Gantt chart and activity list to determine which resource has the greatest continual use.  \begin{array} { | l | l | l | l | } \hline \text { Activity } & \text { Resources } & \text { Activity } & \text { Resources } \\ \hline  \mathrm {R }&5&  \mathrm { M } & 1 \\ \hline \mathrm { H } & 1 &  \mathrm { K } & 5 \\ \hline \mathrm {G } & 5& \mathrm {~J} & 3 \\ \hline \mathrm { F } & 2 & \mathrm { P } & 1 \\ \hline \mathrm { B } & 2 & \mathrm {S } & 2 \\ \hline \mathrm { T } & 4 & \mathrm {~W} & 3 \\ \hline \end{array}   </strong> A)Resource 4 B)Resource 2 C)Resource 3 D)Resource 5 <div style=padding-top: 35px>

-Use the Gantt chart and activity list to determine which resource has the greatest continual use.  Activity  Resources  Activity  Resources R5M1H1K5G5 J3F2P1B2S2T4 W3\begin{array} { | l | l | l | l | } \hline \text { Activity } & \text { Resources } & \text { Activity } & \text { Resources } \\\hline \mathrm {R }&5& \mathrm { M } & 1 \\\hline \mathrm { H } & 1 & \mathrm { K } & 5 \\\hline \mathrm {G } & 5& \mathrm {~J} & 3 \\\hline \mathrm { F } & 2 & \mathrm { P } & 1 \\\hline \mathrm { B } & 2 & \mathrm {S } & 2 \\\hline \mathrm { T } & 4 & \mathrm {~W} & 3 \\\hline \end{array}


A)Resource 4
B)Resource 2
C)Resource 3
D)Resource 5
سؤال
The least common type of lag relationship occurs when a successor's finish is dependent upon a predecessor's start.
سؤال
 <strong>   -Use the Gantt chart and the activity list to determine which resource is free for use in another project before the others.  \begin{array} { | l | l | l | l | } \hline \text { Activity } & \text { Resources } & \text { Activity } & \text { Resources } \\ \hline\mathrm {  A } & 1 & F & 2 \\ \hline\mathrm {  B }& 3 &\mathrm {  G } & 3 \\ \hline \mathrm {  C } & 4 & \mathrm { H } & 4 \\ \hline \mathrm { D } & 2 & \mathrm {~J} & 5 \\ \hline \mathrm { E } & 2 & \mathrm { K} & 1 \\ \hline \end{array}  </strong> A)Resource 4 B)Resource 3 C)Resource 1 D)Resource 2 <div style=padding-top: 35px>

-Use the Gantt chart and the activity list to determine which resource is free for use in another project before the others.  Activity  Resources  Activity  Resources A1F2B3G3C4H4D2 J5E2K1\begin{array} { | l | l | l | l | } \hline \text { Activity } & \text { Resources } & \text { Activity } & \text { Resources } \\\hline\mathrm { A } & 1 & F & 2 \\\hline\mathrm { B }& 3 &\mathrm { G } & 3 \\\hline \mathrm { C } & 4 & \mathrm { H } & 4 \\\hline \mathrm { D } & 2 & \mathrm {~J} & 5 \\\hline \mathrm { E } & 2 & \mathrm { K} & 1 \\\hline\end{array}

A)Resource 4
B)Resource 3
C)Resource 1
D)Resource 2
سؤال
 <strong>   -Use the Gantt chart and the activity list to determine which resource is used the least.  \begin{array} { | l | l | l | l | } \hline \text { Activity } & \text { Resources } & \text { Activity } & \text { Resources } \\ \hline \mathrm {  A } & 1 & \mathrm { F} & 2 \\ \hline \mathrm { B }& 1 & \mathrm {  G } & 3 \\ \hline \mathrm { C } & 4 & \mathrm { H } & 4 \\ \hline \mathrm { D } & 2 & \mathrm {~J} & 3 \\ \hline \mathrm { E } & 2 & K & 5 \\ \hline \end{array} </strong> A)Resource 1 B)Resource 3 C)Resource 4 D)Resource 2 <div style=padding-top: 35px>

-Use the Gantt chart and the activity list to determine which resource is used the least.  Activity  Resources  Activity  Resources A1F2B1G3C4H4D2 J3E2K5\begin{array} { | l | l | l | l | } \hline \text { Activity } & \text { Resources } & \text { Activity } & \text { Resources } \\\hline \mathrm { A } & 1 & \mathrm { F} & 2 \\\hline \mathrm { B }& 1 & \mathrm { G } & 3 \\\hline \mathrm { C } & 4 & \mathrm { H } & 4 \\\hline \mathrm { D } & 2 & \mathrm {~J} & 3 \\\hline \mathrm { E } & 2 & K & 5 \\\hline\end{array}

A)Resource 1
B)Resource 3
C)Resource 4
D)Resource 2
سؤال
Sketch a network and use it as an example as you discuss the four different logical relationships between activities.
سؤال
A finish to start lag delay is usually shown:

A)As an added value in the predecessor's activity time.
B)On the line adjoining the two activity nodes.
C)As an added value in the predecessors early start time.
D)As a subtracted value in the follower's early finish time.
سؤال
Activities A and B have a finish to finish relationship and early start and finish times as shown.What is the result of incorporating a 4-day lag between activities C and B? <strong>Activities A and B have a finish to finish relationship and early start and finish times as shown.What is the result of incorporating a 4-day lag between activities C and B?  </strong> A)The early finish for A increases to 31. B)The early start time for A increases to 24. C)The early finish time for B increases to 31. D)The early start time for D falls to 23. <div style=padding-top: 35px>

A)The early finish for A increases to 31.
B)The early start time for A increases to 24.
C)The early finish time for B increases to 31.
D)The early start time for D falls to 23.
سؤال
 <strong>   -Use the Gantt chart and activity list to determine which resource is used the least.  \begin{array} { | l | l | l | l | } \hline \text { Activity } & \text { Resources } & \text { Activity } & \text { Resources } \\ \hline  \mathrm {R }&5&  \mathrm { M } & 1 \\ \hline \mathrm { H } & 1 &  \mathrm { K } & 4 \\ \hline \mathrm {G } & 5& \mathrm {~J} & 3 \\ \hline \mathrm { F } & 2 & \mathrm { P } & 1 \\ \hline \mathrm { B } & 2 & \mathrm {S } & 2 \\ \hline \mathrm { T } & 4 & \mathrm {~W} & 3 \\ \hline \end{array}  </strong> A)Resource 1 B)Resource 2 C)Resource 4 D)Resource 5 <div style=padding-top: 35px>

-Use the Gantt chart and activity list to determine which resource is used the least.  Activity  Resources  Activity  Resources R5M1H1K4G5 J3F2P1B2S2T4 W3\begin{array} { | l | l | l | l | } \hline \text { Activity } & \text { Resources } & \text { Activity } & \text { Resources } \\\hline \mathrm {R }&5& \mathrm { M } & 1 \\\hline \mathrm { H } & 1 & \mathrm { K } & 4 \\\hline \mathrm {G } & 5& \mathrm {~J} & 3 \\\hline \mathrm { F } & 2 & \mathrm { P } & 1 \\\hline \mathrm { B } & 2 & \mathrm {S } & 2 \\\hline \mathrm { T } & 4 & \mathrm {~W} & 3 \\\hline \end{array}

A)Resource 1
B)Resource 2
C)Resource 4
D)Resource 5
سؤال
What is the early start time for activity C if it has the start to start relationship shown? <strong>What is the early start time for activity C if it has the start to start relationship shown?  </strong> A)Day 20 B)Day 25 C)Day 27 D)Day 29 <div style=padding-top: 35px>

A)Day 20
B)Day 25
C)Day 27
D)Day 29
سؤال
 <strong>   -Use the Gantt chart and the activity list to determine which resource is used the most.  \begin{array} { | l | l | l | l | } \hline \text { Activity } & \text { Resources } & \text { Activity } & \text { Resources } \\ \hline\mathrm {  A } & 1 & F & 2 \\ \hline\mathrm {  B }& 3 &\mathrm {  G } & 3 \\ \hline \mathbf { C } & 4 & \mathrm { H } & 4 \\ \hline \mathrm { D } & 2 & \mathrm {~J} & 5 \\ \hline \mathrm { E } & 2 & \mathrm { K} & 1 \\ \hline \end{array} </strong> A)Resource 4 B)Resource 3 C)Resource 1 D)Resource 2 <div style=padding-top: 35px>

-Use the Gantt chart and the activity list to determine which resource is used the most.  Activity  Resources  Activity  Resources A1F2B3G3C4H4D2 J5E2K1\begin{array} { | l | l | l | l | } \hline \text { Activity } & \text { Resources } & \text { Activity } & \text { Resources } \\\hline\mathrm { A } & 1 & F & 2 \\\hline\mathrm { B }& 3 &\mathrm { G } & 3 \\\hline \mathbf { C } & 4 & \mathrm { H } & 4 \\\hline \mathrm { D } & 2 & \mathrm {~J} & 5 \\\hline \mathrm { E } & 2 & \mathrm { K} & 1 \\\hline\end{array}

A)Resource 4
B)Resource 3
C)Resource 1
D)Resource 2
سؤال
Finish to start lags are the same as additional activity slack.
سؤال
 <strong>   -Use the Gantt chart and the activity list to determine which resource is needed earliest in this project.  \begin{array} { | l | l | l | l | } \hline \text { Activity } & \text { Resources } & \text { Activity } & \text { Resources } \\ \hline\mathrm {  A } & 1 & F & 2 \\ \hline\mathrm {  B }& 3 &\mathrm {  G } & 3 \\ \hline \mathrm {  C } & 4 & \mathrm { H } & 4 \\ \hline \mathrm { D } & 2 & \mathrm {~J} & 5 \\ \hline \mathrm { E } & 2 & \mathrm { K} & 1 \\ \hline \end{array}   </strong> A)Resource 2 B)Resource 3 C)Resource 1 D)Resource 4 <div style=padding-top: 35px>

-Use the Gantt chart and the activity list to determine which resource is needed earliest in this project.  Activity  Resources  Activity  Resources A1F2B3G3C4H4D2 J5E2K1\begin{array} { | l | l | l | l | } \hline \text { Activity } & \text { Resources } & \text { Activity } & \text { Resources } \\\hline\mathrm { A } & 1 & F & 2 \\\hline\mathrm { B }& 3 &\mathrm { G } & 3 \\\hline \mathrm { C } & 4 & \mathrm { H } & 4 \\\hline \mathrm { D } & 2 & \mathrm {~J} & 5 \\\hline \mathrm { E } & 2 & \mathrm { K} & 1 \\\hline\end{array}


A)Resource 2
B)Resource 3
C)Resource 1
D)Resource 4
سؤال
Which statement about this Gantt chart is BEST? <strong>Which statement about this Gantt chart is BEST?  </strong> A)Activity a has a duration that could be as short as 1 day and as long as 10. B)Activity b probably has activity a as a predecessor. C)No progress has been made on activity c. D)Activity d is the longest activity. <div style=padding-top: 35px>

A)Activity a has a duration that could be as short as 1 day and as long as 10.
B)Activity b probably has activity a as a predecessor.
C)No progress has been made on activity c.
D)Activity d is the longest activity.
سؤال
 <strong>   -Use the Gantt chart and the activity list to determine when resource 5 is free.  \begin{array} { | l | l | l | l | } \hline \text { Activity } & \text { Resources } & \text { Activity } & \text { Resources } \\ \hline \mathrm { A } & 1 & F & 1 \\ \hline \mathrm { B} & 5 & \mathrm {  G } & 2 \\ \hline \mathrm {  C } & 4 & \mathrm { H } & 5 \\ \hline \mathrm { D } & 3 & \mathrm {~J} & 3 \\ \hline \mathrm { E } & 2 & \mathrm {~K} & 4 \\ \hline \end{array} </strong> A)Between 0 and 15 B)Between 15 and 30 C)Between 30 and 45 D)Between 45 and 60 <div style=padding-top: 35px>

-Use the Gantt chart and the activity list to determine when resource 5 is free.  Activity  Resources  Activity  Resources A1F1B5G2C4H5D3 J3E2 K4\begin{array} { | l | l | l | l | } \hline \text { Activity } & \text { Resources } & \text { Activity } & \text { Resources } \\\hline \mathrm { A } & 1 & F & 1 \\\hline \mathrm { B} & 5 & \mathrm { G } & 2 \\\hline \mathrm { C } & 4 & \mathrm { H } & 5 \\\hline \mathrm { D } & 3 & \mathrm {~J} & 3 \\\hline \mathrm { E } & 2 & \mathrm {~K} & 4 \\\hline\end{array}

A)Between 0 and 15
B)Between 15 and 30
C)Between 30 and 45
D)Between 45 and 60
سؤال
 <strong>   -Use the Gantt chart and the activity list to determine when resource 2 is free.  \begin{array} { | l | l | l | l | } \hline \text { Activity } & \text { Resources } & \text { Activity } & \text { Resources } \\ \hline \text { A } & 1 &\mathrm {  F} & 1 \\ \hline \mathrm { B} & 5 & \mathrm { G} & 2 \\ \hline\mathrm {  C } & 4 & \mathrm { H } & 5 \\ \hline \mathrm { D } & 3 & \mathrm {~J} & 3 \\ \hline \mathrm { E } & 2 & \mathrm {~K} & 2 \\ \hline \end{array} </strong> A)Between 0 and 15 B)Between 15 and 30 C)Between 30 and 45 D)Between 45 and 60 <div style=padding-top: 35px>

-Use the Gantt chart and the activity list to determine when resource 2 is free.  Activity  Resources  Activity  Resources  A 1F1B5G2C4H5D3 J3E2 K2\begin{array} { | l | l | l | l | } \hline \text { Activity } & \text { Resources } & \text { Activity } & \text { Resources } \\\hline \text { A } & 1 &\mathrm { F} & 1 \\\hline \mathrm { B} & 5 & \mathrm { G} & 2 \\\hline\mathrm { C } & 4 & \mathrm { H } & 5 \\\hline \mathrm { D } & 3 & \mathrm {~J} & 3 \\\hline \mathrm { E } & 2 & \mathrm {~K} & 2 \\\hline\end{array}

A)Between 0 and 15
B)Between 15 and 30
C)Between 30 and 45
D)Between 45 and 60
سؤال
Activity X has the start to finish relationship shown with activity Y and both have early start and finish times as shown.Which statement is BEST? <strong>Activity X has the start to finish relationship shown with activity Y and both have early start and finish times as shown.Which statement is BEST?  </strong> A)a < d B)a < c C)b < c D)d < a <div style=padding-top: 35px>

A)a < d
B)a < c
C)b < c
D)d < a
سؤال
 <strong>   -Use the Gantt chart and activity list to determine which resource has the greatest continual use.  \begin{array} { | l | l | l | l | } \hline \text { Activity } & \text { Resources } & \text { Activity } & \text { Resources } \\ \hline  \mathrm {R }& 3 &  \mathrm { M } & 1 \\ \hline \mathrm { H } & 1 &  \mathrm { K } & 5 \\ \hline \mathrm {G } & 4 & \mathrm {~J} & 3 \\ \hline \mathrm { F } & 2 & \mathrm { P } & 1 \\ \hline \mathrm { B } & 2 & \mathrm {S } & 2 \\ \hline \mathrm { T } & 4 & \mathrm {~W} & 3 \\ \hline \end{array}   </strong> A)Resource 3 B)Resource 1 C)Resource 2 D)Resource 4 <div style=padding-top: 35px>

-Use the Gantt chart and activity list to determine which resource has the greatest continual use.  Activity  Resources  Activity  Resources R3M1H1K5G4 J3F2P1B2S2T4 W3\begin{array} { | l | l | l | l | } \hline \text { Activity } & \text { Resources } & \text { Activity } & \text { Resources } \\\hline \mathrm {R }& 3 & \mathrm { M } & 1 \\\hline \mathrm { H } & 1 & \mathrm { K } & 5 \\\hline \mathrm {G } & 4 & \mathrm {~J} & 3 \\\hline \mathrm { F } & 2 & \mathrm { P } & 1 \\\hline \mathrm { B } & 2 & \mathrm {S } & 2 \\\hline \mathrm { T } & 4 & \mathrm {~W} & 3 \\\hline \end{array}


A)Resource 3
B)Resource 1
C)Resource 2
D)Resource 4
سؤال
 <strong>   -Use the Gantt chart and activity list to determine when resource 3 is free.  \begin{array} { | l | l | l | l | } \hline \text { Activity } & \text { Resources } & \text { Activity } & \text { Resources } \\ \hline  \mathrm {R }& 3 &  \mathrm { M } & 1 \\ \hline \mathrm { H } & 1 &  \mathrm { K } & 5 \\ \hline \mathrm {G } & 4 & \mathrm {~J} & 3 \\ \hline \mathrm { F } &2 & \mathrm { P } & 1 \\ \hline \mathrm { B } & 2 & \mathrm {S } & 2 \\ \hline \mathrm { T } & 4 & \mathrm {W} & 3 \\ \hline \end{array}  </strong> A)Between 0 and 10 B)Between 10 and 20 C)Between 20 and 30 D)Between 30 and 40 <div style=padding-top: 35px>

-Use the Gantt chart and activity list to determine when resource 3 is free.  Activity  Resources  Activity  Resources R3M1H1K5G4 J3F2P1B2S2T4W3\begin{array} { | l | l | l | l | } \hline \text { Activity } & \text { Resources } & \text { Activity } & \text { Resources } \\\hline \mathrm {R }& 3 & \mathrm { M } & 1 \\\hline \mathrm { H } & 1 & \mathrm { K } & 5 \\\hline \mathrm {G } & 4 & \mathrm {~J} & 3 \\\hline \mathrm { F } &2 & \mathrm { P } & 1 \\\hline \mathrm { B } & 2 & \mathrm {S } & 2 \\\hline \mathrm { T } & 4 & \mathrm {W} & 3 \\\hline \end{array}

A)Between 0 and 10
B)Between 10 and 20
C)Between 20 and 30
D)Between 30 and 40
سؤال
The most common type of logical sequencing between tasks is referred to as the:

A)Finish to start relationship.
B)Finish to finish relationship.
C)Start to start relationship.
D)Start to finish relationship.
سؤال
Use the information in the table to create a baseline Gantt chart for the project where activity lengths are given in days.
 Activity  Duration  Predecessor A6B3AC7AD5BE10CF8D,EG6FH4GJ10GK5H, J\begin{array} { | l | l | l |} \hline \text { Activity } & \text { Duration } & \text { Predecessor } \\\hline\mathrm { A } & 6 & - \\\hline\mathrm { B} & 3 &\mathrm { A } \\\hline \mathrm { C } & 7 & \mathrm {A} \\\hline \mathrm { D } & 5 & \mathrm {B} \\\hline \mathrm { E } & 10 & \mathrm { C } \\\hline \mathrm { F } & 8 & \mathrm { D } , \mathrm { E } \\\hline \mathrm { G } & 6 & \mathrm {F} \\\hline \mathrm { H } & 4 & \mathrm { G } \\\hline \mathrm { J } & 10 & \mathrm { G } \\\hline \mathrm { K } & 5 & \mathrm { H } ,\mathrm {~J} \\\hline\end{array}
سؤال
 <strong>   -Use the Gantt chart and activity list to determine which resource is used the most.  \begin{array} { | l | l | l | l | } \hline \text { Activity } & \text { Resources } & \text { Activity } & \text { Resources } \\ \hline \mathrm { R } & 3,5 & \mathrm { M } & 1,2 \\ \hline \mathrm { H } & 1 & \mathrm {~K} & 4 \\ \hline\mathrm { G } & 2,5 & \mathrm {~J} & 3 \\ \hline \mathrm { F } & 4,1 & \mathrm { P } & 1 \\ \hline\mathrm {B } & 2 &\mathrm {S } & 3,4 \\ \hline \mathrm { T } & 2 & \mathrm { W } & 3 \\ \hline \end{array} </strong> A)Resource 4 B)Resource 2 C)Resource 1 D)Resource 5 <div style=padding-top: 35px>

-Use the Gantt chart and activity list to determine which resource is used the most.  Activity  Resources  Activity  Resources R3,5M1,2H1 K4G2,5 J3F4,1P1B2S3,4T2W3\begin{array} { | l | l | l | l | } \hline \text { Activity } & \text { Resources } & \text { Activity } & \text { Resources } \\\hline \mathrm { R } & 3,5 & \mathrm { M } & 1,2 \\\hline \mathrm { H } & 1 & \mathrm {~K} & 4 \\\hline\mathrm { G } & 2,5 & \mathrm {~J} & 3 \\\hline \mathrm { F } & 4,1 & \mathrm { P } & 1 \\\hline\mathrm {B } & 2 &\mathrm {S } & 3,4 \\\hline \mathrm { T } & 2 & \mathrm { W } & 3 \\\hline\end{array}

A)Resource 4
B)Resource 2
C)Resource 1
D)Resource 5
سؤال
A project manager ascertained that five different resources are needed to complete a project that has been estimated to last 37 days.Just to be on the safe side,the project manager told the client that the project would definitely be delivered in 40 days and 40 nights and arranged to rent the resources for that period of time.The project manager goes to the local rental center at the start of day 1 of the project,signs a 40-day lease agreement for all five resources,and brings them to the site to begin the project.Analyze the Gantt chart and resource list (activity durations are in parenthesis)and determine how much money is being wasted with this rental plan.If each resource could be rented for just the time it takes to complete each activity,what would the charge to the project be?
 A project manager ascertained that five different resources are needed to complete a project that has been estimated to last 37 days.Just to be on the safe side,the project manager told the client that the project would definitely be delivered in 40 days and 40 nights and arranged to rent the resources for that period of time.The project manager goes to the local rental center at the start of day 1 of the project,signs a 40-day lease agreement for all five resources,and brings them to the site to begin the project.Analyze the Gantt chart and resource list (activity durations are in parenthesis)and determine how much money is being wasted with this rental plan.If each resource could be rented for just the time it takes to complete each activity,what would the charge to the project be?    \begin{array} { | l | l | } \hline \text { Resource } & \\ \text { Nurnber } & \text { Daily Rate } \\ \hline 1 & \$ 1,000 \\ \hline 2 & \$ 1,200 \\ \hline 3 & \$ 500 \\ \hline 4 & \$ 750 \\ \hline 5 & \$ 800 \\ \hline \end{array}   \begin{array} { | l | l | l | l | } \hline \text { Activity } & \text { Length } & \text { Activity } & \text { Length } \\ \hline \mathrm { H } & 3 & \mathrm {S } & 3 \\ \hline \mathrm { M } & 9 & \mathrm {~J} & 1 \\ \hline \mathrm { P } & 6 & \mathrm {~W} & 4 \\ \hline \mathrm {B } & 7 &\mathrm { T }& 4 \\ \hline  \mathrm { R } & 9 & \mathrm { G } & 4 \\ \hline \mathrm { F } & 5 &\mathrm {K } & 10 \\ \hline \end{array}  <div style=padding-top: 35px>   Resource  Nurnber  Daily Rate 1$1,0002$1,2003$5004$7505$800\begin{array} { | l | l | } \hline \text { Resource } & \\ \text { Nurnber } & \text { Daily Rate } \\\hline 1 & \$ 1,000 \\\hline 2 & \$ 1,200 \\\hline 3 & \$ 500 \\\hline 4 & \$ 750 \\\hline 5 & \$ 800 \\\hline\end{array}  Activity  Length  Activity  Length H3S3M9 J1P6 W4B7T4R9G4F5K10\begin{array} { | l | l | l | l | } \hline \text { Activity } & \text { Length } & \text { Activity } & \text { Length } \\\hline \mathrm { H } & 3 & \mathrm {S } & 3 \\\hline \mathrm { M } & 9 & \mathrm {~J} & 1 \\\hline \mathrm { P } & 6 & \mathrm {~W} & 4 \\\hline \mathrm {B } & 7 &\mathrm { T }& 4 \\\hline \mathrm { R } & 9 & \mathrm { G } & 4 \\\hline \mathrm { F } & 5 &\mathrm {K } & 10 \\\hline\end{array}
سؤال
In order to accelerate completion of a project,the manager must crash critical path activities.
سؤال
 <strong>   -Use the Gantt chart and activity list to determine which resource is used the most.  \begin{array} { | l | l | l | l | } \hline \text { Activity } & \text { Resources } & \text { Activity } & \text { Resources } \\ \hline  \mathrm {R }&5&  \mathrm { M } & 1 \\ \hline \mathrm { H } & 1 &  \mathrm { K } & 4 \\ \hline \mathrm {G } & 5& \mathrm {~J} & 3 \\ \hline \mathrm { F } & 2 & \mathrm { P } & 1 \\ \hline \mathrm { B } & 2 & \mathrm {S } & 2 \\ \hline \mathrm { T } & 4 & \mathrm {~W} & 3 \\ \hline \end{array}  </strong> A)Resource 1 B)Resource 2 C)Resource 4 D)Resource 5 <div style=padding-top: 35px>

-Use the Gantt chart and activity list to determine which resource is used the most.  Activity  Resources  Activity  Resources R5M1H1K4G5 J3F2P1B2S2T4 W3\begin{array} { | l | l | l | l | } \hline \text { Activity } & \text { Resources } & \text { Activity } & \text { Resources } \\\hline \mathrm {R }&5& \mathrm { M } & 1 \\\hline \mathrm { H } & 1 & \mathrm { K } & 4 \\\hline \mathrm {G } & 5& \mathrm {~J} & 3 \\\hline \mathrm { F } & 2 & \mathrm { P } & 1 \\\hline \mathrm { B } & 2 & \mathrm {S } & 2 \\\hline \mathrm { T } & 4 & \mathrm {~W} & 3 \\\hline \end{array}

A)Resource 1
B)Resource 2
C)Resource 4
D)Resource 5
سؤال
Brook's Law states that the typical crashing decision to add more resources to an activity only delays the activity further.
سؤال
A basic Gantt chart:

A)Clearly displays early and late start and finish times for all activities.
B)Cannot be used to track the project's progress.
C)Permits scheduling resources well before they are needed.
D)Shows dummy activities to preserve network logic.
سؤال
Which of these approaches will NOT accelerate the completion of a project?

A)Improve the productivity of existing project resources.
B)Increase the bureaucratic oversight.
C)Improve the working method.
D)Increase the quantity of personnel and equipment.
سؤال
If an activity's cost is plotted against its duration on axes with zeros at the origin:

A)The slope of the line is positive because it costs more to finish an activity more quickly.
B)The slope of the line is negative because a shorter activity costs less than a longer one.
C)The slope of the line is negative because it costs more to finish an activity more quickly.
D)The slope of the line is positive because a longer activity costs more than a shorter one.
سؤال
One reason for crashing a project is:

A)The project has slipped behind schedule.
B)That the initial schedule may be too pessimistic.
C)Market needs change and the project is not in demand any more.
D)There are no repercussions for delivering the project late.
سؤال
 <strong>   -Use the Gantt chart and activity list to determine which resource is used the least.  \begin{array} { | l | l | l | l | } \hline \text { Activity } & \text { Resources } & \text { Activity } & \text { Resources } \\ \hline \mathrm { R } & 3,5 & \mathrm { M } & 1,2 \\ \hline \mathrm { H } & 1 & \mathrm {~K} & 4 \\ \hline\mathrm { G } & 2,5 & \mathrm {~J} & 3 \\ \hline \mathrm { F } & 4,1 & \mathrm { P } & 1 \\ \hline\mathrm {B } & 2 &\mathrm {S } & 3,4 \\ \hline \mathrm { T } & 2 & \mathrm { W } & 3 \\ \hline \end{array}  </strong> A)Resource 4 B)Resource 2 C)Resource 1 D)Resource 3 <div style=padding-top: 35px>

-Use the Gantt chart and activity list to determine which resource is used the least.  Activity  Resources  Activity  Resources R3,5M1,2H1 K4G2,5 J3F4,1P1B2S3,4T2W3\begin{array} { | l | l | l | l | } \hline \text { Activity } & \text { Resources } & \text { Activity } & \text { Resources } \\\hline \mathrm { R } & 3,5 & \mathrm { M } & 1,2 \\\hline \mathrm { H } & 1 & \mathrm {~K} & 4 \\\hline\mathrm { G } & 2,5 & \mathrm {~J} & 3 \\\hline \mathrm { F } & 4,1 & \mathrm { P } & 1 \\\hline\mathrm {B } & 2 &\mathrm {S } & 3,4 \\\hline \mathrm { T } & 2 & \mathrm { W } & 3 \\\hline\end{array}

A)Resource 4
B)Resource 2
C)Resource 1
D)Resource 3
سؤال
Gantt charts cannot depict float.
سؤال
An activity performed by a subcontractor is scheduled for 20 weeks at an anticipated cost of $100,000.Due to slippage on the critical path you need to reduce this activity by three weeks.If the subcontractor informs you that the activity can be completed in 16 weeks for $200,000,what is the slope for the activity?

A)$5,000 per week
B)$33,333 per week
C)$25,000 per week
D)$12,500 per week
سؤال
What is a Gantt chart,what information does one provide,and what are the benefits of using one?
سؤال
The most common method for shortening activity durations involves the decision to:

A)Eliminate bureaucracy.
B)Alter the technology used in the activity.
C)Assign more senior personnel to the activity.
D)Increase project resources.
سؤال
 <strong>   -Use the Gantt chart and activity list to determine which resource is released from this project for use in another project the earliest.  \begin{array} { | l | l | l | l | } \hline \text { Activity } & \text { Resources } & \text { Activity } & \text { Resources } \\ \hline \mathrm { R } & 3,5 & \mathrm { M } & 1,2 \\ \hline \mathrm { H } & 1 & \mathrm {~K} & 4 \\ \hline\mathrm { G } & 2,5 & \mathrm {~J} & 3 \\ \hline \mathrm { F } & 4,1 & \mathrm { P } & 1 \\ \hline\mathrm {B } & 2 &\mathrm {S } & 3,4 \\ \hline \mathrm { T } & 2 & \mathrm { W } & 3 \\ \hline \end{array}  </strong> A)Resource 2 B)Resource 4 C)Resource 1 D)Resource 3 <div style=padding-top: 35px>

-Use the Gantt chart and activity list to determine which resource is released from this project for use in another project the earliest.  Activity  Resources  Activity  Resources R3,5M1,2H1 K4G2,5 J3F4,1P1B2S3,4T2W3\begin{array} { | l | l | l | l | } \hline \text { Activity } & \text { Resources } & \text { Activity } & \text { Resources } \\\hline \mathrm { R } & 3,5 & \mathrm { M } & 1,2 \\\hline \mathrm { H } & 1 & \mathrm {~K} & 4 \\\hline\mathrm { G } & 2,5 & \mathrm {~J} & 3 \\\hline \mathrm { F } & 4,1 & \mathrm { P } & 1 \\\hline\mathrm {B } & 2 &\mathrm {S } & 3,4 \\\hline \mathrm { T } & 2 & \mathrm { W } & 3 \\\hline\end{array}

A)Resource 2
B)Resource 4
C)Resource 1
D)Resource 3
سؤال
The process of accelerating a project is referred to as:

A)Streamlining.
B)Expediting.
C)Rushing.
D)Crashing.
سؤال
In an actual project,one means of crashing critical path activities would be to perform at a lower level of quality.
سؤال
The critical path may not contain a dummy activity.
سؤال
Gantt charts can display early start or late start logic.
سؤال
A project has the activity duration and cost information indicated in the table where all times are in weeks.What is the total cost for completing this project as quickly as possible?  Activity  Predecessor  Normal  Time  Normal  Cost  Crash Time  Crash Cost  A 8$12,0005$22,000B A 12$18,0009$32,000 C  A 15$22,0009$62,000DB3$9,0002$18,000E C 9$15,0005$35,000FE7$5,0005$8,000GD8$13,0006$23,000HA12$20,0008$32,000JH6$45,0004$56,000\begin{array}{|l|l|l|l|l|l|}\hline \text { Activity } & \text { Predecessor } & \begin{array}{l}\text { Normal } \\\text { Time }\end{array} & \begin{array}{l}\text { Normal } \\\text { Cost }\end{array} & \text { Crash Time } & \text { Crash Cost } \\\hline \text { A } &--& 8 & \$ 12,000 & 5 & \$ 22,000 \\\hline \mathrm{B} & \text { A } & 12 & \$ 18,000 & 9 & \$ 32,000 \\\hline \text { C } & \text { A } & 15 & \$ 22,000 & 9 & \$ 62,000 \\\hline \mathrm{D} & \mathrm{B} & 3 & \$ 9,000 & 2& \$ 18,000 \\\hline \mathbf{E} & \text { C } & 9 & \$ 15,000 & 5 & \$ 35,000 \\\hline \mathrm{F} & \mathrm{E} & 7 & \$ 5,000 & 5 & \$ 8,000 \\\hline \mathrm{G} & \mathrm{D} & 8 & \$ 13,000 & 6 & \$ 23,000 \\\hline \mathrm{H} & \mathrm{A} & 12 & \$ 20,000 & 8 & \$ 32,000 \\\hline \mathrm{J} & \mathrm{H} & 6 & \$ 45,000 & 4 & \$ 56,000 \\\hline\end{array}


A)$244,000
B)$255,600
C)$258,333
D)$262,000
سؤال
A project has the activity duration and cost information indicated in the table where all times are in weeks.What is the total cost for completing this project in 40 days?  Normal  Normal  Activity  Predecessor  Time  Cost  Crash Time  Crash Cost A8$12,0005$22,000BA12$18,0009$32,000CA15$22,0009$62,000DB3$9,0002$18,000EC9$15,0005$35,000FE7$5,0005$8,000GD8$13,0006$23,000HA12$20,0008$32,000JH6$45,0004$56,000\begin{array}{|l|l|l|l|l|l|} \hline &&\text { Normal }&\text { Normal }\\\text { Activity } & \text { Predecessor } & \text { Time } & \text { Cost } & \text { Crash Time }&\text { Crash Cost }\\ \hline \mathrm{A} & - & 8 & \$ 12,000 & 5 & \$ 22,000 \\\hline \mathrm{B} & \mathrm{A} & 12 & \$ 18,000 & 9 & \$ 32,000 \\\hline \mathrm{C} & \mathrm{A} & 15 & \$ 22,000 & 9 & \$ 62,000 \\\hline \mathrm{D} & \mathrm{B} & 3 & \$ 9,000 & 2 & \$ 18,000 \\\hline \mathrm{E} & \mathrm{C} & 9 & \$ 15,000 & 5 & \$ 35,000 \\\hline \mathrm{F} & \mathrm{E} & 7 & \$ 5,000 & 5 & \$ 8,000 \\\hline \mathrm{G} & \mathrm{D} & 8 & \$ 13,000 & 6 & \$ 23,000 \\\hline \mathrm{H} & \mathrm{A} & 12 & \$ 20,000 & 8 & \$ 32,000 \\\hline \mathrm{J} & \mathrm{H} & 6 & \$ 45,000 & 4 & \$ 56,000\\\hline \end{array}

A)$172,000
B)$218,000
C)$192,000
D)$159,000
سؤال
A project has the activity duration and cost information indicated in the table where all times are in weeks.There is a penalty of $250 per week for every week the project extends beyond 32 weeks.What is the cost of the least expensive project possible?  Activity  Narmal  time  Crash  time  Narmal  Cust  Crash  Cast  Predecessar  A 85$1,0002,000B641,5002,000 A C851,8002,300 A B1291,0001,800 BE14119501,450 BF971,5001,900C,DG752,3002,800E,F\begin{array} { | l | l | l | l | l | l } \hline \text { Activity } & \begin{array} { l } \text { Narmal } \\\text { time }\end{array} & \begin{array} { l } \text { Crash } \\\text { time }\end{array} & \begin{array} { l } \text { Narmal } \\\text { Cust }\end{array} & \begin{array} { l } \text { Crash } \\\text { Cast }\end{array} & \text { Predecessar } \\\hline \text { A } & 8 & 5 & \$ 1, 000 & 2,000 & \\\hline B & 6 & 4 & 1,500 & 2,000 & \text { A } \\\hline \mathrm { C } & 8 & 5 & 1,800 & 2,300 & \text { A } \\\hline \mathrm { B } & 12 & 9 & 1,000 & 1,800 & \mathrm {~B} \\\hline \mathrm { E } & 14 & 11 & 950 & 1,450 & \mathrm {~B} \\\hline \mathrm { F } & 9 & 7 & 1,500 & 1,900 & \mathrm { C } , \mathrm { D } \\\hline \mathrm { G } & 7 & 5 & 2,300 & 2,800 & \mathrm { E } , \mathrm { F } \\\hline\end{array}

A)$11,450
B)$12,450
C)$13,450.
D)$14,450
سؤال
A project has the activity duration and cost information indicated in the table where all times are in weeks.What is the lowest total cost for completing this project in 33 weeks?
 Activity  Narmal  time  Crash  time  Normal  Cost  Crash  Cost  Predecessor  A 85$,0002,000B641,5002,000 A C851,8002,300 A B1291,0001,800 BE14119501,450 BF971,5001,900C,DG752,3002,800E,F\begin{array} { | l | l | l | l | l | l| } \hline \text { Activity } & \begin{array} { l } \text { Narmal } \\\text { time }\end{array} & \begin{array} { l } \text { Crash } \\\text { time }\end{array} & \begin{array} { l } \text { Normal } \\\text { Cost }\end{array} & \begin{array} { l } \text { Crash } \\\text { Cost }\end{array} & \text { Predecessor } \\\hline \text { A } & 8 & 5 & \$ , 000 & 2,000 & \\\hline B & 6 & 4 & 1,500 & 2,000 & \text { A } \\\hline \mathrm { C } & 8 & 5 & 1,800 & 2,300 & \text { A } \\\hline \mathrm { B } & 12 & 9 & 1,000 & 1,800 & \mathrm {~B} \\\hline \mathrm { E } & 14 & 11 & 950 & 1,450 & \mathrm {~B} \\\hline \mathrm { F } & 9 & 7 & 1,500 & 1,900 & \mathrm { C } , \mathrm { D } \\\hline \mathrm { G } & 7 & 5 & 2,300 & 2,800 & \mathrm { E } , \mathrm { F } \\\hline\end{array}
سؤال
Given the cost information in the table,what is the cheapest activity to crash on a per week basis?  Activity  Normal Time  Narmal Cost  Crash Time  Crash Cost A8$1,0005$6,000B62,00046,000C92,50068,000D124,000810,000\begin{array} { | l | l | l | l | l | } \hline \text { Activity } & \text { Normal Time } & \text { Narmal Cost } & \text { Crash Time } & \text { Crash Cost } \\\hline \mathrm { A } & 8 & \$ 1,000 & 5 & \$ 6,000 \\\hline \mathrm { B }& 6 & 2,000 & 4 & 6,000 \\\hline \mathrm { C } & 9 & 2,500 & 6 & 8,000 \\\hline \mathrm { D } & 12 & 4,000 & 8 & 10,000 \\\hline\end{array}

A)Activity A
B)Activity B
C)Activity C
D)Activity D
سؤال
Use the information in the table (all times are in days)to determine the lowest cost minimum completion time if the base cost for each activity finished in normal time is $1,000.  Normal Minimum Crash Cost ActivityTimeTime ($/day)  Predecessor A106$70B63$40C22BD42$60CE64$80AF85$90D,E\begin{array}{|l|l|l|l|l|} \hline&\text { Normal }&\text {Minimum}&\text { Crash Cost }\\ \text {Activity}&\text {Time}&\text {Time}&\text { (\$/day) }& \text { Predecessor }\\\hline \mathrm{A}& 10 & 6 & \$ 70 & -- \\ \hline\mathrm{ B} & 6 & 3 & \$ 40 & -- \\\hline \mathrm{C} & 2 & 2 & - & \mathrm{ B } \\\hline\mathrm{D} & 4 & 2 & \$ 60 &\mathrm{C } \\\hline \mathrm{E} & 6 & 4 & \$ 80 & \mathrm{ A } \\\hline \mathrm{F} & 8 & 5 & \$ 90 & \mathrm{D}, \mathrm{ E }\\\hline \end{array}

A)$7,120
B)$6,910
C)$6,790
D)$6,830
سؤال
Use the information in the table (all times are in days)to determine the lowest total cost for a 20-day project if the base cost for each activity finished in normal time is $1,000.  Normal Minimum Crash Cost ActivityTimeTime ($/day)  Predecessor A106$70B63$40C22BD42$60CE64$80AF85$90D,E\begin{array}{|l|l|l|l|l|} \hline&\text { Normal }&\text {Minimum}&\text { Crash Cost }\\ \text {Activity}&\text {Time}&\text {Time}&\text { (\$/day) }& \text { Predecessor }\\\hline\mathrm{A} & 10 & 6 & \$ 70 & -- \\ \hline \mathrm{B} & 6 & 3 & \$ 40 & -- \\\hline \mathrm{C} & 2 & 2 & - & \mathrm{ B } \\\hline \mathrm{D} & 4 & 2 & \$ 60 & \mathrm{C } \\\hline\mathrm{E} & 6 & 4 & \$ 80 & \mathrm{ A } \\\hline \mathrm{F} & 8 & 5 & \$ 90 & \mathrm{D}, \mathrm{ E }\\\hline \end{array}


A)$6,280
B)$6,390
C)$6,530
D)$6,740
سؤال
A project has the activity duration and cost information indicated in the table where all times are in weeks.For every week longer than 30 weeks,there is a penalty of $300.What is the highest total cost for completing this project?  Activity  Narmal  time  Crash  time  Narmal  Cust  Crash  Cast  Predecessar  A 85$1,0002,000B641,5002,000 A C851,8002,300 A B1291,0001,800 BE14119501,450 BF971,5001,900C,DG752,3002,800E,F\begin{array} { | l | l | l | l | l | l } \hline \text { Activity } & \begin{array} { l } \text { Narmal } \\\text { time }\end{array} & \begin{array} { l } \text { Crash } \\\text { time }\end{array} & \begin{array} { l } \text { Narmal } \\\text { Cust }\end{array} & \begin{array} { l } \text { Crash } \\\text { Cast }\end{array} & \text { Predecessar } \\\hline \text { A } & 8 & 5 & \$1 , 000 & 2,000 & \\\hline B & 6 & 4 & 1,500 & 2,000 & \text { A } \\\hline \mathrm { C } & 8 & 5 & 1,800 & 2,300 & \text { A } \\\hline \mathrm { B } & 12 & 9 & 1,000 & 1,800 & \mathrm {~B} \\\hline \mathrm { E } & 14 & 11 & 950 & 1,450 & \mathrm {~B} \\\hline \mathrm { F } & 9 & 7 & 1,500 & 1,900 & \mathrm { C } , \mathrm { D } \\\hline \mathrm { G } & 7 & 5 & 2,300 & 2,800 & \mathrm { E } , \mathrm { F } \\\hline\end{array}

A)$14,250
B)$13,950
C)$13,550
D)$13,150
سؤال
A project has the activity duration and cost information indicated in the table where all times are in weeks.There is a penalty of $250 per week for every week the project extends beyond 32 weeks.What is the duration of the least expensive project possible?  Activity  Narmal  time  Crash  time  Narmal  Cust  Crash  Cast  Predecessar  A 85$1,0002,000B641,5002,000 A C851,8002,300 A B1291,0001,800 BE14119501,450 BF971,5001,900C,DG752,3002,800E,F\begin{array} { | l | l | l | l | l | l| } \hline \text { Activity } & \begin{array} { l } \text { Narmal } \\\text { time }\end{array} & \begin{array} { l } \text { Crash } \\\text { time }\end{array} & \begin{array} { l } \text { Narmal } \\\text { Cust }\end{array} & \begin{array} { l } \text { Crash } \\\text { Cast }\end{array} & \text { Predecessar } \\\hline \text { A } & 8 & 5 & \$ 1, 000 & 2,000 & \\\hline B & 6 & 4 & 1,500 & 2,000 & \text { A } \\\hline \mathrm { C } & 8 & 5 & 1,800 & 2,300 & \text { A } \\\hline \mathrm { B } & 12 & 9 & 1,000 & 1,800 & \mathrm {~B} \\\hline \mathrm { E } & 14 & 11 & 950 & 1,450 & \mathrm {~B} \\\hline \mathrm { F } & 9 & 7 & 1,500 & 1,900 & \mathrm { C } , \mathrm { D } \\\hline \mathrm { G } & 7 & 5 & 2,300 & 2,800 & \mathrm { E } , \mathrm { F } \\\hline\end{array}

A)38 weeks
B)37 weeks
C)36 weeks
D)35 weeks
سؤال
Crashing costs for a project are governed by the function:
50t² + 100t
where t represents the number of days crashed (see graph).The project manager wants to crash the project,and is willing to pay up to $1,000 per day saved.How many days can be saved before the per-day cost is too high?
Crashing costs for a project are governed by the function: 50t² + 100t where t represents the number of days crashed (see graph).The project manager wants to crash the project,and is willing to pay up to $1,000 per day saved.How many days can be saved before the per-day cost is too high?  <div style=padding-top: 35px>
سؤال
What are the three principal methods for accelerating a project and under what circumstances might these methods yield little gain?
سؤال
It costs $75 per day for each day that a construction crew is on site.The project manager determines that most activities can be crashed and has listed the crashing costs next to the minimum time for each activity.Use this information to determine the lowest cost for this project.All times given are in days.  Normal Minimum Crash Cost ActivityTimeTime ($/day)  Predecessor A106$70B63$40C22 B D42$60 C E64$80 A F85$90D,E\begin{array}{|l|l|l|l|l|} \hline&\text { Normal }&\text {Minimum}&\text { Crash Cost }\\ \text {Activity}&\text {Time}&\text {Time}&\text { (\$/day) }& \text { Predecessor }\\\hline \mathrm{A}& 10 & 6 & \$ 70 & -- \\ \hline\mathrm{ B} & 6 & 3 & \$ 40 & -- \\\hline\mathrm{C} & 2 & 2 & - & \text { B } \\\hline\mathrm{D} & 4 & 2 & \$ 60 & \text { C } \\\hline \mathrm{E} & 6 & 4 & \$ 80 & \text { A } \\\hline \mathrm{F} & 8 & 5 & \$ 90 & \mathrm{D}, \mathrm{ E }\\\hline \end{array}


A)$1,720
B)$1,750
C)$1,780
D)$1,810
سؤال
A project has the activity duration and cost information indicated in the table where all times are in weeks.There is a penalty of $4,000 per week for every week the project exceeds 37 weeks.What is the lowest total cost for completing this project?  Activity  Predecessor  Normal  Time  Normal  Cost  Crash Time  Crash Cost  A 8$12,0005$22,000B A 12$18,0009$32,000 C  A 15$22,0009$62,000DB3$9,0002$18,000E C 9$15,0005$35,000FE7$5,0005$8,000GD8$13,0006$23,000HA12$20,0008$32,000JH6$45,0004$56,000\begin{array}{|l|l|l|l|l|l|}\hline \text { Activity } & \text { Predecessor } & \begin{array}{l}\text { Normal } \\\text { Time }\end{array} & \begin{array}{l}\text { Normal } \\\text { Cost }\end{array} & \text { Crash Time } & \text { Crash Cost } \\\hline \text { A } & -- & 8 & \$ 12,000 & 5 & \$ 22,000 \\\hline \mathrm{B} & \text { A } & 12 & \$ 18,000 & 9 & \$ 32,000 \\\hline \text { C } & \text { A } & 15 & \$ 22,000 & 9 & \$ 62,000 \\\hline \mathrm{D} & \mathrm{B} & 3 & \$ 9,000 & 2& \$ 18,000 \\\hline \mathbf{E} & \text { C } & 9 & \$ 15,000 & 5 & \$ 35,000 \\\hline \mathrm{F} & \mathrm{E} & 7 & \$ 5,000 & 5 & \$ 8,000 \\\hline \mathrm{G} & \mathrm{D} & 8 & \$ 13,000 & 6 & \$ 23,000 \\\hline \mathrm{H} & \mathrm{A} & 12 & \$ 20,000 & 8 & \$ 32,000 \\\hline \mathrm{J} & \mathrm{H} & 6 & \$ 45,000 & 4 & \$ 56,000 \\\hline\end{array}


A)$172,000
B)$184,000
C)$187,000
D)$192,500
سؤال
A project has the activity duration and cost information indicated in the table where all times are in weeks.What is the lowest total cost for completing this project in 35 days?  Activity  Predecessor  Normal  Time  Normal  Cost  Crash Time  Crash Cost  A 8$12,0005$22,000B A 12$18,0009$32,000 C  A 15$22,0009$62,000DB3$9,0002$18,000E C 9$15,0005$35,000FE7$5,0005$8,000GD8$13,0006$23,000HA12$20,0008$32,000JH6$45,0004$56,000\begin{array}{|l|l|l|l|l|l|}\hline \text { Activity } & \text { Predecessor } & \begin{array}{l}\text { Normal } \\\text { Time }\end{array} & \begin{array}{l}\text { Normal } \\\text { Cost }\end{array} & \text { Crash Time } & \text { Crash Cost } \\\hline \text { A } & -- & 8 & \$ 12,000 & 5 & \$ 22,000 \\\hline \mathrm{B} & \text { A } & 12 & \$ 18,000 & 9 & \$ 32,000 \\\hline \text { C } & \text { A } & 15 & \$ 22,000 & 9 & \$ 62,000 \\\hline \mathrm{D} & \mathrm{B} & 3 & \$ 9,000 & 2& \$ 18,000 \\\hline \mathbf{E} & \text { C } & 9 & \$ 15,000 & 5 & \$ 35,000 \\\hline \mathrm{F} & \mathrm{E} & 7 & \$ 5,000 & 5 & \$ 8,000 \\\hline \mathrm{G} & \mathrm{D} & 8 & \$ 13,000 & 6 & \$ 23,000 \\\hline \mathrm{H} & \mathrm{A} & 12 & \$ 20,000 & 8 & \$ 32,000 \\\hline \mathrm{J} & \mathrm{H} & 6 & \$ 45,000 & 4 & \$ 56,000 \\\hline\end{array}

A)$211,500
B)$197,500
C)$203,500
D)$194,500
سؤال
A project has the activity duration and cost information indicated in the table where all times are in weeks.What is the lowest total cost for completing this project in 33 weeks?  Activity  Narmal  time  Crash  time  Narmal  Cust  Crash  Cast  Predecessar  A 85$1,0002,000B641,5002,000 A C851,8002,300 A B1291,0001,800 BE14119501,450 BF971,5001,900C,DG752,3002,800E,F\begin{array} { | l | l | l | l | l | l } \hline \text { Activity } & \begin{array} { l } \text { Narmal } \\\text { time }\end{array} & \begin{array} { l } \text { Crash } \\\text { time }\end{array} & \begin{array} { l } \text { Narmal } \\\text { Cust }\end{array} & \begin{array} { l } \text { Crash } \\\text { Cast }\end{array} & \text { Predecessar } \\\hline \text { A } & 8 & 5 & \$1 , 000 & 2,000 & \\\hline B & 6 & 4 & 1,500 & 2,000 & \text { A } \\\hline \mathrm { C } & 8 & 5 & 1,800 & 2,300 & \text { A } \\\hline \mathrm { B } & 12 & 9 & 1,000 & 1,800 & \mathrm {~B} \\\hline \mathrm { E } & 14 & 11 & 950 & 1,450 & \mathrm {~B} \\\hline \mathrm { F } & 9 & 7 & 1,500 & 1,900 & \mathrm { C } , \mathrm { D } \\\hline \mathrm { G } & 7 & 5 & 2,300 & 2,800 & \mathrm { E } , \mathrm { F } \\\hline\end{array}

A)$11,250
B)$11,500
C)$12,250
D)$12,500
سؤال
What is project crashing and what are three reasons why it might be important to do so?
سؤال
Quite often the marginal gains in employee productivity decrease dramatically with the increased use of overtime.
سؤال
A project has the activity duration and cost information indicated in the table where all times are in weeks.There is a penalty of $6,000 per week for every week the project extends beyond 25 weeks.What is the lowest total cost duration for completing this project?  Activity  Predecessor  Normal  Time  Normal  Cost  Crash Time  Crash Cost  A 8$12,0005$22,000B A 12$18,0009$32,000 C  A 15$22,0009$62,000DB3$9,0002$18,000E C 9$15,0005$35,000FE7$5,0005$8,000GD8$13,0006$23,000HA12$20,0008$32,000JH6$45,0004$56,000\begin{array}{|l|l|l|l|l|l|}\hline \text { Activity } & \text { Predecessor } & \begin{array}{l}\text { Normal } \\\text { Time }\end{array} & \begin{array}{l}\text { Normal } \\\text { Cost }\end{array} & \text { Crash Time } & \text { Crash Cost } \\\hline \text { A } &--& 8 & \$ 12,000 & 5 & \$ 22,000 \\\hline \mathrm{B} & \text { A } & 12 & \$ 18,000 & 9 & \$ 32,000 \\\hline \text { C } & \text { A } & 15 & \$ 22,000 & 9 & \$ 62,000 \\\hline \mathrm{D} & \mathrm{B} & 3 & \$ 9,000 & 2& \$ 18,000 \\\hline \mathbf{E} & \text { C } & 9 & \$ 15,000 & 5 & \$ 35,000 \\\hline \mathrm{F} & \mathrm{E} & 7 & \$ 5,000 & 5 & \$ 8,000 \\\hline \mathrm{G} & \mathrm{D} & 8 & \$ 13,000 & 6 & \$ 23,000 \\\hline \mathrm{H} & \mathrm{A} & 12 & \$ 20,000 & 8 & \$ 32,000 \\\hline \mathrm{J} & \mathrm{H} & 6 & \$ 45,000 & 4 & \$ 56,000 \\\hline\end{array}


A)34 weeks
B)36 weeks
C)40 weeks
D)43 weeks
سؤال
Use the information in the table (all times are in days)to determine the lowest extra cost for an 18-day project if the base cost for each activity finished in normal time is $1,000.  Normal Minimum Crash Cost ActivityTimeTime ($/day)  Predecessor A106$70B63$40C22BD42$60CE64$80AF85$90D,E\begin{array}{|l|l|l|l|l|} \hline&\text { Normal }&\text {Minimum}&\text { Crash Cost }\\ \text {Activity}&\text {Time}&\text {Time}&\text { (\$/day) }& \text { Predecessor }\\\hline \mathrm{A}& 10 & 6 & \$ 70 & -- \\ \hline \mathrm{B} & 6 & 3 & \$ 40 & -- \\\hline\mathrm{C} & 2 & 2 & - &\mathrm{B } \\\hline\mathrm{D} & 4 & 2 & \$ 60 &\mathrm{ C } \\\hline \mathrm{E} & 6 & 4 & \$ 80 &\mathrm{ A } \\\hline\mathrm{F} & 8 & 5 & \$ 90 & \mathrm{D},\mathrm{ E }\\\hline \end{array}


A)$400
B)$420
C)$440
D)$460
سؤال
What is the cost to finish this project (all activity durations are in weeks and costs in US dollars)as quickly as possible?
 Normal  Minimum  Normal  Activity  Predecessor  Time  Time  Cost  Crash Cost A121010001500 B  A 5312001950 C  A 9715002100 D  B, C 141018002100 E  B 4314001875 F  D 9810001450 G  E 757001200 H  F, G 11820003000 I  H 8611001700\begin{array}{|l|l|l|l|l|l|} \hline &&\text { Normal }&\text { Minimum }&\text { Normal }\\ \text { Activity } & \text { Predecessor } & \text { Time } &\text { Time } & \text { Cost }&\text { Crash Cost }\\ \hline \mathbf{A} & & 12 & 10 & 1000 & 1500 \\\hline \text { B } & \text { A } & 5 & 3 & 1200 & 1950 \\\hline \text { C } & \text { A } & 9 & 7 & 1500 & 2100 \\\hline \text { D } & \text { B, C } & 14 & 10 & 1800 & 2100 \\\hline \text { E } & \text { B } & 4 & 3 & 1400 & 1875 \\\hline \text { F } & \text { D } & 9 & 8 & 1000 & 1450 \\\hline \text { G } & \text { E } & 7 & 5 & 700 & 1200 \\\hline \text { H } & \text { F, G } & 11 & 8 & 2000 & 3000 \\\hline \text { I } & \text { H } & 8 & 6 & 1100 & 1700 \\\hline \end{array}

سؤال
What is the duration of the project shown in the network?

A)36
B)37
C)38
D)39
سؤال
Consider the project described by the table where all durations are in days and the costs in dollars.What is the minimum cost of completing this project in 150 days?
 Normal  Minimum Normal  Activity Predecessor Time  Time  Cost  Crash Cost A15128001,100BA30222,5004,100CA453721,00033,000DC201715,00022,000ED543,0003,300FB10713,00015,500GF302541,00046,000HJ,E504530,00037,500JF252020,00025,000KG35336,5007,200LK403316,50019,400ML151314,40018,600NK302623,50027,500PH201515,25023,500QN,P555,0005,000\begin{array}{|l|l|l|l|l|l|}\hline&&\text { Normal } & \text { Minimum } & \text {Normal }\\ \text { Activity} & \text { Predecessor } & \text {Time } & \text { Time } & \text { Cost } & \text { Crash Cost }\\ \hline\mathrm{A} & 15 & 12 & 800 & 1,100 & \\\hline\mathrm{B} & \mathrm{A} & 30 & 22 & 2,500 & 4,100 \\\hline \mathrm{C} & \mathrm{A} & 45 & 37 & 21,000 & 33,000 \\\hline \mathrm{D} & \mathrm{C} & 20 & 17 & 15,000 & 22,000 \\\hline\mathrm{E} & \mathrm{D} & 5 & 4 & 3,000 & 3,300 \\\hline\mathrm{F} & \mathrm{B} & 10 & 7 & 13,000 & 15,500 \\\hline \mathrm{G} & \mathrm{F} & 30 & 25 & 41,000 & 46,000 \\\hline \mathrm{H} & \mathrm{J}, \mathrm{E} & 50 & 45 & 30,000 & 37,500 \\\hline \mathrm{J} & \mathrm{F} & 25 & 20 & 20,000 & 25,000 \\\hline\mathrm{K} & \mathrm{G} & 35 & 33 & 6,500 & 7,200 \\\hline\mathrm{L} & \mathrm{K} & 40 & 33 & 16,500 & 19,400 \\\hline\mathrm{M} &\mathrm{L} & 15 & 13 & 14,400 & 18,600 \\\hline \mathrm{N} & \mathrm{K} & 30 & 26 & 23,500 & 27,500 \\\hline\mathrm{P} & \mathrm{H} & 20 & 15 & 15,250 & 23,500 \\\hline\mathrm{Q} & \mathrm{N}, \mathrm{P} & 5 & 5 & 5,000 & 5,000\\\hline \end{array}

سؤال
The heir to the throne was due 60 days from now and the first-time father had a serious construction project on his hands converting his man cave into a nursery.The seven activities,their normal and expedited times (in days)and costs appear in the table.Just to be on the safe side,he decided to bring the project in at 53 days in case the delivery was a week early.Tell him what the least expensive 53-day project is;which activities should be reduced in duration,by how many days,and at the total cost,so he can roll up the sleeves on his "World's Greatest Dad" sweatshirt,and get to work.
 Normal  Crash  Normal  Crash  Activity  time  time  Cost  Cast  Predecesar A55001100B18159002300AC12925003000AD97500650BE151230005000BF121040005000C,DG201536004800E,F\begin{array} { | l | l | l | l | l | l |} \hline & \text { Normal } & \text { Crash } & \text { Normal } & \text { Crash } & \\\text { Activity } & \text { time } & \text { time } & \text { Cost } & \text { Cast } & \text { Predecesar } \\\hline\mathrm { A }& 5 & 500 & 1100 & \\\hline \mathrm { B } & 18 & 15 & 900 & 2300 &\mathrm { A } \\\hline \mathrm { C } & 12 & 9 & 2500 & 3000 & \mathrm { A } \\\hline \mathrm { D } & 9 & 7 & 500 & 650 &\mathrm { B } \\\hline \mathrm { E } & 15 & 12 & 3000 & 5000 &\mathrm { B } \\\hline \mathrm { F } & 12 & 10 & 4000 & 5000 & \mathrm { C } , \mathrm { D } \\\hline \mathrm {G}&20&15&3600&4800& \mathrm {E,F}\\\hline\end{array}
سؤال
An AOA network:

A)Cannot show a merge activity.
B)Cannot show a burst activity.
C)Cannot have consecutive merge and burst activities.
D)Can have all of the features described in A-C above.
سؤال
AOA is a more useful technique than AON if the project is complex and has many significant milestones.
سؤال
<strong>  Which of the activities in the diagram have slack?</strong> A)C and D B)B and D C)C and E D)B and E <div style=padding-top: 35px>
Which of the activities in the diagram have slack?

A)C and D
B)B and D
C)C and E
D)B and E
سؤال
The fastest completion time for this project is: <strong>The fastest completion time for this project is:  </strong> A)14. B)15. C)16. D)17. <div style=padding-top: 35px>

A)14.
B)15.
C)16.
D)17.
سؤال
The heir to the throne was due 56 days from now and the first-time father had a serious construction project on his hands converting his man cave into a nursery.The seven activities,their normal and expedited times (in days)and costs appear in the table.What is the minimum cost to ensure that this project is completed in 56 days? Which activities should be reduced and by how many days?
 Normal  Crash  Normal  Crash  Activity  time  time  Cost  Cast  Predecesar A55001100B18159002300AC12925003000AD97500650BE151230005000BF121040005000C,DG201536004800E,F\begin{array} { | l | l | l | l | l | l |} \hline & \text { Normal } & \text { Crash } & \text { Normal } & \text { Crash } & \\\text { Activity } & \text { time } & \text { time } & \text { Cost } & \text { Cast } & \text { Predecesar } \\\hline\mathrm { A }& 5 & 500 & 1100 & \\\hline \mathrm { B } & 18 & 15 & 900 & 2300 &\mathrm { A } \\\hline \mathrm { C } & 12 & 9 & 2500 & 3000 & \mathrm { A } \\\hline \mathrm { D } & 9 & 7 & 500 & 650 &\mathrm { B } \\\hline \mathrm { E } & 15 & 12 & 3000 & 5000 &\mathrm { B } \\\hline \mathrm { F } & 12 & 10 & 4000 & 5000 & \mathrm { C } , \mathrm { D } \\\hline \mathrm {G}&20&15&3600&4800& \mathrm {E,F}\\\hline\end{array}
سؤال
The AOA network described by this table needs:  Activity  Predecessor ABE A BA,BECFC,D\begin{array} { | l | l | } \hline \text { Activity } & \text { Predecessor } \\\hline\mathrm { A } & - - \\\hline \mathrm {B} & - - \\\hline \mathrm { E } & \text { A } \\\hline \mathrm { B } & \mathrm { A } , \mathrm { B } \\\hline \mathrm { E } & \mathrm { C } \\\hline \mathrm { F } & \mathrm { C } , \mathrm { D } \\\hline \end{array}

A)Zero dummy activities.
B)One dummy activity.
C)Two dummy activities.
D)Three dummy activities.
سؤال
Most project management software employs AOA diagramming.
سؤال
Dummy activities:

A)Do not have any duration value attached to them.
B)Have durations equal to the length of the predecessors.
C)Have durations equal to the length of the successors.
D)Have durations equal to the lag needed to preserve network logic.
سؤال
The critical path of this network is: <strong>The critical path of this network is:  </strong> A)14. B)15. C)12. D)13. <div style=padding-top: 35px>

A)14.
B)15.
C)12.
D)13.
سؤال
<strong>  What is the late finish for activity D in the network shown in the diagram?</strong> A)15 B)16 C)17 D)18 <div style=padding-top: 35px>
What is the late finish for activity D in the network shown in the diagram?

A)15
B)16
C)17
D)18
سؤال
What is the minimum completion cost of this project if there is a penalty of $1,000 for each day the project lasts longer than 27 days? Activity durations in days and crash costs in dollars are given in the table.
 Reg  Crash  Reg  Crash  Reg  Crash  Reg  Crash  Activity Length Length Cost  Cost  Activity  Length  Length Cost Cost A764001,200L758001,500C11450450N655001,250D965502,350R44600600E975001,650S1084501,350J216001,800Y866751,750\begin{array}{|l|l|l|l|l|l|l|l|l|l|}\hline&\text { Reg } & \text { Crash }& \text { Reg } &\text { Crash }&&\text { Reg } & \text { Crash }& \text { Reg } &\text { Crash } \\ \text { Activity }&\text {Length }&\text {Length }&\text {Cost }& \text { Cost }&\text { Activity }&\text { Length }&\text { Length }&\text {Cost }&\text {Cost }\\\hline \mathrm{A} & 7 & 6 & 400 & 1,200 & \mathrm{L} & 7 & 5 & 800 & 1,500 \\\hline \mathrm{C} & 1 & 1 & 450 & 450 & \mathrm{N} & 6 & 5 & 500 & 1,250 \\\hline \mathrm{D} & 9 & 6 & 550 & 2,350 &\mathrm{R} & 4 & 4 & 600 & 600 \\\hline \mathrm{E} & 9 & 7 & 500 & 1,650 & \mathrm{S} & 10 & 8 & 450 & 1,350 \\\hline \mathrm{J} & 2 & 1 & 600 & 1,800 & \mathrm{Y} & 8 & 6 & 675 & 1,750\\\hline \end{array}
 What is the minimum completion cost of this project if there is a penalty of $1,000 for each day the project lasts longer than 27 days? Activity durations in days and crash costs in dollars are given in the table.  \begin{array}{|l|l|l|l|l|l|l|l|l|l|} \hline&\text { Reg } & \text { Crash }& \text { Reg } &\text { Crash }&&\text { Reg } & \text { Crash }& \text { Reg } &\text { Crash } \\ \text { Activity }&\text {Length  }&\text {Length  }&\text {Cost }& \text { Cost }&\text { Activity }&\text { Length }&\text { Length }&\text {Cost  }&\text {Cost }\\ \hline \mathrm{A} & 7 & 6 & 400 & 1,200 & \mathrm{L} & 7 & 5 & 800 & 1,500 \\ \hline \mathrm{C} & 1 & 1 & 450 & 450 & \mathrm{N} & 6 & 5 & 500 & 1,250 \\ \hline \mathrm{D} & 9 & 6 & 550 & 2,350 &\mathrm{R} & 4 & 4 & 600 & 600 \\ \hline \mathrm{E} & 9 & 7 & 500 & 1,650 & \mathrm{S} & 10 & 8 & 450 & 1,350 \\ \hline \mathrm{J} & 2 & 1 & 600 & 1,800 & \mathrm{Y} & 8 & 6 & 675 & 1,750\\ \hline \end{array}   <div style=padding-top: 35px>
سؤال
AON networks have an advantage over AOA networks:

A)If the project under study is complex.
B)Because they don't need dummy activities.
C)In the construction industry because they are the norm.
D)When it is critical to highlight milestones.
سؤال
What is the minimum cost completion time for this project if the activities have normal and crash costs as indicated and there is a $1,000 fixed cost for each day on site plus a $500 penalty for each activity that is crashed? The crash costs represent the cost of a fully expedited activity.For example,reducing activity Y from 13 days to 12 days costs an extra $100 on top of the $500 expediting cost for a total cost of $2,600.Reducing Y from 13 days to 10 days costs an extra $300 on top of the $500 expediting cost,for a total activity cost of $2,800.
 Normal Normal Crash Activity Predecessor Time  Cost  Time  Crash Cost Z2$2,0002$2,000Y13$2,00010$2,300X19$2,00015$3,000WZ18$2,00015$3,000VX10$2,0009$3,000UY13$2,00011$3,000TW18$2,00014$4,000SV4$2,0003$3,000RU6$2,0005$3,000QR,S15$2,00013$3,000PT13$2,00012$3,000NP,Q4$2,0004$2,000\begin{array}{|l|l|l|l|l|l|}\hline&&\text { Normal } & \text {Normal }& \text {Crash}\\ \text { Activity} & \text { Predecessor } & \text {Time } & \text { Cost } & \text { Time } & \text { Crash Cost }\\ \hline\mathrm{ Z} & & 2 & \$ 2,000 & 2 & \$ 2,000 \\\hline \mathrm{Y} & & 13 & \$ 2,000 & 10 & \$ 2,300 \\\hline \mathrm{X} & & 19 & \$ 2,000 & 15 & \$ 3,000 \\\hline \mathrm{W} & \mathrm{Z} & 18 & \$ 2,000 & 15 & \$ 3,000 \\\hline \mathrm{V} & \mathrm{X} & 10 & \$ 2,000 & 9 & \$ 3,000 \\\hline \mathrm{U} & \mathrm{Y} & 13 & \$ 2,000 & 11 & \$ 3,000 \\\hline \mathrm{T} & \mathrm{W} & 18 & \$ 2,000 & 14 & \$ 4,000 \\\hline \mathrm{S} & \mathrm{V} & 4 & \$ 2,000 & 3 & \$ 3,000 \\\hline \mathrm{R} & \mathrm{U} & 6 & \$ 2,000 & 5 & \$ 3,000 \\\hline\mathrm{Q} & \mathrm{R}, \mathrm{S} & 15 & \$ 2,000 & 13 & \$ 3,000 \\\hline \mathrm{P} & T & 13 & \$ 2,000 & 12 & \$ 3,000 \\\hline \mathrm{N} & \mathrm{P}, \mathrm{Q} & 4 & \$ 2,000 & 4 & \$ 2,000\\\hline \end{array}
سؤال
The AOA network described by this table needs:  Activity  Predecessor ABC A, B DBEC,D\begin{array} { | l | l | } \hline \text { Activity } & \text { Predecessor } \\\hline\mathrm {A } & - - \\\hline\mathrm { B} & - - \\\hline \mathrm { C } & \text { A, B } \\\hline \mathrm { D } & \mathrm { B } \\\hline \mathrm { E } & \mathrm { C } , \mathrm { D } \\ \hline\end{array}

A)Zero dummy activities.
B)One dummy activity.
C)Two dummy activities.
D)Three dummy activities.
سؤال
What information is NOT included in the nodes for an AOA network?

A)Label
B)Early start time
C)Late finish time
D)Early finish time
سؤال
AOA networks have an advantage over AON networks:

A)If the project is complex.
B)Because they are easier to read for novices.
C)When it comes to software packages for project management.
D)When the task of network labeling is considered.
سؤال
An activity on an arrow network:

A)Cannot have more arrows than nodes.
B)Cannot have more nodes than arrows.
C)Has one more node than arrows.
D)Has one more arrow than nodes.
فتح الحزمة
قم بالتسجيل لفتح البطاقات في هذه المجموعة!
Unlock Deck
Unlock Deck
1/96
auto play flashcards
العب
simple tutorial
ملء الشاشة (f)
exit full mode
Deck 10: Project Scheduling: Lagging, Crashing, and Activity Networks
1
Consider the Gantt chart shown below where the time scale is in minutes and all activities are performed on an early start basis.How much slack is available in The Great Hair Washing project? <strong>Consider the Gantt chart shown below where the time scale is in minutes and all activities are performed on an early start basis.How much slack is available in The Great Hair Washing project?  </strong> A)10 minutes B)15 minutes C)0 minutes D)5 minutes

A)10 minutes
B)15 minutes
C)0 minutes
D)5 minutes
C
2
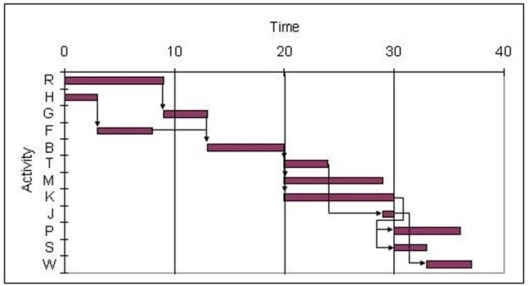
 <strong>   -Use the Gantt chart and activity list to determine which resource has the greatest continual use.  \begin{array} { | l | l | l | l | } \hline \text { Activity } & \text { Resources } & \text { Activity } & \text { Resources } \\ \hline  \mathrm {R }&5&  \mathrm { M } & 1 \\ \hline \mathrm { H } & 1 &  \mathrm { K } & 5 \\ \hline \mathrm {G } & 5& \mathrm {~J} & 3 \\ \hline \mathrm { F } & 2 & \mathrm { P } & 1 \\ \hline \mathrm { B } & 2 & \mathrm {S } & 2 \\ \hline \mathrm { T } & 4 & \mathrm {~W} & 3 \\ \hline \end{array}   </strong> A)Resource 4 B)Resource 2 C)Resource 3 D)Resource 5

-Use the Gantt chart and activity list to determine which resource has the greatest continual use.  Activity  Resources  Activity  Resources R5M1H1K5G5 J3F2P1B2S2T4 W3\begin{array} { | l | l | l | l | } \hline \text { Activity } & \text { Resources } & \text { Activity } & \text { Resources } \\\hline \mathrm {R }&5& \mathrm { M } & 1 \\\hline \mathrm { H } & 1 & \mathrm { K } & 5 \\\hline \mathrm {G } & 5& \mathrm {~J} & 3 \\\hline \mathrm { F } & 2 & \mathrm { P } & 1 \\\hline \mathrm { B } & 2 & \mathrm {S } & 2 \\\hline \mathrm { T } & 4 & \mathrm {~W} & 3 \\\hline \end{array}


A)Resource 4
B)Resource 2
C)Resource 3
D)Resource 5
Resource 5
3
The least common type of lag relationship occurs when a successor's finish is dependent upon a predecessor's start.
True
4
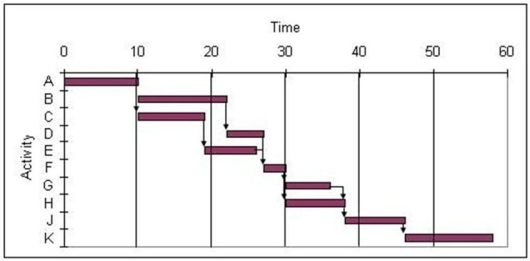
 <strong>   -Use the Gantt chart and the activity list to determine which resource is free for use in another project before the others.  \begin{array} { | l | l | l | l | } \hline \text { Activity } & \text { Resources } & \text { Activity } & \text { Resources } \\ \hline\mathrm {  A } & 1 & F & 2 \\ \hline\mathrm {  B }& 3 &\mathrm {  G } & 3 \\ \hline \mathrm {  C } & 4 & \mathrm { H } & 4 \\ \hline \mathrm { D } & 2 & \mathrm {~J} & 5 \\ \hline \mathrm { E } & 2 & \mathrm { K} & 1 \\ \hline \end{array}  </strong> A)Resource 4 B)Resource 3 C)Resource 1 D)Resource 2

-Use the Gantt chart and the activity list to determine which resource is free for use in another project before the others.  Activity  Resources  Activity  Resources A1F2B3G3C4H4D2 J5E2K1\begin{array} { | l | l | l | l | } \hline \text { Activity } & \text { Resources } & \text { Activity } & \text { Resources } \\\hline\mathrm { A } & 1 & F & 2 \\\hline\mathrm { B }& 3 &\mathrm { G } & 3 \\\hline \mathrm { C } & 4 & \mathrm { H } & 4 \\\hline \mathrm { D } & 2 & \mathrm {~J} & 5 \\\hline \mathrm { E } & 2 & \mathrm { K} & 1 \\\hline\end{array}

A)Resource 4
B)Resource 3
C)Resource 1
D)Resource 2
فتح الحزمة
افتح القفل للوصول البطاقات البالغ عددها 96 في هذه المجموعة.
فتح الحزمة
k this deck
5
 <strong>   -Use the Gantt chart and the activity list to determine which resource is used the least.  \begin{array} { | l | l | l | l | } \hline \text { Activity } & \text { Resources } & \text { Activity } & \text { Resources } \\ \hline \mathrm {  A } & 1 & \mathrm { F} & 2 \\ \hline \mathrm { B }& 1 & \mathrm {  G } & 3 \\ \hline \mathrm { C } & 4 & \mathrm { H } & 4 \\ \hline \mathrm { D } & 2 & \mathrm {~J} & 3 \\ \hline \mathrm { E } & 2 & K & 5 \\ \hline \end{array} </strong> A)Resource 1 B)Resource 3 C)Resource 4 D)Resource 2

-Use the Gantt chart and the activity list to determine which resource is used the least.  Activity  Resources  Activity  Resources A1F2B1G3C4H4D2 J3E2K5\begin{array} { | l | l | l | l | } \hline \text { Activity } & \text { Resources } & \text { Activity } & \text { Resources } \\\hline \mathrm { A } & 1 & \mathrm { F} & 2 \\\hline \mathrm { B }& 1 & \mathrm { G } & 3 \\\hline \mathrm { C } & 4 & \mathrm { H } & 4 \\\hline \mathrm { D } & 2 & \mathrm {~J} & 3 \\\hline \mathrm { E } & 2 & K & 5 \\\hline\end{array}

A)Resource 1
B)Resource 3
C)Resource 4
D)Resource 2
فتح الحزمة
افتح القفل للوصول البطاقات البالغ عددها 96 في هذه المجموعة.
فتح الحزمة
k this deck
6
Sketch a network and use it as an example as you discuss the four different logical relationships between activities.
فتح الحزمة
افتح القفل للوصول البطاقات البالغ عددها 96 في هذه المجموعة.
فتح الحزمة
k this deck
7
A finish to start lag delay is usually shown:

A)As an added value in the predecessor's activity time.
B)On the line adjoining the two activity nodes.
C)As an added value in the predecessors early start time.
D)As a subtracted value in the follower's early finish time.
فتح الحزمة
افتح القفل للوصول البطاقات البالغ عددها 96 في هذه المجموعة.
فتح الحزمة
k this deck
8
Activities A and B have a finish to finish relationship and early start and finish times as shown.What is the result of incorporating a 4-day lag between activities C and B? <strong>Activities A and B have a finish to finish relationship and early start and finish times as shown.What is the result of incorporating a 4-day lag between activities C and B?  </strong> A)The early finish for A increases to 31. B)The early start time for A increases to 24. C)The early finish time for B increases to 31. D)The early start time for D falls to 23.
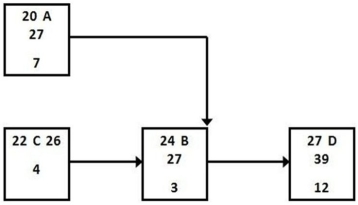
A)The early finish for A increases to 31.
B)The early start time for A increases to 24.
C)The early finish time for B increases to 31.
D)The early start time for D falls to 23.
فتح الحزمة
افتح القفل للوصول البطاقات البالغ عددها 96 في هذه المجموعة.
فتح الحزمة
k this deck
9
 <strong>   -Use the Gantt chart and activity list to determine which resource is used the least.  \begin{array} { | l | l | l | l | } \hline \text { Activity } & \text { Resources } & \text { Activity } & \text { Resources } \\ \hline  \mathrm {R }&5&  \mathrm { M } & 1 \\ \hline \mathrm { H } & 1 &  \mathrm { K } & 4 \\ \hline \mathrm {G } & 5& \mathrm {~J} & 3 \\ \hline \mathrm { F } & 2 & \mathrm { P } & 1 \\ \hline \mathrm { B } & 2 & \mathrm {S } & 2 \\ \hline \mathrm { T } & 4 & \mathrm {~W} & 3 \\ \hline \end{array}  </strong> A)Resource 1 B)Resource 2 C)Resource 4 D)Resource 5

-Use the Gantt chart and activity list to determine which resource is used the least.  Activity  Resources  Activity  Resources R5M1H1K4G5 J3F2P1B2S2T4 W3\begin{array} { | l | l | l | l | } \hline \text { Activity } & \text { Resources } & \text { Activity } & \text { Resources } \\\hline \mathrm {R }&5& \mathrm { M } & 1 \\\hline \mathrm { H } & 1 & \mathrm { K } & 4 \\\hline \mathrm {G } & 5& \mathrm {~J} & 3 \\\hline \mathrm { F } & 2 & \mathrm { P } & 1 \\\hline \mathrm { B } & 2 & \mathrm {S } & 2 \\\hline \mathrm { T } & 4 & \mathrm {~W} & 3 \\\hline \end{array}

A)Resource 1
B)Resource 2
C)Resource 4
D)Resource 5
فتح الحزمة
افتح القفل للوصول البطاقات البالغ عددها 96 في هذه المجموعة.
فتح الحزمة
k this deck
10
What is the early start time for activity C if it has the start to start relationship shown? <strong>What is the early start time for activity C if it has the start to start relationship shown?  </strong> A)Day 20 B)Day 25 C)Day 27 D)Day 29
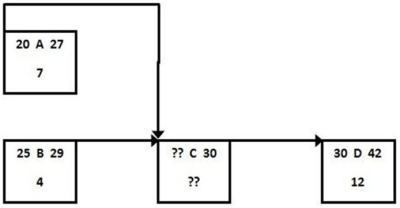
A)Day 20
B)Day 25
C)Day 27
D)Day 29
فتح الحزمة
افتح القفل للوصول البطاقات البالغ عددها 96 في هذه المجموعة.
فتح الحزمة
k this deck
11
 <strong>   -Use the Gantt chart and the activity list to determine which resource is used the most.  \begin{array} { | l | l | l | l | } \hline \text { Activity } & \text { Resources } & \text { Activity } & \text { Resources } \\ \hline\mathrm {  A } & 1 & F & 2 \\ \hline\mathrm {  B }& 3 &\mathrm {  G } & 3 \\ \hline \mathbf { C } & 4 & \mathrm { H } & 4 \\ \hline \mathrm { D } & 2 & \mathrm {~J} & 5 \\ \hline \mathrm { E } & 2 & \mathrm { K} & 1 \\ \hline \end{array} </strong> A)Resource 4 B)Resource 3 C)Resource 1 D)Resource 2

-Use the Gantt chart and the activity list to determine which resource is used the most.  Activity  Resources  Activity  Resources A1F2B3G3C4H4D2 J5E2K1\begin{array} { | l | l | l | l | } \hline \text { Activity } & \text { Resources } & \text { Activity } & \text { Resources } \\\hline\mathrm { A } & 1 & F & 2 \\\hline\mathrm { B }& 3 &\mathrm { G } & 3 \\\hline \mathbf { C } & 4 & \mathrm { H } & 4 \\\hline \mathrm { D } & 2 & \mathrm {~J} & 5 \\\hline \mathrm { E } & 2 & \mathrm { K} & 1 \\\hline\end{array}

A)Resource 4
B)Resource 3
C)Resource 1
D)Resource 2
فتح الحزمة
افتح القفل للوصول البطاقات البالغ عددها 96 في هذه المجموعة.
فتح الحزمة
k this deck
12
Finish to start lags are the same as additional activity slack.
فتح الحزمة
افتح القفل للوصول البطاقات البالغ عددها 96 في هذه المجموعة.
فتح الحزمة
k this deck
13
 <strong>   -Use the Gantt chart and the activity list to determine which resource is needed earliest in this project.  \begin{array} { | l | l | l | l | } \hline \text { Activity } & \text { Resources } & \text { Activity } & \text { Resources } \\ \hline\mathrm {  A } & 1 & F & 2 \\ \hline\mathrm {  B }& 3 &\mathrm {  G } & 3 \\ \hline \mathrm {  C } & 4 & \mathrm { H } & 4 \\ \hline \mathrm { D } & 2 & \mathrm {~J} & 5 \\ \hline \mathrm { E } & 2 & \mathrm { K} & 1 \\ \hline \end{array}   </strong> A)Resource 2 B)Resource 3 C)Resource 1 D)Resource 4

-Use the Gantt chart and the activity list to determine which resource is needed earliest in this project.  Activity  Resources  Activity  Resources A1F2B3G3C4H4D2 J5E2K1\begin{array} { | l | l | l | l | } \hline \text { Activity } & \text { Resources } & \text { Activity } & \text { Resources } \\\hline\mathrm { A } & 1 & F & 2 \\\hline\mathrm { B }& 3 &\mathrm { G } & 3 \\\hline \mathrm { C } & 4 & \mathrm { H } & 4 \\\hline \mathrm { D } & 2 & \mathrm {~J} & 5 \\\hline \mathrm { E } & 2 & \mathrm { K} & 1 \\\hline\end{array}


A)Resource 2
B)Resource 3
C)Resource 1
D)Resource 4
فتح الحزمة
افتح القفل للوصول البطاقات البالغ عددها 96 في هذه المجموعة.
فتح الحزمة
k this deck
14
Which statement about this Gantt chart is BEST? <strong>Which statement about this Gantt chart is BEST?  </strong> A)Activity a has a duration that could be as short as 1 day and as long as 10. B)Activity b probably has activity a as a predecessor. C)No progress has been made on activity c. D)Activity d is the longest activity.
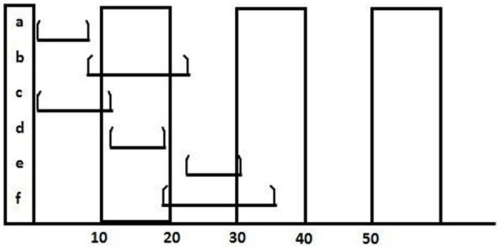
A)Activity a has a duration that could be as short as 1 day and as long as 10.
B)Activity b probably has activity a as a predecessor.
C)No progress has been made on activity c.
D)Activity d is the longest activity.
فتح الحزمة
افتح القفل للوصول البطاقات البالغ عددها 96 في هذه المجموعة.
فتح الحزمة
k this deck
15
 <strong>   -Use the Gantt chart and the activity list to determine when resource 5 is free.  \begin{array} { | l | l | l | l | } \hline \text { Activity } & \text { Resources } & \text { Activity } & \text { Resources } \\ \hline \mathrm { A } & 1 & F & 1 \\ \hline \mathrm { B} & 5 & \mathrm {  G } & 2 \\ \hline \mathrm {  C } & 4 & \mathrm { H } & 5 \\ \hline \mathrm { D } & 3 & \mathrm {~J} & 3 \\ \hline \mathrm { E } & 2 & \mathrm {~K} & 4 \\ \hline \end{array} </strong> A)Between 0 and 15 B)Between 15 and 30 C)Between 30 and 45 D)Between 45 and 60

-Use the Gantt chart and the activity list to determine when resource 5 is free.  Activity  Resources  Activity  Resources A1F1B5G2C4H5D3 J3E2 K4\begin{array} { | l | l | l | l | } \hline \text { Activity } & \text { Resources } & \text { Activity } & \text { Resources } \\\hline \mathrm { A } & 1 & F & 1 \\\hline \mathrm { B} & 5 & \mathrm { G } & 2 \\\hline \mathrm { C } & 4 & \mathrm { H } & 5 \\\hline \mathrm { D } & 3 & \mathrm {~J} & 3 \\\hline \mathrm { E } & 2 & \mathrm {~K} & 4 \\\hline\end{array}

A)Between 0 and 15
B)Between 15 and 30
C)Between 30 and 45
D)Between 45 and 60
فتح الحزمة
افتح القفل للوصول البطاقات البالغ عددها 96 في هذه المجموعة.
فتح الحزمة
k this deck
16
 <strong>   -Use the Gantt chart and the activity list to determine when resource 2 is free.  \begin{array} { | l | l | l | l | } \hline \text { Activity } & \text { Resources } & \text { Activity } & \text { Resources } \\ \hline \text { A } & 1 &\mathrm {  F} & 1 \\ \hline \mathrm { B} & 5 & \mathrm { G} & 2 \\ \hline\mathrm {  C } & 4 & \mathrm { H } & 5 \\ \hline \mathrm { D } & 3 & \mathrm {~J} & 3 \\ \hline \mathrm { E } & 2 & \mathrm {~K} & 2 \\ \hline \end{array} </strong> A)Between 0 and 15 B)Between 15 and 30 C)Between 30 and 45 D)Between 45 and 60

-Use the Gantt chart and the activity list to determine when resource 2 is free.  Activity  Resources  Activity  Resources  A 1F1B5G2C4H5D3 J3E2 K2\begin{array} { | l | l | l | l | } \hline \text { Activity } & \text { Resources } & \text { Activity } & \text { Resources } \\\hline \text { A } & 1 &\mathrm { F} & 1 \\\hline \mathrm { B} & 5 & \mathrm { G} & 2 \\\hline\mathrm { C } & 4 & \mathrm { H } & 5 \\\hline \mathrm { D } & 3 & \mathrm {~J} & 3 \\\hline \mathrm { E } & 2 & \mathrm {~K} & 2 \\\hline\end{array}

A)Between 0 and 15
B)Between 15 and 30
C)Between 30 and 45
D)Between 45 and 60
فتح الحزمة
افتح القفل للوصول البطاقات البالغ عددها 96 في هذه المجموعة.
فتح الحزمة
k this deck
17
Activity X has the start to finish relationship shown with activity Y and both have early start and finish times as shown.Which statement is BEST? <strong>Activity X has the start to finish relationship shown with activity Y and both have early start and finish times as shown.Which statement is BEST?  </strong> A)a < d B)a < c C)b < c D)d < a
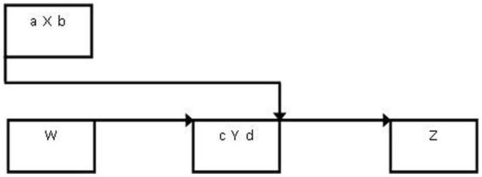
A)a < d
B)a < c
C)b < c
D)d < a
فتح الحزمة
افتح القفل للوصول البطاقات البالغ عددها 96 في هذه المجموعة.
فتح الحزمة
k this deck
18
 <strong>   -Use the Gantt chart and activity list to determine which resource has the greatest continual use.  \begin{array} { | l | l | l | l | } \hline \text { Activity } & \text { Resources } & \text { Activity } & \text { Resources } \\ \hline  \mathrm {R }& 3 &  \mathrm { M } & 1 \\ \hline \mathrm { H } & 1 &  \mathrm { K } & 5 \\ \hline \mathrm {G } & 4 & \mathrm {~J} & 3 \\ \hline \mathrm { F } & 2 & \mathrm { P } & 1 \\ \hline \mathrm { B } & 2 & \mathrm {S } & 2 \\ \hline \mathrm { T } & 4 & \mathrm {~W} & 3 \\ \hline \end{array}   </strong> A)Resource 3 B)Resource 1 C)Resource 2 D)Resource 4

-Use the Gantt chart and activity list to determine which resource has the greatest continual use.  Activity  Resources  Activity  Resources R3M1H1K5G4 J3F2P1B2S2T4 W3\begin{array} { | l | l | l | l | } \hline \text { Activity } & \text { Resources } & \text { Activity } & \text { Resources } \\\hline \mathrm {R }& 3 & \mathrm { M } & 1 \\\hline \mathrm { H } & 1 & \mathrm { K } & 5 \\\hline \mathrm {G } & 4 & \mathrm {~J} & 3 \\\hline \mathrm { F } & 2 & \mathrm { P } & 1 \\\hline \mathrm { B } & 2 & \mathrm {S } & 2 \\\hline \mathrm { T } & 4 & \mathrm {~W} & 3 \\\hline \end{array}


A)Resource 3
B)Resource 1
C)Resource 2
D)Resource 4
فتح الحزمة
افتح القفل للوصول البطاقات البالغ عددها 96 في هذه المجموعة.
فتح الحزمة
k this deck
19
 <strong>   -Use the Gantt chart and activity list to determine when resource 3 is free.  \begin{array} { | l | l | l | l | } \hline \text { Activity } & \text { Resources } & \text { Activity } & \text { Resources } \\ \hline  \mathrm {R }& 3 &  \mathrm { M } & 1 \\ \hline \mathrm { H } & 1 &  \mathrm { K } & 5 \\ \hline \mathrm {G } & 4 & \mathrm {~J} & 3 \\ \hline \mathrm { F } &2 & \mathrm { P } & 1 \\ \hline \mathrm { B } & 2 & \mathrm {S } & 2 \\ \hline \mathrm { T } & 4 & \mathrm {W} & 3 \\ \hline \end{array}  </strong> A)Between 0 and 10 B)Between 10 and 20 C)Between 20 and 30 D)Between 30 and 40

-Use the Gantt chart and activity list to determine when resource 3 is free.  Activity  Resources  Activity  Resources R3M1H1K5G4 J3F2P1B2S2T4W3\begin{array} { | l | l | l | l | } \hline \text { Activity } & \text { Resources } & \text { Activity } & \text { Resources } \\\hline \mathrm {R }& 3 & \mathrm { M } & 1 \\\hline \mathrm { H } & 1 & \mathrm { K } & 5 \\\hline \mathrm {G } & 4 & \mathrm {~J} & 3 \\\hline \mathrm { F } &2 & \mathrm { P } & 1 \\\hline \mathrm { B } & 2 & \mathrm {S } & 2 \\\hline \mathrm { T } & 4 & \mathrm {W} & 3 \\\hline \end{array}

A)Between 0 and 10
B)Between 10 and 20
C)Between 20 and 30
D)Between 30 and 40
فتح الحزمة
افتح القفل للوصول البطاقات البالغ عددها 96 في هذه المجموعة.
فتح الحزمة
k this deck
20
The most common type of logical sequencing between tasks is referred to as the:

A)Finish to start relationship.
B)Finish to finish relationship.
C)Start to start relationship.
D)Start to finish relationship.
فتح الحزمة
افتح القفل للوصول البطاقات البالغ عددها 96 في هذه المجموعة.
فتح الحزمة
k this deck
21
Use the information in the table to create a baseline Gantt chart for the project where activity lengths are given in days.
 Activity  Duration  Predecessor A6B3AC7AD5BE10CF8D,EG6FH4GJ10GK5H, J\begin{array} { | l | l | l |} \hline \text { Activity } & \text { Duration } & \text { Predecessor } \\\hline\mathrm { A } & 6 & - \\\hline\mathrm { B} & 3 &\mathrm { A } \\\hline \mathrm { C } & 7 & \mathrm {A} \\\hline \mathrm { D } & 5 & \mathrm {B} \\\hline \mathrm { E } & 10 & \mathrm { C } \\\hline \mathrm { F } & 8 & \mathrm { D } , \mathrm { E } \\\hline \mathrm { G } & 6 & \mathrm {F} \\\hline \mathrm { H } & 4 & \mathrm { G } \\\hline \mathrm { J } & 10 & \mathrm { G } \\\hline \mathrm { K } & 5 & \mathrm { H } ,\mathrm {~J} \\\hline\end{array}
فتح الحزمة
افتح القفل للوصول البطاقات البالغ عددها 96 في هذه المجموعة.
فتح الحزمة
k this deck
22
 <strong>   -Use the Gantt chart and activity list to determine which resource is used the most.  \begin{array} { | l | l | l | l | } \hline \text { Activity } & \text { Resources } & \text { Activity } & \text { Resources } \\ \hline \mathrm { R } & 3,5 & \mathrm { M } & 1,2 \\ \hline \mathrm { H } & 1 & \mathrm {~K} & 4 \\ \hline\mathrm { G } & 2,5 & \mathrm {~J} & 3 \\ \hline \mathrm { F } & 4,1 & \mathrm { P } & 1 \\ \hline\mathrm {B } & 2 &\mathrm {S } & 3,4 \\ \hline \mathrm { T } & 2 & \mathrm { W } & 3 \\ \hline \end{array} </strong> A)Resource 4 B)Resource 2 C)Resource 1 D)Resource 5

-Use the Gantt chart and activity list to determine which resource is used the most.  Activity  Resources  Activity  Resources R3,5M1,2H1 K4G2,5 J3F4,1P1B2S3,4T2W3\begin{array} { | l | l | l | l | } \hline \text { Activity } & \text { Resources } & \text { Activity } & \text { Resources } \\\hline \mathrm { R } & 3,5 & \mathrm { M } & 1,2 \\\hline \mathrm { H } & 1 & \mathrm {~K} & 4 \\\hline\mathrm { G } & 2,5 & \mathrm {~J} & 3 \\\hline \mathrm { F } & 4,1 & \mathrm { P } & 1 \\\hline\mathrm {B } & 2 &\mathrm {S } & 3,4 \\\hline \mathrm { T } & 2 & \mathrm { W } & 3 \\\hline\end{array}

A)Resource 4
B)Resource 2
C)Resource 1
D)Resource 5
فتح الحزمة
افتح القفل للوصول البطاقات البالغ عددها 96 في هذه المجموعة.
فتح الحزمة
k this deck
23
A project manager ascertained that five different resources are needed to complete a project that has been estimated to last 37 days.Just to be on the safe side,the project manager told the client that the project would definitely be delivered in 40 days and 40 nights and arranged to rent the resources for that period of time.The project manager goes to the local rental center at the start of day 1 of the project,signs a 40-day lease agreement for all five resources,and brings them to the site to begin the project.Analyze the Gantt chart and resource list (activity durations are in parenthesis)and determine how much money is being wasted with this rental plan.If each resource could be rented for just the time it takes to complete each activity,what would the charge to the project be?
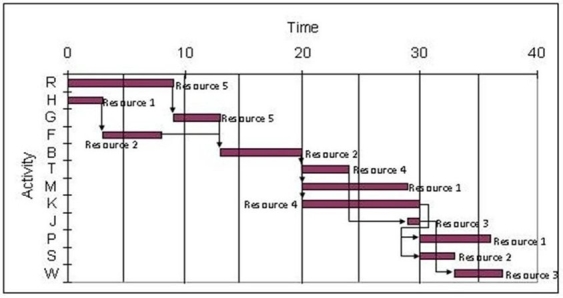
 A project manager ascertained that five different resources are needed to complete a project that has been estimated to last 37 days.Just to be on the safe side,the project manager told the client that the project would definitely be delivered in 40 days and 40 nights and arranged to rent the resources for that period of time.The project manager goes to the local rental center at the start of day 1 of the project,signs a 40-day lease agreement for all five resources,and brings them to the site to begin the project.Analyze the Gantt chart and resource list (activity durations are in parenthesis)and determine how much money is being wasted with this rental plan.If each resource could be rented for just the time it takes to complete each activity,what would the charge to the project be?    \begin{array} { | l | l | } \hline \text { Resource } & \\ \text { Nurnber } & \text { Daily Rate } \\ \hline 1 & \$ 1,000 \\ \hline 2 & \$ 1,200 \\ \hline 3 & \$ 500 \\ \hline 4 & \$ 750 \\ \hline 5 & \$ 800 \\ \hline \end{array}   \begin{array} { | l | l | l | l | } \hline \text { Activity } & \text { Length } & \text { Activity } & \text { Length } \\ \hline \mathrm { H } & 3 & \mathrm {S } & 3 \\ \hline \mathrm { M } & 9 & \mathrm {~J} & 1 \\ \hline \mathrm { P } & 6 & \mathrm {~W} & 4 \\ \hline \mathrm {B } & 7 &\mathrm { T }& 4 \\ \hline  \mathrm { R } & 9 & \mathrm { G } & 4 \\ \hline \mathrm { F } & 5 &\mathrm {K } & 10 \\ \hline \end{array}    Resource  Nurnber  Daily Rate 1$1,0002$1,2003$5004$7505$800\begin{array} { | l | l | } \hline \text { Resource } & \\ \text { Nurnber } & \text { Daily Rate } \\\hline 1 & \$ 1,000 \\\hline 2 & \$ 1,200 \\\hline 3 & \$ 500 \\\hline 4 & \$ 750 \\\hline 5 & \$ 800 \\\hline\end{array}  Activity  Length  Activity  Length H3S3M9 J1P6 W4B7T4R9G4F5K10\begin{array} { | l | l | l | l | } \hline \text { Activity } & \text { Length } & \text { Activity } & \text { Length } \\\hline \mathrm { H } & 3 & \mathrm {S } & 3 \\\hline \mathrm { M } & 9 & \mathrm {~J} & 1 \\\hline \mathrm { P } & 6 & \mathrm {~W} & 4 \\\hline \mathrm {B } & 7 &\mathrm { T }& 4 \\\hline \mathrm { R } & 9 & \mathrm { G } & 4 \\\hline \mathrm { F } & 5 &\mathrm {K } & 10 \\\hline\end{array}
فتح الحزمة
افتح القفل للوصول البطاقات البالغ عددها 96 في هذه المجموعة.
فتح الحزمة
k this deck
24
In order to accelerate completion of a project,the manager must crash critical path activities.
فتح الحزمة
افتح القفل للوصول البطاقات البالغ عددها 96 في هذه المجموعة.
فتح الحزمة
k this deck
25
 <strong>   -Use the Gantt chart and activity list to determine which resource is used the most.  \begin{array} { | l | l | l | l | } \hline \text { Activity } & \text { Resources } & \text { Activity } & \text { Resources } \\ \hline  \mathrm {R }&5&  \mathrm { M } & 1 \\ \hline \mathrm { H } & 1 &  \mathrm { K } & 4 \\ \hline \mathrm {G } & 5& \mathrm {~J} & 3 \\ \hline \mathrm { F } & 2 & \mathrm { P } & 1 \\ \hline \mathrm { B } & 2 & \mathrm {S } & 2 \\ \hline \mathrm { T } & 4 & \mathrm {~W} & 3 \\ \hline \end{array}  </strong> A)Resource 1 B)Resource 2 C)Resource 4 D)Resource 5

-Use the Gantt chart and activity list to determine which resource is used the most.  Activity  Resources  Activity  Resources R5M1H1K4G5 J3F2P1B2S2T4 W3\begin{array} { | l | l | l | l | } \hline \text { Activity } & \text { Resources } & \text { Activity } & \text { Resources } \\\hline \mathrm {R }&5& \mathrm { M } & 1 \\\hline \mathrm { H } & 1 & \mathrm { K } & 4 \\\hline \mathrm {G } & 5& \mathrm {~J} & 3 \\\hline \mathrm { F } & 2 & \mathrm { P } & 1 \\\hline \mathrm { B } & 2 & \mathrm {S } & 2 \\\hline \mathrm { T } & 4 & \mathrm {~W} & 3 \\\hline \end{array}

A)Resource 1
B)Resource 2
C)Resource 4
D)Resource 5
فتح الحزمة
افتح القفل للوصول البطاقات البالغ عددها 96 في هذه المجموعة.
فتح الحزمة
k this deck
26
Brook's Law states that the typical crashing decision to add more resources to an activity only delays the activity further.
فتح الحزمة
افتح القفل للوصول البطاقات البالغ عددها 96 في هذه المجموعة.
فتح الحزمة
k this deck
27
A basic Gantt chart:

A)Clearly displays early and late start and finish times for all activities.
B)Cannot be used to track the project's progress.
C)Permits scheduling resources well before they are needed.
D)Shows dummy activities to preserve network logic.
فتح الحزمة
افتح القفل للوصول البطاقات البالغ عددها 96 في هذه المجموعة.
فتح الحزمة
k this deck
28
Which of these approaches will NOT accelerate the completion of a project?

A)Improve the productivity of existing project resources.
B)Increase the bureaucratic oversight.
C)Improve the working method.
D)Increase the quantity of personnel and equipment.
فتح الحزمة
افتح القفل للوصول البطاقات البالغ عددها 96 في هذه المجموعة.
فتح الحزمة
k this deck
29
If an activity's cost is plotted against its duration on axes with zeros at the origin:

A)The slope of the line is positive because it costs more to finish an activity more quickly.
B)The slope of the line is negative because a shorter activity costs less than a longer one.
C)The slope of the line is negative because it costs more to finish an activity more quickly.
D)The slope of the line is positive because a longer activity costs more than a shorter one.
فتح الحزمة
افتح القفل للوصول البطاقات البالغ عددها 96 في هذه المجموعة.
فتح الحزمة
k this deck
30
One reason for crashing a project is:

A)The project has slipped behind schedule.
B)That the initial schedule may be too pessimistic.
C)Market needs change and the project is not in demand any more.
D)There are no repercussions for delivering the project late.
فتح الحزمة
افتح القفل للوصول البطاقات البالغ عددها 96 في هذه المجموعة.
فتح الحزمة
k this deck
31
 <strong>   -Use the Gantt chart and activity list to determine which resource is used the least.  \begin{array} { | l | l | l | l | } \hline \text { Activity } & \text { Resources } & \text { Activity } & \text { Resources } \\ \hline \mathrm { R } & 3,5 & \mathrm { M } & 1,2 \\ \hline \mathrm { H } & 1 & \mathrm {~K} & 4 \\ \hline\mathrm { G } & 2,5 & \mathrm {~J} & 3 \\ \hline \mathrm { F } & 4,1 & \mathrm { P } & 1 \\ \hline\mathrm {B } & 2 &\mathrm {S } & 3,4 \\ \hline \mathrm { T } & 2 & \mathrm { W } & 3 \\ \hline \end{array}  </strong> A)Resource 4 B)Resource 2 C)Resource 1 D)Resource 3

-Use the Gantt chart and activity list to determine which resource is used the least.  Activity  Resources  Activity  Resources R3,5M1,2H1 K4G2,5 J3F4,1P1B2S3,4T2W3\begin{array} { | l | l | l | l | } \hline \text { Activity } & \text { Resources } & \text { Activity } & \text { Resources } \\\hline \mathrm { R } & 3,5 & \mathrm { M } & 1,2 \\\hline \mathrm { H } & 1 & \mathrm {~K} & 4 \\\hline\mathrm { G } & 2,5 & \mathrm {~J} & 3 \\\hline \mathrm { F } & 4,1 & \mathrm { P } & 1 \\\hline\mathrm {B } & 2 &\mathrm {S } & 3,4 \\\hline \mathrm { T } & 2 & \mathrm { W } & 3 \\\hline\end{array}

A)Resource 4
B)Resource 2
C)Resource 1
D)Resource 3
فتح الحزمة
افتح القفل للوصول البطاقات البالغ عددها 96 في هذه المجموعة.
فتح الحزمة
k this deck
32
Gantt charts cannot depict float.
فتح الحزمة
افتح القفل للوصول البطاقات البالغ عددها 96 في هذه المجموعة.
فتح الحزمة
k this deck
33
An activity performed by a subcontractor is scheduled for 20 weeks at an anticipated cost of $100,000.Due to slippage on the critical path you need to reduce this activity by three weeks.If the subcontractor informs you that the activity can be completed in 16 weeks for $200,000,what is the slope for the activity?

A)$5,000 per week
B)$33,333 per week
C)$25,000 per week
D)$12,500 per week
فتح الحزمة
افتح القفل للوصول البطاقات البالغ عددها 96 في هذه المجموعة.
فتح الحزمة
k this deck
34
What is a Gantt chart,what information does one provide,and what are the benefits of using one?
فتح الحزمة
افتح القفل للوصول البطاقات البالغ عددها 96 في هذه المجموعة.
فتح الحزمة
k this deck
35
The most common method for shortening activity durations involves the decision to:

A)Eliminate bureaucracy.
B)Alter the technology used in the activity.
C)Assign more senior personnel to the activity.
D)Increase project resources.
فتح الحزمة
افتح القفل للوصول البطاقات البالغ عددها 96 في هذه المجموعة.
فتح الحزمة
k this deck
36
 <strong>   -Use the Gantt chart and activity list to determine which resource is released from this project for use in another project the earliest.  \begin{array} { | l | l | l | l | } \hline \text { Activity } & \text { Resources } & \text { Activity } & \text { Resources } \\ \hline \mathrm { R } & 3,5 & \mathrm { M } & 1,2 \\ \hline \mathrm { H } & 1 & \mathrm {~K} & 4 \\ \hline\mathrm { G } & 2,5 & \mathrm {~J} & 3 \\ \hline \mathrm { F } & 4,1 & \mathrm { P } & 1 \\ \hline\mathrm {B } & 2 &\mathrm {S } & 3,4 \\ \hline \mathrm { T } & 2 & \mathrm { W } & 3 \\ \hline \end{array}  </strong> A)Resource 2 B)Resource 4 C)Resource 1 D)Resource 3

-Use the Gantt chart and activity list to determine which resource is released from this project for use in another project the earliest.  Activity  Resources  Activity  Resources R3,5M1,2H1 K4G2,5 J3F4,1P1B2S3,4T2W3\begin{array} { | l | l | l | l | } \hline \text { Activity } & \text { Resources } & \text { Activity } & \text { Resources } \\\hline \mathrm { R } & 3,5 & \mathrm { M } & 1,2 \\\hline \mathrm { H } & 1 & \mathrm {~K} & 4 \\\hline\mathrm { G } & 2,5 & \mathrm {~J} & 3 \\\hline \mathrm { F } & 4,1 & \mathrm { P } & 1 \\\hline\mathrm {B } & 2 &\mathrm {S } & 3,4 \\\hline \mathrm { T } & 2 & \mathrm { W } & 3 \\\hline\end{array}

A)Resource 2
B)Resource 4
C)Resource 1
D)Resource 3
فتح الحزمة
افتح القفل للوصول البطاقات البالغ عددها 96 في هذه المجموعة.
فتح الحزمة
k this deck
37
The process of accelerating a project is referred to as:

A)Streamlining.
B)Expediting.
C)Rushing.
D)Crashing.
فتح الحزمة
افتح القفل للوصول البطاقات البالغ عددها 96 في هذه المجموعة.
فتح الحزمة
k this deck
38
In an actual project,one means of crashing critical path activities would be to perform at a lower level of quality.
فتح الحزمة
افتح القفل للوصول البطاقات البالغ عددها 96 في هذه المجموعة.
فتح الحزمة
k this deck
39
The critical path may not contain a dummy activity.
فتح الحزمة
افتح القفل للوصول البطاقات البالغ عددها 96 في هذه المجموعة.
فتح الحزمة
k this deck
40
Gantt charts can display early start or late start logic.
فتح الحزمة
افتح القفل للوصول البطاقات البالغ عددها 96 في هذه المجموعة.
فتح الحزمة
k this deck
41
A project has the activity duration and cost information indicated in the table where all times are in weeks.What is the total cost for completing this project as quickly as possible?  Activity  Predecessor  Normal  Time  Normal  Cost  Crash Time  Crash Cost  A 8$12,0005$22,000B A 12$18,0009$32,000 C  A 15$22,0009$62,000DB3$9,0002$18,000E C 9$15,0005$35,000FE7$5,0005$8,000GD8$13,0006$23,000HA12$20,0008$32,000JH6$45,0004$56,000\begin{array}{|l|l|l|l|l|l|}\hline \text { Activity } & \text { Predecessor } & \begin{array}{l}\text { Normal } \\\text { Time }\end{array} & \begin{array}{l}\text { Normal } \\\text { Cost }\end{array} & \text { Crash Time } & \text { Crash Cost } \\\hline \text { A } &--& 8 & \$ 12,000 & 5 & \$ 22,000 \\\hline \mathrm{B} & \text { A } & 12 & \$ 18,000 & 9 & \$ 32,000 \\\hline \text { C } & \text { A } & 15 & \$ 22,000 & 9 & \$ 62,000 \\\hline \mathrm{D} & \mathrm{B} & 3 & \$ 9,000 & 2& \$ 18,000 \\\hline \mathbf{E} & \text { C } & 9 & \$ 15,000 & 5 & \$ 35,000 \\\hline \mathrm{F} & \mathrm{E} & 7 & \$ 5,000 & 5 & \$ 8,000 \\\hline \mathrm{G} & \mathrm{D} & 8 & \$ 13,000 & 6 & \$ 23,000 \\\hline \mathrm{H} & \mathrm{A} & 12 & \$ 20,000 & 8 & \$ 32,000 \\\hline \mathrm{J} & \mathrm{H} & 6 & \$ 45,000 & 4 & \$ 56,000 \\\hline\end{array}


A)$244,000
B)$255,600
C)$258,333
D)$262,000
فتح الحزمة
افتح القفل للوصول البطاقات البالغ عددها 96 في هذه المجموعة.
فتح الحزمة
k this deck
42
A project has the activity duration and cost information indicated in the table where all times are in weeks.What is the total cost for completing this project in 40 days?  Normal  Normal  Activity  Predecessor  Time  Cost  Crash Time  Crash Cost A8$12,0005$22,000BA12$18,0009$32,000CA15$22,0009$62,000DB3$9,0002$18,000EC9$15,0005$35,000FE7$5,0005$8,000GD8$13,0006$23,000HA12$20,0008$32,000JH6$45,0004$56,000\begin{array}{|l|l|l|l|l|l|} \hline &&\text { Normal }&\text { Normal }\\\text { Activity } & \text { Predecessor } & \text { Time } & \text { Cost } & \text { Crash Time }&\text { Crash Cost }\\ \hline \mathrm{A} & - & 8 & \$ 12,000 & 5 & \$ 22,000 \\\hline \mathrm{B} & \mathrm{A} & 12 & \$ 18,000 & 9 & \$ 32,000 \\\hline \mathrm{C} & \mathrm{A} & 15 & \$ 22,000 & 9 & \$ 62,000 \\\hline \mathrm{D} & \mathrm{B} & 3 & \$ 9,000 & 2 & \$ 18,000 \\\hline \mathrm{E} & \mathrm{C} & 9 & \$ 15,000 & 5 & \$ 35,000 \\\hline \mathrm{F} & \mathrm{E} & 7 & \$ 5,000 & 5 & \$ 8,000 \\\hline \mathrm{G} & \mathrm{D} & 8 & \$ 13,000 & 6 & \$ 23,000 \\\hline \mathrm{H} & \mathrm{A} & 12 & \$ 20,000 & 8 & \$ 32,000 \\\hline \mathrm{J} & \mathrm{H} & 6 & \$ 45,000 & 4 & \$ 56,000\\\hline \end{array}

A)$172,000
B)$218,000
C)$192,000
D)$159,000
فتح الحزمة
افتح القفل للوصول البطاقات البالغ عددها 96 في هذه المجموعة.
فتح الحزمة
k this deck
43
A project has the activity duration and cost information indicated in the table where all times are in weeks.There is a penalty of $250 per week for every week the project extends beyond 32 weeks.What is the cost of the least expensive project possible?  Activity  Narmal  time  Crash  time  Narmal  Cust  Crash  Cast  Predecessar  A 85$1,0002,000B641,5002,000 A C851,8002,300 A B1291,0001,800 BE14119501,450 BF971,5001,900C,DG752,3002,800E,F\begin{array} { | l | l | l | l | l | l } \hline \text { Activity } & \begin{array} { l } \text { Narmal } \\\text { time }\end{array} & \begin{array} { l } \text { Crash } \\\text { time }\end{array} & \begin{array} { l } \text { Narmal } \\\text { Cust }\end{array} & \begin{array} { l } \text { Crash } \\\text { Cast }\end{array} & \text { Predecessar } \\\hline \text { A } & 8 & 5 & \$ 1, 000 & 2,000 & \\\hline B & 6 & 4 & 1,500 & 2,000 & \text { A } \\\hline \mathrm { C } & 8 & 5 & 1,800 & 2,300 & \text { A } \\\hline \mathrm { B } & 12 & 9 & 1,000 & 1,800 & \mathrm {~B} \\\hline \mathrm { E } & 14 & 11 & 950 & 1,450 & \mathrm {~B} \\\hline \mathrm { F } & 9 & 7 & 1,500 & 1,900 & \mathrm { C } , \mathrm { D } \\\hline \mathrm { G } & 7 & 5 & 2,300 & 2,800 & \mathrm { E } , \mathrm { F } \\\hline\end{array}

A)$11,450
B)$12,450
C)$13,450.
D)$14,450
فتح الحزمة
افتح القفل للوصول البطاقات البالغ عددها 96 في هذه المجموعة.
فتح الحزمة
k this deck
44
A project has the activity duration and cost information indicated in the table where all times are in weeks.What is the lowest total cost for completing this project in 33 weeks?
 Activity  Narmal  time  Crash  time  Normal  Cost  Crash  Cost  Predecessor  A 85$,0002,000B641,5002,000 A C851,8002,300 A B1291,0001,800 BE14119501,450 BF971,5001,900C,DG752,3002,800E,F\begin{array} { | l | l | l | l | l | l| } \hline \text { Activity } & \begin{array} { l } \text { Narmal } \\\text { time }\end{array} & \begin{array} { l } \text { Crash } \\\text { time }\end{array} & \begin{array} { l } \text { Normal } \\\text { Cost }\end{array} & \begin{array} { l } \text { Crash } \\\text { Cost }\end{array} & \text { Predecessor } \\\hline \text { A } & 8 & 5 & \$ , 000 & 2,000 & \\\hline B & 6 & 4 & 1,500 & 2,000 & \text { A } \\\hline \mathrm { C } & 8 & 5 & 1,800 & 2,300 & \text { A } \\\hline \mathrm { B } & 12 & 9 & 1,000 & 1,800 & \mathrm {~B} \\\hline \mathrm { E } & 14 & 11 & 950 & 1,450 & \mathrm {~B} \\\hline \mathrm { F } & 9 & 7 & 1,500 & 1,900 & \mathrm { C } , \mathrm { D } \\\hline \mathrm { G } & 7 & 5 & 2,300 & 2,800 & \mathrm { E } , \mathrm { F } \\\hline\end{array}
فتح الحزمة
افتح القفل للوصول البطاقات البالغ عددها 96 في هذه المجموعة.
فتح الحزمة
k this deck
45
Given the cost information in the table,what is the cheapest activity to crash on a per week basis?  Activity  Normal Time  Narmal Cost  Crash Time  Crash Cost A8$1,0005$6,000B62,00046,000C92,50068,000D124,000810,000\begin{array} { | l | l | l | l | l | } \hline \text { Activity } & \text { Normal Time } & \text { Narmal Cost } & \text { Crash Time } & \text { Crash Cost } \\\hline \mathrm { A } & 8 & \$ 1,000 & 5 & \$ 6,000 \\\hline \mathrm { B }& 6 & 2,000 & 4 & 6,000 \\\hline \mathrm { C } & 9 & 2,500 & 6 & 8,000 \\\hline \mathrm { D } & 12 & 4,000 & 8 & 10,000 \\\hline\end{array}

A)Activity A
B)Activity B
C)Activity C
D)Activity D
فتح الحزمة
افتح القفل للوصول البطاقات البالغ عددها 96 في هذه المجموعة.
فتح الحزمة
k this deck
46
Use the information in the table (all times are in days)to determine the lowest cost minimum completion time if the base cost for each activity finished in normal time is $1,000.  Normal Minimum Crash Cost ActivityTimeTime ($/day)  Predecessor A106$70B63$40C22BD42$60CE64$80AF85$90D,E\begin{array}{|l|l|l|l|l|} \hline&\text { Normal }&\text {Minimum}&\text { Crash Cost }\\ \text {Activity}&\text {Time}&\text {Time}&\text { (\$/day) }& \text { Predecessor }\\\hline \mathrm{A}& 10 & 6 & \$ 70 & -- \\ \hline\mathrm{ B} & 6 & 3 & \$ 40 & -- \\\hline \mathrm{C} & 2 & 2 & - & \mathrm{ B } \\\hline\mathrm{D} & 4 & 2 & \$ 60 &\mathrm{C } \\\hline \mathrm{E} & 6 & 4 & \$ 80 & \mathrm{ A } \\\hline \mathrm{F} & 8 & 5 & \$ 90 & \mathrm{D}, \mathrm{ E }\\\hline \end{array}

A)$7,120
B)$6,910
C)$6,790
D)$6,830
فتح الحزمة
افتح القفل للوصول البطاقات البالغ عددها 96 في هذه المجموعة.
فتح الحزمة
k this deck
47
Use the information in the table (all times are in days)to determine the lowest total cost for a 20-day project if the base cost for each activity finished in normal time is $1,000.  Normal Minimum Crash Cost ActivityTimeTime ($/day)  Predecessor A106$70B63$40C22BD42$60CE64$80AF85$90D,E\begin{array}{|l|l|l|l|l|} \hline&\text { Normal }&\text {Minimum}&\text { Crash Cost }\\ \text {Activity}&\text {Time}&\text {Time}&\text { (\$/day) }& \text { Predecessor }\\\hline\mathrm{A} & 10 & 6 & \$ 70 & -- \\ \hline \mathrm{B} & 6 & 3 & \$ 40 & -- \\\hline \mathrm{C} & 2 & 2 & - & \mathrm{ B } \\\hline \mathrm{D} & 4 & 2 & \$ 60 & \mathrm{C } \\\hline\mathrm{E} & 6 & 4 & \$ 80 & \mathrm{ A } \\\hline \mathrm{F} & 8 & 5 & \$ 90 & \mathrm{D}, \mathrm{ E }\\\hline \end{array}


A)$6,280
B)$6,390
C)$6,530
D)$6,740
فتح الحزمة
افتح القفل للوصول البطاقات البالغ عددها 96 في هذه المجموعة.
فتح الحزمة
k this deck
48
A project has the activity duration and cost information indicated in the table where all times are in weeks.For every week longer than 30 weeks,there is a penalty of $300.What is the highest total cost for completing this project?  Activity  Narmal  time  Crash  time  Narmal  Cust  Crash  Cast  Predecessar  A 85$1,0002,000B641,5002,000 A C851,8002,300 A B1291,0001,800 BE14119501,450 BF971,5001,900C,DG752,3002,800E,F\begin{array} { | l | l | l | l | l | l } \hline \text { Activity } & \begin{array} { l } \text { Narmal } \\\text { time }\end{array} & \begin{array} { l } \text { Crash } \\\text { time }\end{array} & \begin{array} { l } \text { Narmal } \\\text { Cust }\end{array} & \begin{array} { l } \text { Crash } \\\text { Cast }\end{array} & \text { Predecessar } \\\hline \text { A } & 8 & 5 & \$1 , 000 & 2,000 & \\\hline B & 6 & 4 & 1,500 & 2,000 & \text { A } \\\hline \mathrm { C } & 8 & 5 & 1,800 & 2,300 & \text { A } \\\hline \mathrm { B } & 12 & 9 & 1,000 & 1,800 & \mathrm {~B} \\\hline \mathrm { E } & 14 & 11 & 950 & 1,450 & \mathrm {~B} \\\hline \mathrm { F } & 9 & 7 & 1,500 & 1,900 & \mathrm { C } , \mathrm { D } \\\hline \mathrm { G } & 7 & 5 & 2,300 & 2,800 & \mathrm { E } , \mathrm { F } \\\hline\end{array}

A)$14,250
B)$13,950
C)$13,550
D)$13,150
فتح الحزمة
افتح القفل للوصول البطاقات البالغ عددها 96 في هذه المجموعة.
فتح الحزمة
k this deck
49
A project has the activity duration and cost information indicated in the table where all times are in weeks.There is a penalty of $250 per week for every week the project extends beyond 32 weeks.What is the duration of the least expensive project possible?  Activity  Narmal  time  Crash  time  Narmal  Cust  Crash  Cast  Predecessar  A 85$1,0002,000B641,5002,000 A C851,8002,300 A B1291,0001,800 BE14119501,450 BF971,5001,900C,DG752,3002,800E,F\begin{array} { | l | l | l | l | l | l| } \hline \text { Activity } & \begin{array} { l } \text { Narmal } \\\text { time }\end{array} & \begin{array} { l } \text { Crash } \\\text { time }\end{array} & \begin{array} { l } \text { Narmal } \\\text { Cust }\end{array} & \begin{array} { l } \text { Crash } \\\text { Cast }\end{array} & \text { Predecessar } \\\hline \text { A } & 8 & 5 & \$ 1, 000 & 2,000 & \\\hline B & 6 & 4 & 1,500 & 2,000 & \text { A } \\\hline \mathrm { C } & 8 & 5 & 1,800 & 2,300 & \text { A } \\\hline \mathrm { B } & 12 & 9 & 1,000 & 1,800 & \mathrm {~B} \\\hline \mathrm { E } & 14 & 11 & 950 & 1,450 & \mathrm {~B} \\\hline \mathrm { F } & 9 & 7 & 1,500 & 1,900 & \mathrm { C } , \mathrm { D } \\\hline \mathrm { G } & 7 & 5 & 2,300 & 2,800 & \mathrm { E } , \mathrm { F } \\\hline\end{array}

A)38 weeks
B)37 weeks
C)36 weeks
D)35 weeks
فتح الحزمة
افتح القفل للوصول البطاقات البالغ عددها 96 في هذه المجموعة.
فتح الحزمة
k this deck
50
Crashing costs for a project are governed by the function:
50t² + 100t
where t represents the number of days crashed (see graph).The project manager wants to crash the project,and is willing to pay up to $1,000 per day saved.How many days can be saved before the per-day cost is too high?
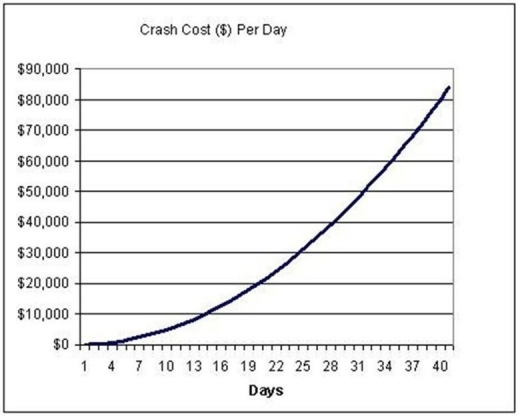
Crashing costs for a project are governed by the function: 50t² + 100t where t represents the number of days crashed (see graph).The project manager wants to crash the project,and is willing to pay up to $1,000 per day saved.How many days can be saved before the per-day cost is too high?
فتح الحزمة
افتح القفل للوصول البطاقات البالغ عددها 96 في هذه المجموعة.
فتح الحزمة
k this deck
51
What are the three principal methods for accelerating a project and under what circumstances might these methods yield little gain?
فتح الحزمة
افتح القفل للوصول البطاقات البالغ عددها 96 في هذه المجموعة.
فتح الحزمة
k this deck
52
It costs $75 per day for each day that a construction crew is on site.The project manager determines that most activities can be crashed and has listed the crashing costs next to the minimum time for each activity.Use this information to determine the lowest cost for this project.All times given are in days.  Normal Minimum Crash Cost ActivityTimeTime ($/day)  Predecessor A106$70B63$40C22 B D42$60 C E64$80 A F85$90D,E\begin{array}{|l|l|l|l|l|} \hline&\text { Normal }&\text {Minimum}&\text { Crash Cost }\\ \text {Activity}&\text {Time}&\text {Time}&\text { (\$/day) }& \text { Predecessor }\\\hline \mathrm{A}& 10 & 6 & \$ 70 & -- \\ \hline\mathrm{ B} & 6 & 3 & \$ 40 & -- \\\hline\mathrm{C} & 2 & 2 & - & \text { B } \\\hline\mathrm{D} & 4 & 2 & \$ 60 & \text { C } \\\hline \mathrm{E} & 6 & 4 & \$ 80 & \text { A } \\\hline \mathrm{F} & 8 & 5 & \$ 90 & \mathrm{D}, \mathrm{ E }\\\hline \end{array}


A)$1,720
B)$1,750
C)$1,780
D)$1,810
فتح الحزمة
افتح القفل للوصول البطاقات البالغ عددها 96 في هذه المجموعة.
فتح الحزمة
k this deck
53
A project has the activity duration and cost information indicated in the table where all times are in weeks.There is a penalty of $4,000 per week for every week the project exceeds 37 weeks.What is the lowest total cost for completing this project?  Activity  Predecessor  Normal  Time  Normal  Cost  Crash Time  Crash Cost  A 8$12,0005$22,000B A 12$18,0009$32,000 C  A 15$22,0009$62,000DB3$9,0002$18,000E C 9$15,0005$35,000FE7$5,0005$8,000GD8$13,0006$23,000HA12$20,0008$32,000JH6$45,0004$56,000\begin{array}{|l|l|l|l|l|l|}\hline \text { Activity } & \text { Predecessor } & \begin{array}{l}\text { Normal } \\\text { Time }\end{array} & \begin{array}{l}\text { Normal } \\\text { Cost }\end{array} & \text { Crash Time } & \text { Crash Cost } \\\hline \text { A } & -- & 8 & \$ 12,000 & 5 & \$ 22,000 \\\hline \mathrm{B} & \text { A } & 12 & \$ 18,000 & 9 & \$ 32,000 \\\hline \text { C } & \text { A } & 15 & \$ 22,000 & 9 & \$ 62,000 \\\hline \mathrm{D} & \mathrm{B} & 3 & \$ 9,000 & 2& \$ 18,000 \\\hline \mathbf{E} & \text { C } & 9 & \$ 15,000 & 5 & \$ 35,000 \\\hline \mathrm{F} & \mathrm{E} & 7 & \$ 5,000 & 5 & \$ 8,000 \\\hline \mathrm{G} & \mathrm{D} & 8 & \$ 13,000 & 6 & \$ 23,000 \\\hline \mathrm{H} & \mathrm{A} & 12 & \$ 20,000 & 8 & \$ 32,000 \\\hline \mathrm{J} & \mathrm{H} & 6 & \$ 45,000 & 4 & \$ 56,000 \\\hline\end{array}


A)$172,000
B)$184,000
C)$187,000
D)$192,500
فتح الحزمة
افتح القفل للوصول البطاقات البالغ عددها 96 في هذه المجموعة.
فتح الحزمة
k this deck
54
A project has the activity duration and cost information indicated in the table where all times are in weeks.What is the lowest total cost for completing this project in 35 days?  Activity  Predecessor  Normal  Time  Normal  Cost  Crash Time  Crash Cost  A 8$12,0005$22,000B A 12$18,0009$32,000 C  A 15$22,0009$62,000DB3$9,0002$18,000E C 9$15,0005$35,000FE7$5,0005$8,000GD8$13,0006$23,000HA12$20,0008$32,000JH6$45,0004$56,000\begin{array}{|l|l|l|l|l|l|}\hline \text { Activity } & \text { Predecessor } & \begin{array}{l}\text { Normal } \\\text { Time }\end{array} & \begin{array}{l}\text { Normal } \\\text { Cost }\end{array} & \text { Crash Time } & \text { Crash Cost } \\\hline \text { A } & -- & 8 & \$ 12,000 & 5 & \$ 22,000 \\\hline \mathrm{B} & \text { A } & 12 & \$ 18,000 & 9 & \$ 32,000 \\\hline \text { C } & \text { A } & 15 & \$ 22,000 & 9 & \$ 62,000 \\\hline \mathrm{D} & \mathrm{B} & 3 & \$ 9,000 & 2& \$ 18,000 \\\hline \mathbf{E} & \text { C } & 9 & \$ 15,000 & 5 & \$ 35,000 \\\hline \mathrm{F} & \mathrm{E} & 7 & \$ 5,000 & 5 & \$ 8,000 \\\hline \mathrm{G} & \mathrm{D} & 8 & \$ 13,000 & 6 & \$ 23,000 \\\hline \mathrm{H} & \mathrm{A} & 12 & \$ 20,000 & 8 & \$ 32,000 \\\hline \mathrm{J} & \mathrm{H} & 6 & \$ 45,000 & 4 & \$ 56,000 \\\hline\end{array}

A)$211,500
B)$197,500
C)$203,500
D)$194,500
فتح الحزمة
افتح القفل للوصول البطاقات البالغ عددها 96 في هذه المجموعة.
فتح الحزمة
k this deck
55
A project has the activity duration and cost information indicated in the table where all times are in weeks.What is the lowest total cost for completing this project in 33 weeks?  Activity  Narmal  time  Crash  time  Narmal  Cust  Crash  Cast  Predecessar  A 85$1,0002,000B641,5002,000 A C851,8002,300 A B1291,0001,800 BE14119501,450 BF971,5001,900C,DG752,3002,800E,F\begin{array} { | l | l | l | l | l | l } \hline \text { Activity } & \begin{array} { l } \text { Narmal } \\\text { time }\end{array} & \begin{array} { l } \text { Crash } \\\text { time }\end{array} & \begin{array} { l } \text { Narmal } \\\text { Cust }\end{array} & \begin{array} { l } \text { Crash } \\\text { Cast }\end{array} & \text { Predecessar } \\\hline \text { A } & 8 & 5 & \$1 , 000 & 2,000 & \\\hline B & 6 & 4 & 1,500 & 2,000 & \text { A } \\\hline \mathrm { C } & 8 & 5 & 1,800 & 2,300 & \text { A } \\\hline \mathrm { B } & 12 & 9 & 1,000 & 1,800 & \mathrm {~B} \\\hline \mathrm { E } & 14 & 11 & 950 & 1,450 & \mathrm {~B} \\\hline \mathrm { F } & 9 & 7 & 1,500 & 1,900 & \mathrm { C } , \mathrm { D } \\\hline \mathrm { G } & 7 & 5 & 2,300 & 2,800 & \mathrm { E } , \mathrm { F } \\\hline\end{array}

A)$11,250
B)$11,500
C)$12,250
D)$12,500
فتح الحزمة
افتح القفل للوصول البطاقات البالغ عددها 96 في هذه المجموعة.
فتح الحزمة
k this deck
56
What is project crashing and what are three reasons why it might be important to do so?
فتح الحزمة
افتح القفل للوصول البطاقات البالغ عددها 96 في هذه المجموعة.
فتح الحزمة
k this deck
57
Quite often the marginal gains in employee productivity decrease dramatically with the increased use of overtime.
فتح الحزمة
افتح القفل للوصول البطاقات البالغ عددها 96 في هذه المجموعة.
فتح الحزمة
k this deck
58
A project has the activity duration and cost information indicated in the table where all times are in weeks.There is a penalty of $6,000 per week for every week the project extends beyond 25 weeks.What is the lowest total cost duration for completing this project?  Activity  Predecessor  Normal  Time  Normal  Cost  Crash Time  Crash Cost  A 8$12,0005$22,000B A 12$18,0009$32,000 C  A 15$22,0009$62,000DB3$9,0002$18,000E C 9$15,0005$35,000FE7$5,0005$8,000GD8$13,0006$23,000HA12$20,0008$32,000JH6$45,0004$56,000\begin{array}{|l|l|l|l|l|l|}\hline \text { Activity } & \text { Predecessor } & \begin{array}{l}\text { Normal } \\\text { Time }\end{array} & \begin{array}{l}\text { Normal } \\\text { Cost }\end{array} & \text { Crash Time } & \text { Crash Cost } \\\hline \text { A } &--& 8 & \$ 12,000 & 5 & \$ 22,000 \\\hline \mathrm{B} & \text { A } & 12 & \$ 18,000 & 9 & \$ 32,000 \\\hline \text { C } & \text { A } & 15 & \$ 22,000 & 9 & \$ 62,000 \\\hline \mathrm{D} & \mathrm{B} & 3 & \$ 9,000 & 2& \$ 18,000 \\\hline \mathbf{E} & \text { C } & 9 & \$ 15,000 & 5 & \$ 35,000 \\\hline \mathrm{F} & \mathrm{E} & 7 & \$ 5,000 & 5 & \$ 8,000 \\\hline \mathrm{G} & \mathrm{D} & 8 & \$ 13,000 & 6 & \$ 23,000 \\\hline \mathrm{H} & \mathrm{A} & 12 & \$ 20,000 & 8 & \$ 32,000 \\\hline \mathrm{J} & \mathrm{H} & 6 & \$ 45,000 & 4 & \$ 56,000 \\\hline\end{array}


A)34 weeks
B)36 weeks
C)40 weeks
D)43 weeks
فتح الحزمة
افتح القفل للوصول البطاقات البالغ عددها 96 في هذه المجموعة.
فتح الحزمة
k this deck
59
Use the information in the table (all times are in days)to determine the lowest extra cost for an 18-day project if the base cost for each activity finished in normal time is $1,000.  Normal Minimum Crash Cost ActivityTimeTime ($/day)  Predecessor A106$70B63$40C22BD42$60CE64$80AF85$90D,E\begin{array}{|l|l|l|l|l|} \hline&\text { Normal }&\text {Minimum}&\text { Crash Cost }\\ \text {Activity}&\text {Time}&\text {Time}&\text { (\$/day) }& \text { Predecessor }\\\hline \mathrm{A}& 10 & 6 & \$ 70 & -- \\ \hline \mathrm{B} & 6 & 3 & \$ 40 & -- \\\hline\mathrm{C} & 2 & 2 & - &\mathrm{B } \\\hline\mathrm{D} & 4 & 2 & \$ 60 &\mathrm{ C } \\\hline \mathrm{E} & 6 & 4 & \$ 80 &\mathrm{ A } \\\hline\mathrm{F} & 8 & 5 & \$ 90 & \mathrm{D},\mathrm{ E }\\\hline \end{array}


A)$400
B)$420
C)$440
D)$460
فتح الحزمة
افتح القفل للوصول البطاقات البالغ عددها 96 في هذه المجموعة.
فتح الحزمة
k this deck
60
What is the cost to finish this project (all activity durations are in weeks and costs in US dollars)as quickly as possible?
 Normal  Minimum  Normal  Activity  Predecessor  Time  Time  Cost  Crash Cost A121010001500 B  A 5312001950 C  A 9715002100 D  B, C 141018002100 E  B 4314001875 F  D 9810001450 G  E 757001200 H  F, G 11820003000 I  H 8611001700\begin{array}{|l|l|l|l|l|l|} \hline &&\text { Normal }&\text { Minimum }&\text { Normal }\\ \text { Activity } & \text { Predecessor } & \text { Time } &\text { Time } & \text { Cost }&\text { Crash Cost }\\ \hline \mathbf{A} & & 12 & 10 & 1000 & 1500 \\\hline \text { B } & \text { A } & 5 & 3 & 1200 & 1950 \\\hline \text { C } & \text { A } & 9 & 7 & 1500 & 2100 \\\hline \text { D } & \text { B, C } & 14 & 10 & 1800 & 2100 \\\hline \text { E } & \text { B } & 4 & 3 & 1400 & 1875 \\\hline \text { F } & \text { D } & 9 & 8 & 1000 & 1450 \\\hline \text { G } & \text { E } & 7 & 5 & 700 & 1200 \\\hline \text { H } & \text { F, G } & 11 & 8 & 2000 & 3000 \\\hline \text { I } & \text { H } & 8 & 6 & 1100 & 1700 \\\hline \end{array}

فتح الحزمة
افتح القفل للوصول البطاقات البالغ عددها 96 في هذه المجموعة.
فتح الحزمة
k this deck
61
What is the duration of the project shown in the network?

A)36
B)37
C)38
D)39
فتح الحزمة
افتح القفل للوصول البطاقات البالغ عددها 96 في هذه المجموعة.
فتح الحزمة
k this deck
62
Consider the project described by the table where all durations are in days and the costs in dollars.What is the minimum cost of completing this project in 150 days?
 Normal  Minimum Normal  Activity Predecessor Time  Time  Cost  Crash Cost A15128001,100BA30222,5004,100CA453721,00033,000DC201715,00022,000ED543,0003,300FB10713,00015,500GF302541,00046,000HJ,E504530,00037,500JF252020,00025,000KG35336,5007,200LK403316,50019,400ML151314,40018,600NK302623,50027,500PH201515,25023,500QN,P555,0005,000\begin{array}{|l|l|l|l|l|l|}\hline&&\text { Normal } & \text { Minimum } & \text {Normal }\\ \text { Activity} & \text { Predecessor } & \text {Time } & \text { Time } & \text { Cost } & \text { Crash Cost }\\ \hline\mathrm{A} & 15 & 12 & 800 & 1,100 & \\\hline\mathrm{B} & \mathrm{A} & 30 & 22 & 2,500 & 4,100 \\\hline \mathrm{C} & \mathrm{A} & 45 & 37 & 21,000 & 33,000 \\\hline \mathrm{D} & \mathrm{C} & 20 & 17 & 15,000 & 22,000 \\\hline\mathrm{E} & \mathrm{D} & 5 & 4 & 3,000 & 3,300 \\\hline\mathrm{F} & \mathrm{B} & 10 & 7 & 13,000 & 15,500 \\\hline \mathrm{G} & \mathrm{F} & 30 & 25 & 41,000 & 46,000 \\\hline \mathrm{H} & \mathrm{J}, \mathrm{E} & 50 & 45 & 30,000 & 37,500 \\\hline \mathrm{J} & \mathrm{F} & 25 & 20 & 20,000 & 25,000 \\\hline\mathrm{K} & \mathrm{G} & 35 & 33 & 6,500 & 7,200 \\\hline\mathrm{L} & \mathrm{K} & 40 & 33 & 16,500 & 19,400 \\\hline\mathrm{M} &\mathrm{L} & 15 & 13 & 14,400 & 18,600 \\\hline \mathrm{N} & \mathrm{K} & 30 & 26 & 23,500 & 27,500 \\\hline\mathrm{P} & \mathrm{H} & 20 & 15 & 15,250 & 23,500 \\\hline\mathrm{Q} & \mathrm{N}, \mathrm{P} & 5 & 5 & 5,000 & 5,000\\\hline \end{array}

فتح الحزمة
افتح القفل للوصول البطاقات البالغ عددها 96 في هذه المجموعة.
فتح الحزمة
k this deck
63
The heir to the throne was due 60 days from now and the first-time father had a serious construction project on his hands converting his man cave into a nursery.The seven activities,their normal and expedited times (in days)and costs appear in the table.Just to be on the safe side,he decided to bring the project in at 53 days in case the delivery was a week early.Tell him what the least expensive 53-day project is;which activities should be reduced in duration,by how many days,and at the total cost,so he can roll up the sleeves on his "World's Greatest Dad" sweatshirt,and get to work.
 Normal  Crash  Normal  Crash  Activity  time  time  Cost  Cast  Predecesar A55001100B18159002300AC12925003000AD97500650BE151230005000BF121040005000C,DG201536004800E,F\begin{array} { | l | l | l | l | l | l |} \hline & \text { Normal } & \text { Crash } & \text { Normal } & \text { Crash } & \\\text { Activity } & \text { time } & \text { time } & \text { Cost } & \text { Cast } & \text { Predecesar } \\\hline\mathrm { A }& 5 & 500 & 1100 & \\\hline \mathrm { B } & 18 & 15 & 900 & 2300 &\mathrm { A } \\\hline \mathrm { C } & 12 & 9 & 2500 & 3000 & \mathrm { A } \\\hline \mathrm { D } & 9 & 7 & 500 & 650 &\mathrm { B } \\\hline \mathrm { E } & 15 & 12 & 3000 & 5000 &\mathrm { B } \\\hline \mathrm { F } & 12 & 10 & 4000 & 5000 & \mathrm { C } , \mathrm { D } \\\hline \mathrm {G}&20&15&3600&4800& \mathrm {E,F}\\\hline\end{array}
فتح الحزمة
افتح القفل للوصول البطاقات البالغ عددها 96 في هذه المجموعة.
فتح الحزمة
k this deck
64
An AOA network:

A)Cannot show a merge activity.
B)Cannot show a burst activity.
C)Cannot have consecutive merge and burst activities.
D)Can have all of the features described in A-C above.
فتح الحزمة
افتح القفل للوصول البطاقات البالغ عددها 96 في هذه المجموعة.
فتح الحزمة
k this deck
65
AOA is a more useful technique than AON if the project is complex and has many significant milestones.
فتح الحزمة
افتح القفل للوصول البطاقات البالغ عددها 96 في هذه المجموعة.
فتح الحزمة
k this deck
66
<strong>  Which of the activities in the diagram have slack?</strong> A)C and D B)B and D C)C and E D)B and E
Which of the activities in the diagram have slack?

A)C and D
B)B and D
C)C and E
D)B and E
فتح الحزمة
افتح القفل للوصول البطاقات البالغ عددها 96 في هذه المجموعة.
فتح الحزمة
k this deck
67
The fastest completion time for this project is: <strong>The fastest completion time for this project is:  </strong> A)14. B)15. C)16. D)17.
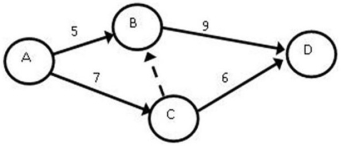
A)14.
B)15.
C)16.
D)17.
فتح الحزمة
افتح القفل للوصول البطاقات البالغ عددها 96 في هذه المجموعة.
فتح الحزمة
k this deck
68
The heir to the throne was due 56 days from now and the first-time father had a serious construction project on his hands converting his man cave into a nursery.The seven activities,their normal and expedited times (in days)and costs appear in the table.What is the minimum cost to ensure that this project is completed in 56 days? Which activities should be reduced and by how many days?
 Normal  Crash  Normal  Crash  Activity  time  time  Cost  Cast  Predecesar A55001100B18159002300AC12925003000AD97500650BE151230005000BF121040005000C,DG201536004800E,F\begin{array} { | l | l | l | l | l | l |} \hline & \text { Normal } & \text { Crash } & \text { Normal } & \text { Crash } & \\\text { Activity } & \text { time } & \text { time } & \text { Cost } & \text { Cast } & \text { Predecesar } \\\hline\mathrm { A }& 5 & 500 & 1100 & \\\hline \mathrm { B } & 18 & 15 & 900 & 2300 &\mathrm { A } \\\hline \mathrm { C } & 12 & 9 & 2500 & 3000 & \mathrm { A } \\\hline \mathrm { D } & 9 & 7 & 500 & 650 &\mathrm { B } \\\hline \mathrm { E } & 15 & 12 & 3000 & 5000 &\mathrm { B } \\\hline \mathrm { F } & 12 & 10 & 4000 & 5000 & \mathrm { C } , \mathrm { D } \\\hline \mathrm {G}&20&15&3600&4800& \mathrm {E,F}\\\hline\end{array}
فتح الحزمة
افتح القفل للوصول البطاقات البالغ عددها 96 في هذه المجموعة.
فتح الحزمة
k this deck
69
The AOA network described by this table needs:  Activity  Predecessor ABE A BA,BECFC,D\begin{array} { | l | l | } \hline \text { Activity } & \text { Predecessor } \\\hline\mathrm { A } & - - \\\hline \mathrm {B} & - - \\\hline \mathrm { E } & \text { A } \\\hline \mathrm { B } & \mathrm { A } , \mathrm { B } \\\hline \mathrm { E } & \mathrm { C } \\\hline \mathrm { F } & \mathrm { C } , \mathrm { D } \\\hline \end{array}

A)Zero dummy activities.
B)One dummy activity.
C)Two dummy activities.
D)Three dummy activities.
فتح الحزمة
افتح القفل للوصول البطاقات البالغ عددها 96 في هذه المجموعة.
فتح الحزمة
k this deck
70
Most project management software employs AOA diagramming.
فتح الحزمة
افتح القفل للوصول البطاقات البالغ عددها 96 في هذه المجموعة.
فتح الحزمة
k this deck
71
Dummy activities:

A)Do not have any duration value attached to them.
B)Have durations equal to the length of the predecessors.
C)Have durations equal to the length of the successors.
D)Have durations equal to the lag needed to preserve network logic.
فتح الحزمة
افتح القفل للوصول البطاقات البالغ عددها 96 في هذه المجموعة.
فتح الحزمة
k this deck
72
The critical path of this network is: <strong>The critical path of this network is:  </strong> A)14. B)15. C)12. D)13.
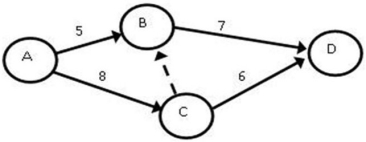
A)14.
B)15.
C)12.
D)13.
فتح الحزمة
افتح القفل للوصول البطاقات البالغ عددها 96 في هذه المجموعة.
فتح الحزمة
k this deck
73
<strong>  What is the late finish for activity D in the network shown in the diagram?</strong> A)15 B)16 C)17 D)18
What is the late finish for activity D in the network shown in the diagram?

A)15
B)16
C)17
D)18
فتح الحزمة
افتح القفل للوصول البطاقات البالغ عددها 96 في هذه المجموعة.
فتح الحزمة
k this deck
74
What is the minimum completion cost of this project if there is a penalty of $1,000 for each day the project lasts longer than 27 days? Activity durations in days and crash costs in dollars are given in the table.
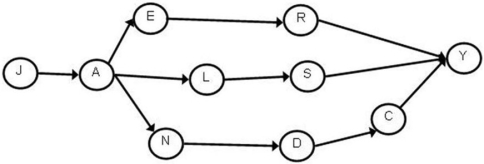
 Reg  Crash  Reg  Crash  Reg  Crash  Reg  Crash  Activity Length Length Cost  Cost  Activity  Length  Length Cost Cost A764001,200L758001,500C11450450N655001,250D965502,350R44600600E975001,650S1084501,350J216001,800Y866751,750\begin{array}{|l|l|l|l|l|l|l|l|l|l|}\hline&\text { Reg } & \text { Crash }& \text { Reg } &\text { Crash }&&\text { Reg } & \text { Crash }& \text { Reg } &\text { Crash } \\ \text { Activity }&\text {Length }&\text {Length }&\text {Cost }& \text { Cost }&\text { Activity }&\text { Length }&\text { Length }&\text {Cost }&\text {Cost }\\\hline \mathrm{A} & 7 & 6 & 400 & 1,200 & \mathrm{L} & 7 & 5 & 800 & 1,500 \\\hline \mathrm{C} & 1 & 1 & 450 & 450 & \mathrm{N} & 6 & 5 & 500 & 1,250 \\\hline \mathrm{D} & 9 & 6 & 550 & 2,350 &\mathrm{R} & 4 & 4 & 600 & 600 \\\hline \mathrm{E} & 9 & 7 & 500 & 1,650 & \mathrm{S} & 10 & 8 & 450 & 1,350 \\\hline \mathrm{J} & 2 & 1 & 600 & 1,800 & \mathrm{Y} & 8 & 6 & 675 & 1,750\\\hline \end{array}
 What is the minimum completion cost of this project if there is a penalty of $1,000 for each day the project lasts longer than 27 days? Activity durations in days and crash costs in dollars are given in the table.  \begin{array}{|l|l|l|l|l|l|l|l|l|l|} \hline&\text { Reg } & \text { Crash }& \text { Reg } &\text { Crash }&&\text { Reg } & \text { Crash }& \text { Reg } &\text { Crash } \\ \text { Activity }&\text {Length  }&\text {Length  }&\text {Cost }& \text { Cost }&\text { Activity }&\text { Length }&\text { Length }&\text {Cost  }&\text {Cost }\\ \hline \mathrm{A} & 7 & 6 & 400 & 1,200 & \mathrm{L} & 7 & 5 & 800 & 1,500 \\ \hline \mathrm{C} & 1 & 1 & 450 & 450 & \mathrm{N} & 6 & 5 & 500 & 1,250 \\ \hline \mathrm{D} & 9 & 6 & 550 & 2,350 &\mathrm{R} & 4 & 4 & 600 & 600 \\ \hline \mathrm{E} & 9 & 7 & 500 & 1,650 & \mathrm{S} & 10 & 8 & 450 & 1,350 \\ \hline \mathrm{J} & 2 & 1 & 600 & 1,800 & \mathrm{Y} & 8 & 6 & 675 & 1,750\\ \hline \end{array}
فتح الحزمة
افتح القفل للوصول البطاقات البالغ عددها 96 في هذه المجموعة.
فتح الحزمة
k this deck
75
AON networks have an advantage over AOA networks:

A)If the project under study is complex.
B)Because they don't need dummy activities.
C)In the construction industry because they are the norm.
D)When it is critical to highlight milestones.
فتح الحزمة
افتح القفل للوصول البطاقات البالغ عددها 96 في هذه المجموعة.
فتح الحزمة
k this deck
76
What is the minimum cost completion time for this project if the activities have normal and crash costs as indicated and there is a $1,000 fixed cost for each day on site plus a $500 penalty for each activity that is crashed? The crash costs represent the cost of a fully expedited activity.For example,reducing activity Y from 13 days to 12 days costs an extra $100 on top of the $500 expediting cost for a total cost of $2,600.Reducing Y from 13 days to 10 days costs an extra $300 on top of the $500 expediting cost,for a total activity cost of $2,800.
 Normal Normal Crash Activity Predecessor Time  Cost  Time  Crash Cost Z2$2,0002$2,000Y13$2,00010$2,300X19$2,00015$3,000WZ18$2,00015$3,000VX10$2,0009$3,000UY13$2,00011$3,000TW18$2,00014$4,000SV4$2,0003$3,000RU6$2,0005$3,000QR,S15$2,00013$3,000PT13$2,00012$3,000NP,Q4$2,0004$2,000\begin{array}{|l|l|l|l|l|l|}\hline&&\text { Normal } & \text {Normal }& \text {Crash}\\ \text { Activity} & \text { Predecessor } & \text {Time } & \text { Cost } & \text { Time } & \text { Crash Cost }\\ \hline\mathrm{ Z} & & 2 & \$ 2,000 & 2 & \$ 2,000 \\\hline \mathrm{Y} & & 13 & \$ 2,000 & 10 & \$ 2,300 \\\hline \mathrm{X} & & 19 & \$ 2,000 & 15 & \$ 3,000 \\\hline \mathrm{W} & \mathrm{Z} & 18 & \$ 2,000 & 15 & \$ 3,000 \\\hline \mathrm{V} & \mathrm{X} & 10 & \$ 2,000 & 9 & \$ 3,000 \\\hline \mathrm{U} & \mathrm{Y} & 13 & \$ 2,000 & 11 & \$ 3,000 \\\hline \mathrm{T} & \mathrm{W} & 18 & \$ 2,000 & 14 & \$ 4,000 \\\hline \mathrm{S} & \mathrm{V} & 4 & \$ 2,000 & 3 & \$ 3,000 \\\hline \mathrm{R} & \mathrm{U} & 6 & \$ 2,000 & 5 & \$ 3,000 \\\hline\mathrm{Q} & \mathrm{R}, \mathrm{S} & 15 & \$ 2,000 & 13 & \$ 3,000 \\\hline \mathrm{P} & T & 13 & \$ 2,000 & 12 & \$ 3,000 \\\hline \mathrm{N} & \mathrm{P}, \mathrm{Q} & 4 & \$ 2,000 & 4 & \$ 2,000\\\hline \end{array}
فتح الحزمة
افتح القفل للوصول البطاقات البالغ عددها 96 في هذه المجموعة.
فتح الحزمة
k this deck
77
The AOA network described by this table needs:  Activity  Predecessor ABC A, B DBEC,D\begin{array} { | l | l | } \hline \text { Activity } & \text { Predecessor } \\\hline\mathrm {A } & - - \\\hline\mathrm { B} & - - \\\hline \mathrm { C } & \text { A, B } \\\hline \mathrm { D } & \mathrm { B } \\\hline \mathrm { E } & \mathrm { C } , \mathrm { D } \\ \hline\end{array}

A)Zero dummy activities.
B)One dummy activity.
C)Two dummy activities.
D)Three dummy activities.
فتح الحزمة
افتح القفل للوصول البطاقات البالغ عددها 96 في هذه المجموعة.
فتح الحزمة
k this deck
78
What information is NOT included in the nodes for an AOA network?

A)Label
B)Early start time
C)Late finish time
D)Early finish time
فتح الحزمة
افتح القفل للوصول البطاقات البالغ عددها 96 في هذه المجموعة.
فتح الحزمة
k this deck
79
AOA networks have an advantage over AON networks:

A)If the project is complex.
B)Because they are easier to read for novices.
C)When it comes to software packages for project management.
D)When the task of network labeling is considered.
فتح الحزمة
افتح القفل للوصول البطاقات البالغ عددها 96 في هذه المجموعة.
فتح الحزمة
k this deck
80
An activity on an arrow network:

A)Cannot have more arrows than nodes.
B)Cannot have more nodes than arrows.
C)Has one more node than arrows.
D)Has one more arrow than nodes.
فتح الحزمة
افتح القفل للوصول البطاقات البالغ عددها 96 في هذه المجموعة.
فتح الحزمة
k this deck
locked card icon
فتح الحزمة
افتح القفل للوصول البطاقات البالغ عددها 96 في هذه المجموعة.