Deck 18: Introduction to Quality and Statistical Process Control
ملء الشاشة (f)
سؤال
سؤال
سؤال
It is entirely possible for the R-chart to show that a process is in statistical control and the  -chart to show that the same process is out of control.
-chart to show that the same process is out of control. سؤال
سؤال
سؤال
سؤال
سؤال
سؤال
سؤال
سؤال
سؤال
سؤال
سؤال
سؤال
سؤال
سؤال
سؤال
سؤال
سؤال
سؤال
سؤال
سؤال
سؤال
A company that fills soft drinks into bottles has established an  -chart and an R-chart to monitor the average fill level in the bottles.To do this,the company has taken a series of samples of size n = 4 bottles.The overall average fill is 12.03 ounces.The average range for the subgroups has been .06 ounces.Suppose,after developing the control chart,a subgroup of size 4 yields a sample mean of 12.09 ounces and a range of .08,which of the following statements is true?
A)The process is in control on both the
-chart and the R-chart.
B)The process is out of control on the R-chart but in control on the
-chart.
C)The process is out of control on the
-chart but in control on the R-chart.
D)The process is out of control on both the
-chart and an R-chart to monitor the average fill level in the bottles.To do this,the company has taken a series of samples of size n = 4 bottles.The overall average fill is 12.03 ounces.The average range for the subgroups has been .06 ounces.Suppose,after developing the control chart,a subgroup of size 4 yields a sample mean of 12.09 ounces and a range of .08,which of the following statements is true?A)The process is in control on both the
-chart and the R-chart.
B)The process is out of control on the R-chart but in control on the
-chart.
C)The process is out of control on the
-chart but in control on the R-chart.
D)The process is out of control on both the
سؤال
سؤال
سؤال
سؤال
سؤال
سؤال
سؤال
A company that fills soft drinks into bottles wishes to establish an  -chart to monitor the average fill level in the bottles.To do this,the company has taken a series of samples of size n = 4 bottles.The overall average fill is 12.03 ounces.The average range for the subgroups has been .06 ounces.Based on this information,what is the upper limit of the 3-sigma control limit?
A).729
B).0437
C)12.09
D)12.074
-chart to monitor the average fill level in the bottles.To do this,the company has taken a series of samples of size n = 4 bottles.The overall average fill is 12.03 ounces.The average range for the subgroups has been .06 ounces.Based on this information,what is the upper limit of the 3-sigma control limit?A).729
B).0437
C)12.09
D)12.074
سؤال
سؤال
سؤال
A plywood manufacturer is interested in monitoring the thickness of the plywood.Which of the following would be most useful for doing this?
A)p-charts
B)c-charts
C)
-charts
D)Histograms
A)p-charts
B)c-charts
C)
-charts
D)Histograms
سؤال
سؤال
سؤال
سؤال
سؤال
سؤال
سؤال
سؤال
A tire company is interested in monitoring the process that produced tread thickness on its tires.Every hour 4 tires are selected from production and the tread thickness is measured.Data for the past 25 days is shown as follows: 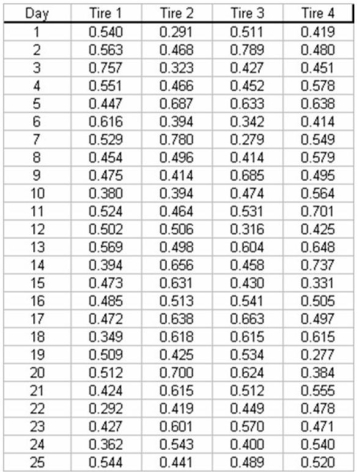 a.What type of control chart would you recommend be used in this case?
b.Compute the upper and lower control limits for these data.
a.What type of control chart would you recommend be used in this case?b.Compute the upper and lower control limits for these data.
سؤال

فتح الحزمة
قم بالتسجيل لفتح البطاقات في هذه المجموعة!
Unlock Deck
Unlock Deck
1/43
العب
ملء الشاشة (f)
Deck 18: Introduction to Quality and Statistical Process Control
1
Variation exists naturally in the world around us so all processes and products can be expected to vary.
True
2
Total process variation is made up of the sum of common cause variation and special cause variation.
True
3
It is entirely possible for the R-chart to show that a process is in statistical control and the -chart to show that the same process is out of control.
-chart to show that the same process is out of control.True
4
Special cause variation is variation in the output of a process that is naturally occurring and expected and that may be the result of random causes.
فتح الحزمة
افتح القفل للوصول البطاقات البالغ عددها 43 في هذه المجموعة.
فتح الحزمة
k this deck
5
One of the roles of managers who are overseeing the statistical process control analysis is to set the control limits at the desired levels prior to collecting data from the process.
فتح الحزمة
افتح القفل للوصول البطاقات البالغ عددها 43 في هذه المجموعة.
فتح الحزمة
k this deck
6
Process control charts are used to provide signals to indicate when the output of a process is out of control.
فتح الحزمة
افتح القفل للوصول البطاقات البالغ عددها 43 في هذه المجموعة.
فتح الحزمة
k this deck
7
Both p-charts and c-charts are designed for use when the data we are working with are referred to as attribute data.
فتح الحزمة
افتح القفل للوصول البطاقات البالغ عددها 43 في هذه المجموعة.
فتح الحزمة
k this deck
8
The control limits in the x-bar chart are set so that 95 percent of the values will fall inside the control limits when there is only common cause variation.
فتح الحزمة
افتح القفل للوصول البطاقات البالغ عددها 43 في هذه المجموعة.
فتح الحزمة
k this deck
9
Common cause variation is variation in the output of a process that is unexpected and has an assignable cause.
فتح الحزمة
افتح القفل للوصول البطاقات البالغ عددها 43 في هذه المجموعة.
فتح الحزمة
k this deck
10
A p-chart would potentially be used to monitor the diameters of bolts made by a bolt manufacturing plant.
فتح الحزمة
افتح القفل للوصول البطاقات البالغ عددها 43 في هذه المجموعة.
فتح الحزمة
k this deck
11
In process improvement efforts,the goal is to first remove the common cause variation and then to reduce the special cause variation in a system.
فتح الحزمة
افتح القفل للوصول البطاقات البالغ عددها 43 في هذه المجموعة.
فتح الحزمة
k this deck
12
In most processes,the process control limits are set to correspond with the specification limits on the product.
فتح الحزمة
افتح القفل للوصول البطاقات البالغ عددها 43 في هذه المجموعة.
فتح الحزمة
k this deck
13
The six most common sources of variation are people,machines,materials,methods,measurement,and environment.
فتح الحزمة
افتح القفل للوصول البطاقات البالغ عددها 43 في هذه المجموعة.
فتح الحزمة
k this deck
14
A stable process is typically defined as one in which all output is operating within ± 3 standard deviations of the process center.
فتح الحزمة
افتح القفل للوصول البطاقات البالغ عددها 43 في هذه المجموعة.
فتح الحزمة
k this deck
15
A stable process is one that has had all its variation removed through quality improvement efforts on the part of the organization.
فتح الحزمة
افتح القفل للوصول البطاقات البالغ عددها 43 في هذه المجموعة.
فتح الحزمة
k this deck
16
If a process control chart has only one point outside the upper or lower control limits,there is insufficient evidence to conclude that the process was out of control at the time that the measurement was taken.
فتح الحزمة
افتح القفل للوصول البطاقات البالغ عددها 43 في هذه المجموعة.
فتح الحزمة
k this deck
17
A process control chart can be used to determine whether the process average has shifted up or down,but is not useful for determining whether the process is just drifting in an upward or downward direction.
فتح الحزمة
افتح القفل للوصول البطاقات البالغ عددها 43 في هذه المجموعة.
فتح الحزمة
k this deck
18
One of the most common sources of common cause variation is the people who are working in the process.
فتح الحزمة
افتح القفل للوصول البطاقات البالغ عددها 43 في هذه المجموعة.
فتح الحزمة
k this deck
19
We expect virtually all the data in a stable process to fall within 2 standard deviations of the mean.
فتح الحزمة
افتح القفل للوصول البطاقات البالغ عددها 43 في هذه المجموعة.
فتح الحزمة
k this deck
20
The frequency distribution of most processes' statistics will begin to resemble the shape of the normal distribution as the values are collected and grouped into classes.
فتح الحزمة
افتح القفل للوصول البطاقات البالغ عددها 43 في هذه المجموعة.
فتح الحزمة
k this deck
21
When discussing variation in the output of a process,which of the following is not true?
A)Variation is natural.
B)No two products or services are exactly the same.
C)With a fine enough measurement gauge,all things can be seen to differ.
D)Common cause variation can be eliminated.
A)Variation is natural.
B)No two products or services are exactly the same.
C)With a fine enough measurement gauge,all things can be seen to differ.
D)Common cause variation can be eliminated.
فتح الحزمة
افتح القفل للوصول البطاقات البالغ عددها 43 في هذه المجموعة.
فتح الحزمة
k this deck
22
The x-bar chart is based on the principles of which distribution?
A)t-distribution
B)Chi square distribution
C)F distribution
D)Normal distribution
A)t-distribution
B)Chi square distribution
C)F distribution
D)Normal distribution
فتح الحزمة
افتح القفل للوصول البطاقات البالغ عددها 43 في هذه المجموعة.
فتح الحزمة
k this deck
23
Which of the following in not an out of control signal for an x-bar chart?
A)One or more points outside the control limits
B)Seven or more consecutive points that all fall on the same side of the center line
C)Six or more consecutive points moving in the same direction (an upward or downward trend)
D)Fourteen points in a row,alternating up and down
A)One or more points outside the control limits
B)Seven or more consecutive points that all fall on the same side of the center line
C)Six or more consecutive points moving in the same direction (an upward or downward trend)
D)Fourteen points in a row,alternating up and down
فتح الحزمة
افتح القفل للوصول البطاقات البالغ عددها 43 في هذه المجموعة.
فتح الحزمة
k this deck
24
A company that fills soft drinks into bottles has established an -chart and an R-chart to monitor the average fill level in the bottles.To do this,the company has taken a series of samples of size n = 4 bottles.The overall average fill is 12.03 ounces.The average range for the subgroups has been .06 ounces.Suppose,after developing the control chart,a subgroup of size 4 yields a sample mean of 12.09 ounces and a range of .08,which of the following statements is true?
A)The process is in control on both the
-chart and the R-chart.
B)The process is out of control on the R-chart but in control on the
-chart.
C)The process is out of control on the
-chart but in control on the R-chart.
D)The process is out of control on both the
-chart and an R-chart to monitor the average fill level in the bottles.To do this,the company has taken a series of samples of size n = 4 bottles.The overall average fill is 12.03 ounces.The average range for the subgroups has been .06 ounces.Suppose,after developing the control chart,a subgroup of size 4 yields a sample mean of 12.09 ounces and a range of .08,which of the following statements is true?A)The process is in control on both the
-chart and the R-chart.
B)The process is out of control on the R-chart but in control on the
-chart.
C)The process is out of control on the
-chart but in control on the R-chart.
D)The process is out of control on both the
فتح الحزمة
افتح القفل للوصول البطاقات البالغ عددها 43 في هذه المجموعة.
فتح الحزمة
k this deck
25
The control limits in a control chart can be interpreted to mean:
A)any value falling outside the limits is a defect and the product should be discarded.
B)the range of virtually all special cause variation.
C)any value falling within the limits means the product is high quality.
D)the range of virtually all common cause variation.
A)any value falling outside the limits is a defect and the product should be discarded.
B)the range of virtually all special cause variation.
C)any value falling within the limits means the product is high quality.
D)the range of virtually all common cause variation.
فتح الحزمة
افتح القفل للوصول البطاقات البالغ عددها 43 في هذه المجموعة.
فتح الحزمة
k this deck
26
Which of the following is not a type of commonly used process control chart?
A)x-bar chart
B)R-chart
C)p-chart
D)n-chart
A)x-bar chart
B)R-chart
C)p-chart
D)n-chart
فتح الحزمة
افتح القفل للوصول البطاقات البالغ عددها 43 في هذه المجموعة.
فتح الحزمة
k this deck
27
Each evening,a nationwide retail chain randomly calls 100 of the customers who came to their store that day to ask whether they were satisfied with the service they had received.The customers respond yes or no.Suppose the company has found over time that 8 percent of the customers are not satisfied ("no" answers),what is the 3-sigma upper and lower control limits for the appropriate control chart?
A)About .053 and .107
B)0 to about .16
C)-.0.14 to about .16
D)About -1.96 to 1.96
A)About .053 and .107
B)0 to about .16
C)-.0.14 to about .16
D)About -1.96 to 1.96
فتح الحزمة
افتح القفل للوصول البطاقات البالغ عددها 43 في هذه المجموعة.
فتح الحزمة
k this deck
28
Which one of the following is not a source of variation?
A)People
B)Measurement
C)Materials
D)Control
A)People
B)Measurement
C)Materials
D)Control
فتح الحزمة
افتح القفل للوصول البطاقات البالغ عددها 43 في هذه المجموعة.
فتح الحزمة
k this deck
29
The main process change that can be detected with a process control chart is:
A)the process average has shifted up or down from normal.
B)the process average is trending up or down from normal.
C)the process is behaving in such a manner that the existing variation is not random in nature.
D)All of the above
A)the process average has shifted up or down from normal.
B)the process average is trending up or down from normal.
C)the process is behaving in such a manner that the existing variation is not random in nature.
D)All of the above
فتح الحزمة
افتح القفل للوصول البطاقات البالغ عددها 43 في هذه المجموعة.
فتح الحزمة
k this deck
30
Referring to the SPC chart signals that a process is out of control,what type of problem does each signal indicate? List the signals.
فتح الحزمة
افتح القفل للوصول البطاقات البالغ عددها 43 في هذه المجموعة.
فتح الحزمة
k this deck
31
A company that fills soft drinks into bottles wishes to establish an -chart to monitor the average fill level in the bottles.To do this,the company has taken a series of samples of size n = 4 bottles.The overall average fill is 12.03 ounces.The average range for the subgroups has been .06 ounces.Based on this information,what is the upper limit of the 3-sigma control limit?
A).729
B).0437
C)12.09
D)12.074
-chart to monitor the average fill level in the bottles.To do this,the company has taken a series of samples of size n = 4 bottles.The overall average fill is 12.03 ounces.The average range for the subgroups has been .06 ounces.Based on this information,what is the upper limit of the 3-sigma control limit?A).729
B).0437
C)12.09
D)12.074
فتح الحزمة
افتح القفل للوصول البطاقات البالغ عددها 43 في هذه المجموعة.
فتح الحزمة
k this deck
32
Which of the following is not among the most common sources of variation?
A)People
B)Materials
C)Methods
D)Quotas
A)People
B)Materials
C)Methods
D)Quotas
فتح الحزمة
افتح القفل للوصول البطاقات البالغ عددها 43 في هذه المجموعة.
فتح الحزمة
k this deck
33
Statistical Process Control charts are used to detect whether a process remains in control or whether it has gone out of control.Explain how the SPC signals work.
فتح الحزمة
افتح القفل للوصول البطاقات البالغ عددها 43 في هذه المجموعة.
فتح الحزمة
k this deck
34
A plywood manufacturer is interested in monitoring the thickness of the plywood.Which of the following would be most useful for doing this?
A)p-charts
B)c-charts
C)
-charts
D)Histograms
A)p-charts
B)c-charts
C)
-charts
D)Histograms
فتح الحزمة
افتح القفل للوصول البطاقات البالغ عددها 43 في هذه المجموعة.
فتح الحزمة
k this deck
35
The statistical process control (SPC)chart is one of the most important tools for identifying important issues to improve quality.
فتح الحزمة
افتح القفل للوصول البطاقات البالغ عددها 43 في هذه المجموعة.
فتح الحزمة
k this deck
36
A p-chart is useful for:
A)analyzing whether a process for a measurable variable is in or out of control.
B)analyzing processes which yield attribute data.
C)determining what the most likely cause of defects is.
D)All of the above
A)analyzing whether a process for a measurable variable is in or out of control.
B)analyzing processes which yield attribute data.
C)determining what the most likely cause of defects is.
D)All of the above
فتح الحزمة
افتح القفل للوصول البطاقات البالغ عددها 43 في هذه المجموعة.
فتح الحزمة
k this deck
37
Because variations are unavoidable in a system,the output of the system is always unpredictable.
فتح الحزمة
افتح القفل للوصول البطاقات البالغ عددها 43 في هذه المجموعة.
فتح الحزمة
k this deck
38
Each evening,a nationwide retail chain randomly calls 100 of the customers who came to their store that day to ask whether they were satisfied with the service they had received.The customers respond yes or no.Suppose the company has found over time that 8 percent of the customers are not satisfied ("no" answers).If they have established a process control chart,what conclusion should be reached if the percentage of customers surveyed tonight that say no is 14 percent?
A)This result indicates that a special cause situation exists.
B)Although this point is above the upper control limit,there is no cause for alarm if this is the first time.
C)While this value is higher than "normal," it is still within the range of common cause variation and no action is needed.
D)This is outside the control limits and action should be taken
فتح الحزمة
افتح القفل للوصول البطاقات البالغ عددها 43 في هذه المجموعة.
فتح الحزمة
k this deck
39
Which of the following statements is correct?
A)A process can be in statistical control,yet it can be producing defects in abundance.
B)At least three points outside the upper or lower control limits on a control chart are required before the process is deemed to be out of control.
C)If a process is out of control,then the variation that is present is limited to common cause variation.
D)When special cause variation is present,the process can be expected to be in control.
فتح الحزمة
افتح القفل للوصول البطاقات البالغ عددها 43 في هذه المجموعة.
فتح الحزمة
k this deck
40
Recently a shipping company took 30 samples,each of size n = 100,of packages that it was responsible for delivering.Out of the 3,000 total packages,300 were delivered late.In setting up an appropriate process control chart,what would be the correct 3-sigma upper control limit value?
A)0.03
B)0.13
C)0.19
D)0.07
A)0.03
B)0.13
C)0.19
D)0.07
فتح الحزمة
افتح القفل للوصول البطاقات البالغ عددها 43 في هذه المجموعة.
فتح الحزمة
k this deck
41
A major airline is interested in monitoring customer satisfaction with its baggage handling process.To do so,each day the airline randomly selects 100 customers and surveys them to determine if they are satisfied or not with the service provided.After 20 samples,a total of 260 unsatisfied customers were surveyed.
a.If the airline wishes to use a control chart,which chart would you recommend and why?
b.Determine the 3-sigma control limits for the appropriate control chart.
a.If the airline wishes to use a control chart,which chart would you recommend and why?
b.Determine the 3-sigma control limits for the appropriate control chart.
فتح الحزمة
افتح القفل للوصول البطاقات البالغ عددها 43 في هذه المجموعة.
فتح الحزمة
k this deck
42
A tire company is interested in monitoring the process that produced tread thickness on its tires.Every hour 4 tires are selected from production and the tread thickness is measured.Data for the past 25 days is shown as follows: a.What type of control chart would you recommend be used in this case?
b.Compute the upper and lower control limits for these data.
a.What type of control chart would you recommend be used in this case?b.Compute the upper and lower control limits for these data.
فتح الحزمة
افتح القفل للوصول البطاقات البالغ عددها 43 في هذه المجموعة.
فتح الحزمة
k this deck
43
Explain the relationship between control limits and specification limits.
فتح الحزمة
افتح القفل للوصول البطاقات البالغ عددها 43 في هذه المجموعة.
فتح الحزمة
k this deck
فتح الحزمة
افتح القفل للوصول البطاقات البالغ عددها 43 في هذه المجموعة.


