Deck 6: The Sources of Growth and the Solow Model
ملء الشاشة (f)
سؤال
سؤال
سؤال
سؤال
سؤال
سؤال
سؤال
سؤال
سؤال
سؤال
سؤال
سؤال
سؤال
سؤال
سؤال
سؤال
سؤال
سؤال
سؤال
سؤال
سؤال
سؤال
سؤال
سؤال
سؤال
سؤال
سؤال
Output per worker 
= 4
1/3,the saving rate is 30 percent,and the depreciation rate is 0.133.Calculate the steady-state values of capital per worker and consumption per worker.
= 4
1/3,the saving rate is 30 percent,and the depreciation rate is 0.133.Calculate the steady-state values of capital per worker and consumption per worker.
سؤال
سؤال
سؤال
سؤال
سؤال
سؤال
Solow Diagram 
On the diagram above,show the quantity of consumption per worker in equilibrium.If the actual capital per worker were greater than k*,would consumption be higher or lower than it is in equilibrium? Describe what would happen in an economy with such a high level of capital per worker.
On the diagram above,show the quantity of consumption per worker in equilibrium.If the actual capital per worker were greater than k*,would consumption be higher or lower than it is in equilibrium? Describe what would happen in an economy with such a high level of capital per worker.
سؤال
سؤال
سؤال
سؤال
سؤال
سؤال
Solow Diagram 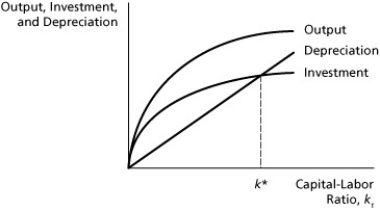
On the diagram above,show the new steady-state capital-labor ratio that results from a decrease in the saving rate.Can you say what has happened to the equilibrium level of consumption per worker?
On the diagram above,show the new steady-state capital-labor ratio that results from a decrease in the saving rate.Can you say what has happened to the equilibrium level of consumption per worker?
سؤال
سؤال
سؤال
سؤال
سؤال
سؤال
سؤال
سؤال
سؤال
سؤال
سؤال
سؤال
سؤال
سؤال
سؤال
سؤال
سؤال
Solow Diagram 
The diagram above shows a steady state with a constant quantity of labor.Show on the graph how the steady state is determined if the labor force is growing at some constant rate.On the graph,show how to measure the change in consumption per worker that results from growth of the labor force.
The diagram above shows a steady state with a constant quantity of labor.Show on the graph how the steady state is determined if the labor force is growing at some constant rate.On the graph,show how to measure the change in consumption per worker that results from growth of the labor force.
سؤال
سؤال
سؤال
سؤال
Consumption per worker is 72,depreciation is 12.5%,and capital per worker is 64.Given the production function y = 20 
,show that this economy is in a steady state.If the saving rate should double,what is the new steady-state level of consumption per worker?
,show that this economy is in a steady state.If the saving rate should double,what is the new steady-state level of consumption per worker?
سؤال
سؤال
Figure 6.1 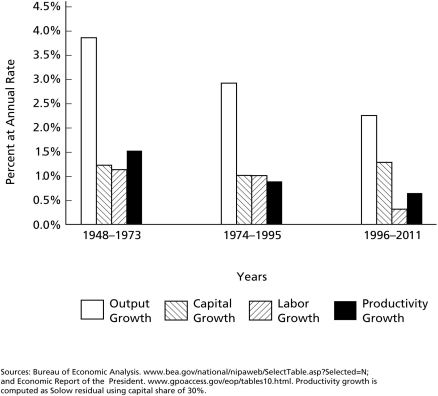
According to Figure 6.1,the average annual rate of growth of the U.S.economy in the period 1996-2011 equalled ________.
A)0.3 percent
B)2.2 percent
C)30 percent
D)300 percent
According to Figure 6.1,the average annual rate of growth of the U.S.economy in the period 1996-2011 equalled ________.
A)0.3 percent
B)2.2 percent
C)30 percent
D)300 percent
سؤال
سؤال
سؤال
Figure 6.1
According to Figure 6.1,the period from 1996 to 2011 is particularly remarkable for the slow growth of ________.
A)productivity
B)labor input
C)output
D)capital input
According to Figure 6.1,the period from 1996 to 2011 is particularly remarkable for the slow growth of ________.
A)productivity
B)labor input
C)output
D)capital input
سؤال
سؤال
Figure 6.1
According to Figure 6.1,the period from 1996 to 2011 is particularly remarkable for the rapid growth of ________.
A)productivity
B)labor input
C)output
D)capital input
According to Figure 6.1,the period from 1996 to 2011 is particularly remarkable for the rapid growth of ________.
A)productivity
B)labor input
C)output
D)capital input
سؤال
Figure 6.1
According to Figure 6.1,in postwar U.S history ________.
A)productivity growth was always exceeded by labor growth
B)labor growth has always exceeded capital growth
C)productivity growth has always exceeded capital growth
D)output growth has always exceeded productivity growth
According to Figure 6.1,in postwar U.S history ________.
A)productivity growth was always exceeded by labor growth
B)labor growth has always exceeded capital growth
C)productivity growth has always exceeded capital growth
D)output growth has always exceeded productivity growth
سؤال
Figure 6.1
According to Figure 6.1,the period from 1974 to 1995 is particularly remarkable for the slow growth of ________.
A)output per worker
B)labor input
C)output
D)capital input
According to Figure 6.1,the period from 1974 to 1995 is particularly remarkable for the slow growth of ________.
A)output per worker
B)labor input
C)output
D)capital input
سؤال
سؤال
سؤال
سؤال
Figure 6.1
According to Figure 6.1,the average annual rate of growth of the U.S.economy in the period 1948-73 equalled ________.
A)1.8 percent
B)4.0 percent
C)39 percent
D)697 percent
According to Figure 6.1,the average annual rate of growth of the U.S.economy in the period 1948-73 equalled ________.
A)1.8 percent
B)4.0 percent
C)39 percent
D)697 percent
سؤال
سؤال
سؤال
سؤال
سؤال
سؤال
سؤال

فتح الحزمة
قم بالتسجيل لفتح البطاقات في هذه المجموعة!
Unlock Deck
Unlock Deck
1/88
العب
ملء الشاشة (f)
Deck 6: The Sources of Growth and the Solow Model
1
If depreciation is equal to investment ________.
A)capital per-worker rises over time
B)capital per-worker is stable
C)capital per-worker falls over time
D)capital per worker equals saving
A)capital per-worker rises over time
B)capital per-worker is stable
C)capital per-worker falls over time
D)capital per worker equals saving
capital per-worker is stable
2
In the past 50 years,per capita income in some countries such as ________ and ________ has hardly changed relative to per capita income in the United States.
A)Mexico;Argentina
B)Kenya;Nigeria
C)South Korea;India
D)France;United Kingdom
A)Mexico;Argentina
B)Kenya;Nigeria
C)South Korea;India
D)France;United Kingdom
Mexico;Argentina
3
If an economy invests more than it loses through depreciation ________.
A)the saving rate will fall
B)the saving rate will rise
C)the quantity of labor will fall
D)the capital stock will expand
A)the saving rate will fall
B)the saving rate will rise
C)the quantity of labor will fall
D)the capital stock will expand
the capital stock will expand
4
The loss of capital due to the wearing out of machines is known as ________.
A)saving
B)investment
C)consumption
D)depreciation
A)saving
B)investment
C)consumption
D)depreciation
فتح الحزمة
افتح القفل للوصول البطاقات البالغ عددها 88 في هذه المجموعة.
فتح الحزمة
k this deck
5
If depreciation is less than investment ________.
A)capital per-worker is falling
B)capital per-worker is rising
C)capital per-worker is constant
D)capital per worker is greater than saving
A)capital per-worker is falling
B)capital per-worker is rising
C)capital per-worker is constant
D)capital per worker is greater than saving
فتح الحزمة
افتح القفل للوصول البطاقات البالغ عددها 88 في هذه المجموعة.
فتح الحزمة
k this deck
6
The economic growth of the United States over the last half-century ________.
A)is best understood as the result of high levels of saving and investment
B)is quite unlike the experience of most other economies
C)was driven by rising import purchases
D)has been faster than in any other economy
A)is best understood as the result of high levels of saving and investment
B)is quite unlike the experience of most other economies
C)was driven by rising import purchases
D)has been faster than in any other economy
فتح الحزمة
افتح القفل للوصول البطاقات البالغ عددها 88 في هذه المجموعة.
فتح الحزمة
k this deck
7
The per-worker production function is ________.
A)upward-sloping
B)downward-sloping
C)vertical
D)horizontal
A)upward-sloping
B)downward-sloping
C)vertical
D)horizontal
فتح الحزمة
افتح القفل للوصول البطاقات البالغ عددها 88 في هذه المجموعة.
فتح الحزمة
k this deck
8
The positive slope of the per-worker production function illustrates the relationship between per-worker output and ________.
A)diminishing marginal returns
B)the capital-labor ratio
C)the rate of inflation
D)the rate of unemployment
A)diminishing marginal returns
B)the capital-labor ratio
C)the rate of inflation
D)the rate of unemployment
فتح الحزمة
افتح القفل للوصول البطاقات البالغ عددها 88 في هذه المجموعة.
فتح الحزمة
k this deck
9
Changes in the capital stock are caused by changes in ________.
A)the quantity of labor
B)depreciation and investment
C)depreciation and entrepreneurship
D)depreciation and the quantity of labor
A)the quantity of labor
B)depreciation and investment
C)depreciation and entrepreneurship
D)depreciation and the quantity of labor
فتح الحزمة
افتح القفل للوصول البطاقات البالغ عددها 88 في هذه المجموعة.
فتح الحزمة
k this deck
10
In a closed economy ________.
A)investment equals consumption
B)investment equals savings
C)saving equals consumption
D)exports are greater than imports
A)investment equals consumption
B)investment equals savings
C)saving equals consumption
D)exports are greater than imports
فتح الحزمة
افتح القفل للوصول البطاقات البالغ عددها 88 في هذه المجموعة.
فتح الحزمة
k this deck
11
The per-worker production function flattens out due to ________.
A)the negative relationship between price and quantity demanded
B)the positive relationship between price and quantity demanded
C)the diminishing marginal product of capital
D)an increase in the general level of prices
A)the negative relationship between price and quantity demanded
B)the positive relationship between price and quantity demanded
C)the diminishing marginal product of capital
D)an increase in the general level of prices
فتح الحزمة
افتح القفل للوصول البطاقات البالغ عددها 88 في هذه المجموعة.
فتح الحزمة
k this deck
12
In the Solow model,which of the following is an endogenous variable?
A)output per worker
B)government spending
C)the saving rate
D)the depreciation rate
A)output per worker
B)government spending
C)the saving rate
D)the depreciation rate
فتح الحزمة
افتح القفل للوصول البطاقات البالغ عددها 88 في هذه المجموعة.
فتح الحزمة
k this deck
13
If capital per-worker is rising,then ________.
A)depreciation is equal to investment
B)depreciation is greater than investment
C)depreciation is less than investment
D)depreciation is less than consumption
A)depreciation is equal to investment
B)depreciation is greater than investment
C)depreciation is less than investment
D)depreciation is less than consumption
فتح الحزمة
افتح القفل للوصول البطاقات البالغ عددها 88 في هذه المجموعة.
فتح الحزمة
k this deck
14
In the bathtub analogy,which of the following is a stock variable?
A)the amount of investment
B)the rate of depreciation
C)the amount of capital-per worker
D)the Cobb-Douglass value
A)the amount of investment
B)the rate of depreciation
C)the amount of capital-per worker
D)the Cobb-Douglass value
فتح الحزمة
افتح القفل للوصول البطاقات البالغ عددها 88 في هذه المجموعة.
فتح الحزمة
k this deck
15
The Solow model is ________.
A)the basic model of how technology changes over time
B)the foundation for the classical economic thought of Adam Smith
C)one of the dominant explanations of the business cycle
D)based on the notion of diminishing marginal product of capital and labor
A)the basic model of how technology changes over time
B)the foundation for the classical economic thought of Adam Smith
C)one of the dominant explanations of the business cycle
D)based on the notion of diminishing marginal product of capital and labor
فتح الحزمة
افتح القفل للوصول البطاقات البالغ عددها 88 في هذه المجموعة.
فتح الحزمة
k this deck
16
Countries with different initial levels of per capita income may gravitate to a similar level of per capita income.Economists call this phenomenon ________.
A)convergence
B)simulation
C)gravitation
D)depreciation
A)convergence
B)simulation
C)gravitation
D)depreciation
فتح الحزمة
افتح القفل للوصول البطاقات البالغ عددها 88 في هذه المجموعة.
فتح الحزمة
k this deck
17
With a closed economy and no government spending,the total demand for output is equal to ________.
A)consumption per-worker plus investment per-worker
B)consumption per-worker minus investment per-worker
C)consumption per-worker times investment per-worker
D)consumption per worker divided by investment per-worker
A)consumption per-worker plus investment per-worker
B)consumption per-worker minus investment per-worker
C)consumption per-worker times investment per-worker
D)consumption per worker divided by investment per-worker
فتح الحزمة
افتح القفل للوصول البطاقات البالغ عددها 88 في هذه المجموعة.
فتح الحزمة
k this deck
18
In the Solow model,which of the following is an exogenous variable?
A)productivity
B)the capital-labor ratio
C)consumption per worker
D)investment per worker
A)productivity
B)the capital-labor ratio
C)consumption per worker
D)investment per worker
فتح الحزمة
افتح القفل للوصول البطاقات البالغ عددها 88 في هذه المجموعة.
فتح الحزمة
k this deck
19
If investment per-worker equals some value X,and depreciation per-worker equals some value Z,then the change in the capital stock per-worker is equal to ________.
A)X+Z
B)X-Z
C)X times Z
D)X divided by Z
A)X+Z
B)X-Z
C)X times Z
D)X divided by Z
فتح الحزمة
افتح القفل للوصول البطاقات البالغ عددها 88 في هذه المجموعة.
فتح الحزمة
k this deck
20
The economic growth of the United States over the last half-century ________.
A)is best understood as the result of high levels of saving and investment
B)is quite similar to the experience of most other economies
C)was driven by rising import purchases
D)has been slower than growth in several other economies
A)is best understood as the result of high levels of saving and investment
B)is quite similar to the experience of most other economies
C)was driven by rising import purchases
D)has been slower than growth in several other economies
فتح الحزمة
افتح القفل للوصول البطاقات البالغ عددها 88 في هذه المجموعة.
فتح الحزمة
k this deck
21
In a steady-state economy with no population growth,capital per worker is 86,the saving rate is 25 percent,and the depreciation rate is 11 percent.The level of output per worker is ________.
A)195
B)38
C)35
D)47
A)195
B)38
C)35
D)47
فتح الحزمة
افتح القفل للوصول البطاقات البالغ عددها 88 في هذه المجموعة.
فتح الحزمة
k this deck
22
In a steady-state economy with no population growth,consumption per worker is 45,the saving rate is 25 percent,and the depreciation rate is 15 percent.The level of capital per worker is ________.
A)75
B)36
C)100
D)27
A)75
B)36
C)100
D)27
فتح الحزمة
افتح القفل للوصول البطاقات البالغ عددها 88 في هذه المجموعة.
فتح الحزمة
k this deck
23
If an economy initially starts away from the steady state ________.
A)output will gradually fall over time
B)the economy will converge to the steady state in the long-run
C)consumption spending must be greater than investment spending
D)consumption spending must rise
A)output will gradually fall over time
B)the economy will converge to the steady state in the long-run
C)consumption spending must be greater than investment spending
D)consumption spending must rise
فتح الحزمة
افتح القفل للوصول البطاقات البالغ عددها 88 في هذه المجموعة.
فتح الحزمة
k this deck
24
Which of the following had the highest rate of growth during the period 1948-72?
A)West Germany
B)Vietnam
C)Japan
D)The United States of America
A)West Germany
B)Vietnam
C)Japan
D)The United States of America
فتح الحزمة
افتح القفل للوصول البطاقات البالغ عددها 88 في هذه المجموعة.
فتح الحزمة
k this deck
25
Suppose an economy is in a steady state,then its saving rate falls,once and permanently.As the economy approaches its new long-run steady state,consumption per worker is ________.
A)falling
B)rising
C)unaffected
D)either rising or falling
A)falling
B)rising
C)unaffected
D)either rising or falling
فتح الحزمة
افتح القفل للوصول البطاقات البالغ عددها 88 في هذه المجموعة.
فتح الحزمة
k this deck
26
Within rich economies,there is strong evidence of convergence ________.
A)for regions within a country
B)with developing economies
C)leading to military conflict
D)of capital stocks,rather than output
A)for regions within a country
B)with developing economies
C)leading to military conflict
D)of capital stocks,rather than output
فتح الحزمة
افتح القفل للوصول البطاقات البالغ عددها 88 في هذه المجموعة.
فتح الحزمة
k this deck
27
Output per worker
= 4
1/3,the saving rate is 30 percent,and the depreciation rate is 0.133.Calculate the steady-state values of capital per worker and consumption per worker.
= 4
1/3,the saving rate is 30 percent,and the depreciation rate is 0.133.Calculate the steady-state values of capital per worker and consumption per worker.
فتح الحزمة
افتح القفل للوصول البطاقات البالغ عددها 88 في هذه المجموعة.
فتح الحزمة
k this deck
28
Strong evidence of convergence exists for ________.
A)wealthy nations that belong to the Organization for Economic Cooperation and Development
B)both rich and poor nations
C)sub-Saharan African economies and the economies of North America
D)European and Caribbean economies
A)wealthy nations that belong to the Organization for Economic Cooperation and Development
B)both rich and poor nations
C)sub-Saharan African economies and the economies of North America
D)European and Caribbean economies
فتح الحزمة
افتح القفل للوصول البطاقات البالغ عددها 88 في هذه المجموعة.
فتح الحزمة
k this deck
29
A higher rate of saving at the national level will,in the long-run ________.
A)cause a decrease in levels of capital and output
B)have no effect on levels of capital and output
C)lead to an increase in population growth
D)cause an increase in levels of capital and output
A)cause a decrease in levels of capital and output
B)have no effect on levels of capital and output
C)lead to an increase in population growth
D)cause an increase in levels of capital and output
فتح الحزمة
افتح القفل للوصول البطاقات البالغ عددها 88 في هذه المجموعة.
فتح الحزمة
k this deck
30
The Solow model suggests that economies with the same aggregate production function,ratio of workers to the total population and saving rates will ________.
A)trade with one another
B)start with different initial levels of per capita income
C)possess the same rate of depreciation
D)experience convergence
A)trade with one another
B)start with different initial levels of per capita income
C)possess the same rate of depreciation
D)experience convergence
فتح الحزمة
افتح القفل للوصول البطاقات البالغ عددها 88 في هذه المجموعة.
فتح الحزمة
k this deck
31
International evidence on the relationship of per capita income and the saving rate suggests that ________.
A)a high level of income per person requires a high saving rate
B)a high saving rate guarantees a high level of income per person
C)a high saving rate might result in a high level of income per person
D)a high saving rate requires a high level of income per person
A)a high level of income per person requires a high saving rate
B)a high saving rate guarantees a high level of income per person
C)a high saving rate might result in a high level of income per person
D)a high saving rate requires a high level of income per person
فتح الحزمة
افتح القفل للوصول البطاقات البالغ عددها 88 في هذه المجموعة.
فتح الحزمة
k this deck
32
An increase in the saving rate results in a higher steady state ________.
A)growth rate of capital
B)growth rate of output per worker
C)level of consumption per worker
D)level of capital per worker
A)growth rate of capital
B)growth rate of output per worker
C)level of consumption per worker
D)level of capital per worker
فتح الحزمة
افتح القفل للوصول البطاقات البالغ عددها 88 في هذه المجموعة.
فتح الحزمة
k this deck
33
Solow Diagram
On the diagram above,show the quantity of consumption per worker in equilibrium.If the actual capital per worker were greater than k*,would consumption be higher or lower than it is in equilibrium? Describe what would happen in an economy with such a high level of capital per worker.
On the diagram above,show the quantity of consumption per worker in equilibrium.If the actual capital per worker were greater than k*,would consumption be higher or lower than it is in equilibrium? Describe what would happen in an economy with such a high level of capital per worker.
فتح الحزمة
افتح القفل للوصول البطاقات البالغ عددها 88 في هذه المجموعة.
فتح الحزمة
k this deck
34
Following an increase in the saving rate,consumption per worker ________.
A)increases
B)decreases
C)is unaffected
D)may either rise or fall
A)increases
B)decreases
C)is unaffected
D)may either rise or fall
فتح الحزمة
افتح القفل للوصول البطاقات البالغ عددها 88 في هذه المجموعة.
فتح الحزمة
k this deck
35
In a steady-state economy with no population growth,output per worker is 35,the saving rate is 20 percent,and the depreciation rate is 11 percent.The level of capital per worker is ________.
A)64
B)19
C)39
D)28
A)64
B)19
C)39
D)28
فتح الحزمة
افتح القفل للوصول البطاقات البالغ عددها 88 في هذه المجموعة.
فتح الحزمة
k this deck
36
Evidence that convergence occurs within economies is drawn in part from the example of ________.
A)Hiroshima and Nagasaki Japan
B)North and South Korea
C)West and East Germany during the Cold War
D)Hong Kong and Singapore
A)Hiroshima and Nagasaki Japan
B)North and South Korea
C)West and East Germany during the Cold War
D)Hong Kong and Singapore
فتح الحزمة
افتح القفل للوصول البطاقات البالغ عددها 88 في هذه المجموعة.
فتح الحزمة
k this deck
37
In the Solow model,the faster growth of output that results from an increase in the saving rate is temporary,because ________.
A)of diminishing marginal product of capital
B)with a larger stock of capital,consumption is encouraged more than investment
C)the rising capital stock depreciates at a faster rate
D)the economy settles into a steady state in which saving no longer rises
A)of diminishing marginal product of capital
B)with a larger stock of capital,consumption is encouraged more than investment
C)the rising capital stock depreciates at a faster rate
D)the economy settles into a steady state in which saving no longer rises
فتح الحزمة
افتح القفل للوصول البطاقات البالغ عددها 88 في هذه المجموعة.
فتح الحزمة
k this deck
38
On the Solow Diagram,an increase in the saving rate is shown by ________.
A)an upward shift of the depreciation line
B)an upward shift of the investment function
C)an upward shift of the per-worker production function
D)a downward shift of the investment function
A)an upward shift of the depreciation line
B)an upward shift of the investment function
C)an upward shift of the per-worker production function
D)a downward shift of the investment function
فتح الحزمة
افتح القفل للوصول البطاقات البالغ عددها 88 في هذه المجموعة.
فتح الحزمة
k this deck
39
Solow Diagram
On the diagram above,show the new steady-state capital-labor ratio that results from a decrease in the saving rate.Can you say what has happened to the equilibrium level of consumption per worker?
On the diagram above,show the new steady-state capital-labor ratio that results from a decrease in the saving rate.Can you say what has happened to the equilibrium level of consumption per worker?
فتح الحزمة
افتح القفل للوصول البطاقات البالغ عددها 88 في هذه المجموعة.
فتح الحزمة
k this deck
40
In the typical bathtub,the flow of water into the tub is controlled by a faucet independently of the quantity of water in the tub.How is the bathtub analogy of the steady state in the Solow model different? How does this difference relate to the phenomenon of convergence?
فتح الحزمة
افتح القفل للوصول البطاقات البالغ عددها 88 في هذه المجموعة.
فتح الحزمة
k this deck
41
A One-Child Policy was instituted in 1979 in ________.
A)Brazil
B)South Africa
C)India
D)China
A)Brazil
B)South Africa
C)India
D)China
فتح الحزمة
افتح القفل للوصول البطاقات البالغ عددها 88 في هذه المجموعة.
فتح الحزمة
k this deck
42
On the Solow Diagram,an increase in population growth is shown by ________.
A)an upward shift of the depreciation plus capital dilution line
B)an upward shift of the investment function
C)an upward shift of the per-worker production function
D)a downward shift of the investment function
A)an upward shift of the depreciation plus capital dilution line
B)an upward shift of the investment function
C)an upward shift of the per-worker production function
D)a downward shift of the investment function
فتح الحزمة
افتح القفل للوصول البطاقات البالغ عددها 88 في هذه المجموعة.
فتح الحزمة
k this deck
43
Other things the same,in the Solow model in the steady state,a higher rate of population growth ________ growth rate of output.
A)leads to a higher
B)leads to a lower
C)has no long-run effect on the
D)has an ambiguous effect on the
A)leads to a higher
B)leads to a lower
C)has no long-run effect on the
D)has an ambiguous effect on the
فتح الحزمة
افتح القفل للوصول البطاقات البالغ عددها 88 في هذه المجموعة.
فتح الحزمة
k this deck
44
Comparing steady states,which of the following is a result of a permanent increase in the saving rate,but is not a consequence of a one-time increase in productivity?
A)an increase in consumption per worker
B)a decrease in the marginal product of capital
C)an increase in output per worker
D)an increase in the growth rate of output
A)an increase in consumption per worker
B)a decrease in the marginal product of capital
C)an increase in output per worker
D)an increase in the growth rate of output
فتح الحزمة
افتح القفل للوصول البطاقات البالغ عددها 88 في هذه المجموعة.
فتح الحزمة
k this deck
45
If output per worker in a steady state is $30,000,depreciation is 13%,the population growth rate is two percent,and the saving rate is 20%,what is the steady state capital-labor ratio?
A)$10,500
B)$85,714
C)$22,500
D)$40,000
A)$10,500
B)$85,714
C)$22,500
D)$40,000
فتح الحزمة
افتح القفل للوصول البطاقات البالغ عددها 88 في هذه المجموعة.
فتح الحزمة
k this deck
46
The Solow model implies that continuous growth in productivity at a rate of one percent will result in continuous growth of output per worker at a rate of 1.43%.Thus,if at a point in time output per worker is 270 and productivity rises by one percent,the resulting level of output per worker is ________.
A)386
B)273
C)274
D)277
A)386
B)273
C)274
D)277
فتح الحزمة
افتح القفل للوصول البطاقات البالغ عددها 88 في هذه المجموعة.
فتح الحزمة
k this deck
47
When an economy experiences a one-time increase in productivity,there is an immediate increase in ________.
A)the saving rate
B)the capital-labor ratio
C)the depreciation rate
D)consumption per worker
A)the saving rate
B)the capital-labor ratio
C)the depreciation rate
D)consumption per worker
فتح الحزمة
افتح القفل للوصول البطاقات البالغ عددها 88 في هذه المجموعة.
فتح الحزمة
k this deck
48
Other things the same,in the Solow model in the steady state,a higher rate of population growth ________ the level of output per worker.
A)leads to an increase in
B)has no long-run effect on
C)has an ambiguous effect on
D)leads to a decrease in
A)leads to an increase in
B)has no long-run effect on
C)has an ambiguous effect on
D)leads to a decrease in
فتح الحزمة
افتح القفل للوصول البطاقات البالغ عددها 88 في هذه المجموعة.
فتح الحزمة
k this deck
49
When an economy experiences a one-time increase in productivity,there is an increase in the long-run,steady state value of ________.
A)the growth rate of output
B)the depreciation rate
C)consumption per worker
D)the saving rate
A)the growth rate of output
B)the depreciation rate
C)consumption per worker
D)the saving rate
فتح الحزمة
افتح القفل للوصول البطاقات البالغ عددها 88 في هذه المجموعة.
فتح الحزمة
k this deck
50
"Capital dilution" refers to ________.
A)the flow of investment in the "bathtub model"
B)the depreciation of capital associated with an increase in the percentage of younger workers
C)the decline in the marginal product of capital that results from reliance on new,inexperienced workers
D)the decrease in capital per worker that is a direct consequence of an increase in the number of workers
فتح الحزمة
افتح القفل للوصول البطاقات البالغ عددها 88 في هذه المجموعة.
فتح الحزمة
k this deck
51
The impact of immigration on an economy's steady state capital-labor ratio is reduced to the extent that the immigrants tend to ________ than the native population.
A)save more
B)have higher fertility
C)have lower income
D)be younger
A)save more
B)have higher fertility
C)have lower income
D)be younger
فتح الحزمة
افتح القفل للوصول البطاقات البالغ عددها 88 في هذه المجموعة.
فتح الحزمة
k this deck
52
On the Solow Diagram,an increase in productivity is shown by ________.
A)an upward shift of the depreciation plus capital dilution line
B)an upward shift of the investment function
C)a downward shift of the depreciation plus capital dilution line
D)a downward shift of the investment function
A)an upward shift of the depreciation plus capital dilution line
B)an upward shift of the investment function
C)a downward shift of the depreciation plus capital dilution line
D)a downward shift of the investment function
فتح الحزمة
افتح القفل للوصول البطاقات البالغ عددها 88 في هذه المجموعة.
فتح الحزمة
k this deck
53
Other things the same,in the Solow model in the steady state,a higher rate of population growth ________ growth rate of output per worker.
A)leads to a higher
B)leads to a lower
C)has no long-run effect on the
D)has an ambiguous effect on the
A)leads to a higher
B)leads to a lower
C)has no long-run effect on the
D)has an ambiguous effect on the
فتح الحزمة
افتح القفل للوصول البطاقات البالغ عددها 88 في هذه المجموعة.
فتح الحزمة
k this deck
54
According to the Solow model,a benefit of policies to limit population growth might be ________.
A)that smaller families are more likely to contribute to technological advances
B)that smaller families have better access to birth control methods and devices
C)that smaller families might provide each person a larger share of national income
D)that smaller families have less need to save,and so enjoy higher consumption
فتح الحزمة
افتح القفل للوصول البطاقات البالغ عددها 88 في هذه المجموعة.
فتح الحزمة
k this deck
55
Evidence of a negative correlation between income per capita and population growth rates ________.
A)implies that birth control is most effective in low-income countries
B)has not been found in the available data
C)is consistent with the Solow model
D)suggests that population growth stimulates technological progress
A)implies that birth control is most effective in low-income countries
B)has not been found in the available data
C)is consistent with the Solow model
D)suggests that population growth stimulates technological progress
فتح الحزمة
افتح القفل للوصول البطاقات البالغ عددها 88 في هذه المجموعة.
فتح الحزمة
k this deck
56
Solow Diagram
The diagram above shows a steady state with a constant quantity of labor.Show on the graph how the steady state is determined if the labor force is growing at some constant rate.On the graph,show how to measure the change in consumption per worker that results from growth of the labor force.
The diagram above shows a steady state with a constant quantity of labor.Show on the graph how the steady state is determined if the labor force is growing at some constant rate.On the graph,show how to measure the change in consumption per worker that results from growth of the labor force.
فتح الحزمة
افتح القفل للوصول البطاقات البالغ عددها 88 في هذه المجموعة.
فتح الحزمة
k this deck
57
If productivity is growing at some sustained rate g,then output and capital per worker ________.
A)are growing at the same rate g,in a stable steady state
B)are growing faster than g,because improving technology encourages a higher rate of saving and investment
C)are growing slower than g,because some of the new capital is merely replacing obsolete capital
D)are growing faster than g,because productivity does not suffer from diminishing marginal product
فتح الحزمة
افتح القفل للوصول البطاقات البالغ عددها 88 في هذه المجموعة.
فتح الحزمة
k this deck
58
Output per worker is 50,the saving rate is 15 percent,the population is growing at one percent,depreciation is 9 percent,and the capital-labor ratio is 80.Consumption per worker is ________.
A)37.5
B)falling
C)75
D)68
A)37.5
B)falling
C)75
D)68
فتح الحزمة
افتح القفل للوصول البطاقات البالغ عددها 88 في هذه المجموعة.
فتح الحزمة
k this deck
59
Population growth is similar to depreciation,in that ________.
A)each lowers the capital-labor ratio
B)each tends to encourage saving
C)capital wears out faster when used by more workers
D)each helps to explain how economies can sustain a positive growth rate of output
A)each lowers the capital-labor ratio
B)each tends to encourage saving
C)capital wears out faster when used by more workers
D)each helps to explain how economies can sustain a positive growth rate of output
فتح الحزمة
افتح القفل للوصول البطاقات البالغ عددها 88 في هذه المجموعة.
فتح الحزمة
k this deck
60
Consumption per worker is 72,depreciation is 12.5%,and capital per worker is 64.Given the production function y = 20
,show that this economy is in a steady state.If the saving rate should double,what is the new steady-state level of consumption per worker?
,show that this economy is in a steady state.If the saving rate should double,what is the new steady-state level of consumption per worker?
فتح الحزمة
افتح القفل للوصول البطاقات البالغ عددها 88 في هذه المجموعة.
فتح الحزمة
k this deck
61
If productivity growth equals 3.0 percent,the contribution from capital growth 1.2 percent and the contribution from labor growth 2.0 percent,then output growth must equal ________.
A)2.2 percent
B)4.2 percent
C)6.2 percent
D)7.2 percent
A)2.2 percent
B)4.2 percent
C)6.2 percent
D)7.2 percent
فتح الحزمة
افتح القفل للوصول البطاقات البالغ عددها 88 في هذه المجموعة.
فتح الحزمة
k this deck
62
Figure 6.1
According to Figure 6.1,the average annual rate of growth of the U.S.economy in the period 1996-2011 equalled ________.
A)0.3 percent
B)2.2 percent
C)30 percent
D)300 percent
According to Figure 6.1,the average annual rate of growth of the U.S.economy in the period 1996-2011 equalled ________.
A)0.3 percent
B)2.2 percent
C)30 percent
D)300 percent
فتح الحزمة
افتح القفل للوصول البطاقات البالغ عددها 88 في هذه المجموعة.
فتح الحزمة
k this deck
63
In theory,differences in output across economies and over time might be the result of differences in either capital input,labor input,or productivity.The evidence points clearly to productivity as a more likely and powerful source of growth differences.Which aspects of the Solow growth model help to explain why the inputs of capital and labor contribute little to growth of output,relative to productivity?
فتح الحزمة
افتح القفل للوصول البطاقات البالغ عددها 88 في هذه المجموعة.
فتح الحزمة
k this deck
64
There are no questions for this section.
6.7 Sources of Economic Growth: Growth Accounting
6.7 Sources of Economic Growth: Growth Accounting
فتح الحزمة
افتح القفل للوصول البطاقات البالغ عددها 88 في هذه المجموعة.
فتح الحزمة
k this deck
65
Figure 6.1
According to Figure 6.1,the period from 1996 to 2011 is particularly remarkable for the slow growth of ________.
A)productivity
B)labor input
C)output
D)capital input
According to Figure 6.1,the period from 1996 to 2011 is particularly remarkable for the slow growth of ________.
A)productivity
B)labor input
C)output
D)capital input
فتح الحزمة
افتح القفل للوصول البطاقات البالغ عددها 88 في هذه المجموعة.
فتح الحزمة
k this deck
66
A major contribution of the Solow model is its ________.
A)insight into what distinguishes rich economies from poor economies
B)explanation of why productivity grows over time
C)demonstration that the key to sustained growth is a high level of saving
D)encouragement of policies to limit population growth
A)insight into what distinguishes rich economies from poor economies
B)explanation of why productivity grows over time
C)demonstration that the key to sustained growth is a high level of saving
D)encouragement of policies to limit population growth
فتح الحزمة
افتح القفل للوصول البطاقات البالغ عددها 88 في هذه المجموعة.
فتح الحزمة
k this deck
67
Figure 6.1
According to Figure 6.1,the period from 1996 to 2011 is particularly remarkable for the rapid growth of ________.
A)productivity
B)labor input
C)output
D)capital input
According to Figure 6.1,the period from 1996 to 2011 is particularly remarkable for the rapid growth of ________.
A)productivity
B)labor input
C)output
D)capital input
فتح الحزمة
افتح القفل للوصول البطاقات البالغ عددها 88 في هذه المجموعة.
فتح الحزمة
k this deck
68
Figure 6.1
According to Figure 6.1,in postwar U.S history ________.
A)productivity growth was always exceeded by labor growth
B)labor growth has always exceeded capital growth
C)productivity growth has always exceeded capital growth
D)output growth has always exceeded productivity growth
According to Figure 6.1,in postwar U.S history ________.
A)productivity growth was always exceeded by labor growth
B)labor growth has always exceeded capital growth
C)productivity growth has always exceeded capital growth
D)output growth has always exceeded productivity growth
فتح الحزمة
افتح القفل للوصول البطاقات البالغ عددها 88 في هذه المجموعة.
فتح الحزمة
k this deck
69
Figure 6.1
According to Figure 6.1,the period from 1974 to 1995 is particularly remarkable for the slow growth of ________.
A)output per worker
B)labor input
C)output
D)capital input
According to Figure 6.1,the period from 1974 to 1995 is particularly remarkable for the slow growth of ________.
A)output per worker
B)labor input
C)output
D)capital input
فتح الحزمة
افتح القفل للوصول البطاقات البالغ عددها 88 في هذه المجموعة.
فتح الحزمة
k this deck
70
Economic growth ________.
A)is driven by different elements in different economies
B)is driven primarily by digital technology
C)is driven primarily by labor growth
D)cannot be explained using economic models
A)is driven by different elements in different economies
B)is driven primarily by digital technology
C)is driven primarily by labor growth
D)cannot be explained using economic models
فتح الحزمة
افتح القفل للوصول البطاقات البالغ عددها 88 في هذه المجموعة.
فتح الحزمة
k this deck
71
National output is a function of ________.
A)capital and saving
B)technology,employment and demand
C)labor and depreciation
D)labor,technology and capital
A)capital and saving
B)technology,employment and demand
C)labor and depreciation
D)labor,technology and capital
فتح الحزمة
افتح القفل للوصول البطاقات البالغ عددها 88 في هذه المجموعة.
فتح الحزمة
k this deck
72
The growth accounting equation suggests that the growth rate of output is equal to the growth rate of ________.
A)total factor productivity plus the contributions of both capital and labor
B)total factor productivity minus the rate of depreciation
C)capital and labor
D)the overall population
A)total factor productivity plus the contributions of both capital and labor
B)total factor productivity minus the rate of depreciation
C)capital and labor
D)the overall population
فتح الحزمة
افتح القفل للوصول البطاقات البالغ عددها 88 في هذه المجموعة.
فتح الحزمة
k this deck
73
Figure 6.1
According to Figure 6.1,the average annual rate of growth of the U.S.economy in the period 1948-73 equalled ________.
A)1.8 percent
B)4.0 percent
C)39 percent
D)697 percent
According to Figure 6.1,the average annual rate of growth of the U.S.economy in the period 1948-73 equalled ________.
A)1.8 percent
B)4.0 percent
C)39 percent
D)697 percent
فتح الحزمة
افتح القفل للوصول البطاقات البالغ عددها 88 في هذه المجموعة.
فتح الحزمة
k this deck
74
Productivity is ________.
A)determined by central bank policy
B)the combined effect of monetary and fiscal policy
C)the residual component of the production function
D)driven by changes in the rate of growth of output
A)determined by central bank policy
B)the combined effect of monetary and fiscal policy
C)the residual component of the production function
D)driven by changes in the rate of growth of output
فتح الحزمة
افتح القفل للوصول البطاقات البالغ عددها 88 في هذه المجموعة.
فتح الحزمة
k this deck
75
Capital and labor are distinct from productivity in that ________.
A)productivity is independent of technology changes
B)productivity can only increase over time
C)productivity is subject to diminishing returns
D)capital and labor are subject to diminishing marginal returns
A)productivity is independent of technology changes
B)productivity can only increase over time
C)productivity is subject to diminishing returns
D)capital and labor are subject to diminishing marginal returns
فتح الحزمة
افتح القفل للوصول البطاقات البالغ عددها 88 في هذه المجموعة.
فتح الحزمة
k this deck
76
Which of the following is the most difficult to measure? Changes in ________.
A)the size of the labor force
B)population
C)the quantity of labor
D)productivity
A)the size of the labor force
B)population
C)the quantity of labor
D)productivity
فتح الحزمة
افتح القفل للوصول البطاقات البالغ عددها 88 في هذه المجموعة.
فتح الحزمة
k this deck
77
The slowdown in U.S.economic growth in the period 1974-95 was primarily caused by ________.
A)falling labor growth
B)falling capital growth
C)falling productivity growth
D)none of the above
A)falling labor growth
B)falling capital growth
C)falling productivity growth
D)none of the above
فتح الحزمة
افتح القفل للوصول البطاقات البالغ عددها 88 في هذه المجموعة.
فتح الحزمة
k this deck
78
Productivity growth can be measured ________.
A)by dividing output by Kt0.3 Lt0.7
B)by adding the contributions from capital growth and labor growth
C)by subtracting the contributions from capital growth and labor growth from the growth of output
D)by dividing the growth of output by the contributions from capital growth and labor growth
A)by dividing output by Kt0.3 Lt0.7
B)by adding the contributions from capital growth and labor growth
C)by subtracting the contributions from capital growth and labor growth from the growth of output
D)by dividing the growth of output by the contributions from capital growth and labor growth
فتح الحزمة
افتح القفل للوصول البطاقات البالغ عددها 88 في هذه المجموعة.
فتح الحزمة
k this deck
79
If the contribution from capital and labor growth in a given economy equals 4.0 percent and output growth equals 6.4 percent over that same period of time,then productivity growth must equal ________.
A)25.6 percent
B)10.4 percent
C)2.4 percent
D)1.6 percent
A)25.6 percent
B)10.4 percent
C)2.4 percent
D)1.6 percent
فتح الحزمة
افتح القفل للوصول البطاقات البالغ عددها 88 في هذه المجموعة.
فتح الحزمة
k this deck
80
The highest rate of U.S.growth was recorded in which of the following periods?
A)1948-73
B)1967-83
C)1974-95
D)1996-2008
A)1948-73
B)1967-83
C)1974-95
D)1996-2008
فتح الحزمة
افتح القفل للوصول البطاقات البالغ عددها 88 في هذه المجموعة.
فتح الحزمة
k this deck
فتح الحزمة
افتح القفل للوصول البطاقات البالغ عددها 88 في هذه المجموعة.


