Deck 9: Quality Control and Improvement
ملء الشاشة (f)
سؤال
سؤال
سؤال
سؤال
سؤال
سؤال
سؤال
سؤال
سؤال
سؤال
سؤال
سؤال
سؤال
A process for filling liquid laundry detergent bottles monitors the volume in each bottle.The operations manager has taken 5 samples with 4 observations (bottles)in each sample to determine if the variation in volume is reasonable.The measurement unit is fluid ounces.Calculate the center line for a process control chart that indicates whether the variation within samples is reasonable (in a state of control). 
A) >1.0.
B) Between 0 and 1.0.
C) Less than 0.
D) There is not enough information to determine the correct response.
A) >1.0.
B) Between 0 and 1.0.
C) Less than 0.
D) There is not enough information to determine the correct response.
سؤال
سؤال
The figure shown below represents a control chart determined from attribute data.Given this chart and the plotted observations,the most appropriate action would be 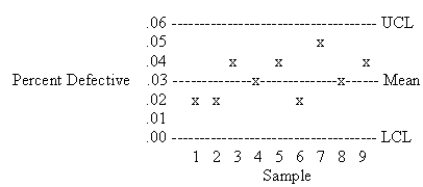
A) take immediate action to identify potential causes of the variation.
B) decrease the confidence interval for the control chart.
C) do nothing because the process appears to be operating in control.
D) increase the confidence interval for the control chart.
A) take immediate action to identify potential causes of the variation.
B) decrease the confidence interval for the control chart.
C) do nothing because the process appears to be operating in control.
D) increase the confidence interval for the control chart.
سؤال
سؤال
سؤال
سؤال
سؤال
سؤال
سؤال
سؤال
سؤال
سؤال
سؤال
سؤال
سؤال
سؤال
سؤال
سؤال
A manufacturer of television wall mounts would like to make a chart to monitor the percentage of defective mounting brackets due to problems with drilled holes.These holes may be defective because they are off-center,out of round,or not drilled.Five samples,each of size 100,have been taken from the production process and the discrepancies are as follows: 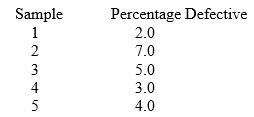 Using this information and a 3 standard deviation chart,the upper control limit is
A) 0.0025.
B) 0.0420.
C) 0.0602.
D) 0.102.
Using this information and a 3 standard deviation chart,the upper control limit isA) 0.0025.
B) 0.0420.
C) 0.0602.
D) 0.102.
سؤال
سؤال
سؤال
سؤال
سؤال
سؤال
سؤال
سؤال
The work of 20 claims processors is sampled and examined for errors.100 claims are randomly pulled for each processor with the results shown below.What is the upper limit of the control chart?
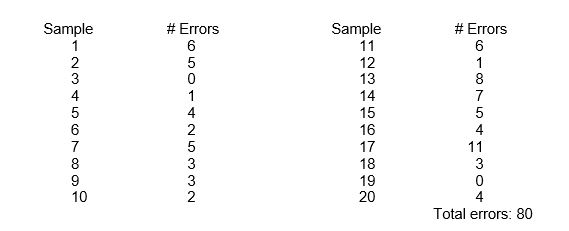
A) 0.059 (or 0.06).
B) 0.084 (or 0.08).
C) 0.099 (or 0.10).
D) None of the above.
A) 0.059 (or 0.06).
B) 0.084 (or 0.08).
C) 0.099 (or 0.10).
D) None of the above.
سؤال
سؤال
سؤال
سؤال
سؤال
سؤال
سؤال
سؤال
سؤال
سؤال
سؤال

فتح الحزمة
قم بالتسجيل لفتح البطاقات في هذه المجموعة!
Unlock Deck
Unlock Deck
1/50
العب
ملء الشاشة (f)
Deck 9: Quality Control and Improvement
1
Generally,two types of data may be collected from sampling at an inspection point.These two types of data are
A) variable and attribute data.
B) variable and conditional data.
C) constant and attribute data.
D) constant and conditional data.
A) variable and attribute data.
B) variable and conditional data.
C) constant and attribute data.
D) constant and conditional data.
variable and attribute data.
2
A Pareto diagram
A) shows causes and effects of quality problems.
B) shows the prevalence of the various types of defects that have been found.
C) is not useful when first studying a quality problem.
D) has both upper and lower specification limits.
A) shows causes and effects of quality problems.
B) shows the prevalence of the various types of defects that have been found.
C) is not useful when first studying a quality problem.
D) has both upper and lower specification limits.
shows the prevalence of the various types of defects that have been found.
3
The chair of the Quality Department at Motorola University wants to construct a p-chart for determining whether the four faculty members teaching the course are in a state of control concerning the number of students who fail in the course.Accordingly,the chair sampled 500 final grades from last year for each instructor,and computed the number of failures per instructor as 13,11,0,and 16 respectively.Compute the upper and lower standard control limits for this chart.
A) 0.9500 and 0.0500.
B) 0.0600 and 0.1400.
C) 0.0388 and 0.0012.
D) None of the above.
A) 0.9500 and 0.0500.
B) 0.0600 and 0.1400.
C) 0.0388 and 0.0012.
D) None of the above.
0.0388 and 0.0012.
4
A machining process is capable of producing a component with an average specification of 5 inches and a process standard deviation of 0.1 inch.Supposing the customer accepts the component as long as it falls between 4.8 inches and 5.2 inches,then the process capability is
A) 1.333.
B) 1.5.
C) 0.667.
D) 1.0.
A) 1.333.
B) 1.5.
C) 0.667.
D) 1.0.
فتح الحزمة
افتح القفل للوصول البطاقات البالغ عددها 50 في هذه المجموعة.
فتح الحزمة
k this deck
5
Which of the following quality control sample statistics indicates a quality characteristic that is an attribute?
A) Mean
B) Proportion
C) Variance
D) Standard deviation
A) Mean
B) Proportion
C) Variance
D) Standard deviation
فتح الحزمة
افتح القفل للوصول البطاقات البالغ عددها 50 في هذه المجموعة.
فتح الحزمة
k this deck
6
Which of the following is a critical inspection point where inspection and testing of products occur in a quality control system?
A) Just prior to an irreversible operation (such as drilling).
B) Just prior to a masking operation (an operation that may hide a defect, such as painting or plating).
C) Just prior to packaging and shipping a finished product.
D) All of the above.
A) Just prior to an irreversible operation (such as drilling).
B) Just prior to a masking operation (an operation that may hide a defect, such as painting or plating).
C) Just prior to packaging and shipping a finished product.
D) All of the above.
فتح الحزمة
افتح القفل للوصول البطاقات البالغ عددها 50 في هذه المجموعة.
فتح الحزمة
k this deck
7
Of the four choices below,which is the earliest step in designing a quality control system?
A) The amount of inspection to use.
B) Who should do the inspection.
C) The type of measurement to be used.
D) Training workers to perform inspection of their own work.
A) The amount of inspection to use.
B) Who should do the inspection.
C) The type of measurement to be used.
D) Training workers to perform inspection of their own work.
فتح الحزمة
افتح القفل للوصول البطاقات البالغ عددها 50 في هذه المجموعة.
فتح الحزمة
k this deck
8
Using the same data as in Question 10,what is the lower control limit for a p-chart?
A) .0750
B) .0191
C) .0000
D) .0692
A) .0750
B) .0191
C) .0000
D) .0692
فتح الحزمة
افتح القفل للوصول البطاقات البالغ عددها 50 في هذه المجموعة.
فتح الحزمة
k this deck
9
A cause-and-effect diagram
A) identifies common causes of quality defects .
B) is often used in conjunction with a Pareto chart.
C) is also called a fishbone diagram.
D) has all of the above features.
A) identifies common causes of quality defects .
B) is often used in conjunction with a Pareto chart.
C) is also called a fishbone diagram.
D) has all of the above features.
فتح الحزمة
افتح القفل للوصول البطاقات البالغ عددها 50 في هذه المجموعة.
فتح الحزمة
k this deck
10
Which of the following techniques are used for continuous improvement?
A) Pareto charts.
B) Cause-and-effect diagrams.
C) Process control charts.
D) All of the above
A) Pareto charts.
B) Cause-and-effect diagrams.
C) Process control charts.
D) All of the above
فتح الحزمة
افتح القفل للوصول البطاقات البالغ عددها 50 في هذه المجموعة.
فتح الحزمة
k this deck
11
Sampling inspection by attributes
A) means each item sampled is classified as defective or not defective based on quality standards.
B) could be used together with process control and variable measurement as part of a quality control system.
C) utilizes a discrete scale of measurement.
D) a, b, and c.
A) means each item sampled is classified as defective or not defective based on quality standards.
B) could be used together with process control and variable measurement as part of a quality control system.
C) utilizes a discrete scale of measurement.
D) a, b, and c.
فتح الحزمة
افتح القفل للوصول البطاقات البالغ عددها 50 في هذه المجموعة.
فتح الحزمة
k this deck
12
The ability of the process to meet,or exceed,its specifications can be determined by
A) Pareto charts.
B) cause-and-effect diagrams.
C) histograms.
D) Cp index.
A) Pareto charts.
B) cause-and-effect diagrams.
C) histograms.
D) Cp index.
فتح الحزمة
افتح القفل للوصول البطاقات البالغ عددها 50 في هذه المجموعة.
فتح الحزمة
k this deck
13
A process for filling liquid laundry detergent bottles monitors the volume in each bottle.The operations manager has taken 5 samples with 4 observations (bottles)in each sample to determine if the variation in volume is reasonable.The measurement unit is fluid ounces.Calculate the center line for a process control chart that indicates whether the variation within samples is reasonable (in a state of control).
A) >1.0.
B) Between 0 and 1.0.
C) Less than 0.
D) There is not enough information to determine the correct response.
A) >1.0.
B) Between 0 and 1.0.
C) Less than 0.
D) There is not enough information to determine the correct response.
فتح الحزمة
افتح القفل للوصول البطاقات البالغ عددها 50 في هذه المجموعة.
فتح الحزمة
k this deck
14
Which of the following statements about process capability is accurate?
A) Cpk is a better measure of process capability than Cp.
B) Cp is exactly equal to Cpk when the mean is centered in the specification limits.
C) Given the same process, Cpk is always less than or equal to Cp.
D) All of the above are accurate.
A) Cpk is a better measure of process capability than Cp.
B) Cp is exactly equal to Cpk when the mean is centered in the specification limits.
C) Given the same process, Cpk is always less than or equal to Cp.
D) All of the above are accurate.
فتح الحزمة
افتح القفل للوصول البطاقات البالغ عددها 50 في هذه المجموعة.
فتح الحزمة
k this deck
15
The figure shown below represents a control chart determined from attribute data.Given this chart and the plotted observations,the most appropriate action would be
A) take immediate action to identify potential causes of the variation.
B) decrease the confidence interval for the control chart.
C) do nothing because the process appears to be operating in control.
D) increase the confidence interval for the control chart.
A) take immediate action to identify potential causes of the variation.
B) decrease the confidence interval for the control chart.
C) do nothing because the process appears to be operating in control.
D) increase the confidence interval for the control chart.
فتح الحزمة
افتح القفل للوصول البطاقات البالغ عددها 50 في هذه المجموعة.
فتح الحزمة
k this deck
16
Suppose that you have taken 30 samples of 200 units each and calculated the proportion defective as p = .075.What is the upper control limit for a p-chart?
A) .2192
B) .0191
C) .1309
D) .7500
A) .2192
B) .0191
C) .1309
D) .7500
فتح الحزمة
افتح القفل للوصول البطاقات البالغ عددها 50 في هذه المجموعة.
فتح الحزمة
k this deck
17
Which of the following is/are assumption(s)of process control?
A) Random variability cannot be eliminated unless the process is redesigned.
B) Common causes represent random variability.
C) Production processes are not usually found in a state of control.
D) All of the above.
A) Random variability cannot be eliminated unless the process is redesigned.
B) Common causes represent random variability.
C) Production processes are not usually found in a state of control.
D) All of the above.
فتح الحزمة
افتح القفل للوصول البطاقات البالغ عددها 50 في هذه المجموعة.
فتح الحزمة
k this deck
18
Which of the following statements about process quality control is NOT true?
A) Assignable cause variation is also referred as special cause variation.
B) An observation outside the control limits is an example of a special cause of variation.
C) Common cause variation can be eliminated from the process by removing the potential causes.
D) The control limits will include 99.74% of the population under the normal probability distribution assuming that the process is in control.
فتح الحزمة
افتح القفل للوصول البطاقات البالغ عددها 50 في هذه المجموعة.
فتح الحزمة
k this deck
19
Regarding the design of a quality control system,which of the following statements is correct?
A) First, decide on the type of measurement required, then who will collect the data.
B) First, decide on the amount of inspection needed, then critical points and type of measurement needed.
C) First, decide who will be the inspector, then that person determines the critical points and collects the data.
D) Decide on the critical points first, then the type and amount of measurement needed.
فتح الحزمة
افتح القفل للوصول البطاقات البالغ عددها 50 في هذه المجموعة.
فتح الحزمة
k this deck
20
Suppose that a process is in a state of control and we have the following information for a human weights measurement study: Average weight of males in the study = 150 lbs.
Average range of the male weights = 100 lbs.
A2 = .577
D3 = 0
D4 = 2.115
What is the upper control limit for the average (mean)chart?
A) 207.7 lbs
B) 92.3 lbs
C) 361.5 lbs
D) 175 lbs
Average range of the male weights = 100 lbs.
A2 = .577
D3 = 0
D4 = 2.115
What is the upper control limit for the average (mean)chart?
A) 207.7 lbs
B) 92.3 lbs
C) 361.5 lbs
D) 175 lbs
فتح الحزمة
افتح القفل للوصول البطاقات البالغ عددها 50 في هذه المجموعة.
فتح الحزمة
k this deck
21
Which of the following statements is true?
A) For a variables control chart, n should be fairly large, frequently 50-300 observations.
B) For an attribute control chart, n is typically 5-10 observations, and rarely larger than 24.
C) For an attribute control chart, n should be large enough to include at least one defective unit.
D) None of the above.
فتح الحزمة
افتح القفل للوصول البطاقات البالغ عددها 50 في هذه المجموعة.
فتح الحزمة
k this deck
22
Range charts are used to evaluate
A) the variability of data within samples for variable data.
B) the variability of data within samples for attribute data.
C) the variability of data among (central tendency) samples.
D) the variability of process capability.
A) the variability of data within samples for variable data.
B) the variability of data within samples for attribute data.
C) the variability of data among (central tendency) samples.
D) the variability of process capability.
فتح الحزمة
افتح القفل للوصول البطاقات البالغ عددها 50 في هذه المجموعة.
فتح الحزمة
k this deck
23
Consider the following statements: (1)The primary focus of lean is to reduce waste.
(2)The primary focus of six sigma is to reduce defects.
A) Only statement (1) is correct.
B) Only statement (2) is correct.
C) Both statements are correct.
D) Neither statement is correct.
(2)The primary focus of six sigma is to reduce defects.
A) Only statement (1) is correct.
B) Only statement (2) is correct.
C) Both statements are correct.
D) Neither statement is correct.
فتح الحزمة
افتح القفل للوصول البطاقات البالغ عددها 50 في هذه المجموعة.
فتح الحزمة
k this deck
24
One of the first stages in any statistical process control program is to ascertain that the equipment utilized for an operation is inherently capable of producing within the design tolerance.For a particular lathe operation,run under controlled conditions so that no assignable causes of variation have been introduced,the outside diameter of each sampled part was measured,and the operator found that the standard deviation was 0.0075 centimeters (cm).What is the process capability if the upper specification limit is 7.508 cm and the lower specification limit is 7.388 cm?
A) 2.67
B) 1.00
C) 0.375
D) None of the above.
A) 2.67
B) 1.00
C) 0.375
D) None of the above.
فتح الحزمة
افتح القفل للوصول البطاقات البالغ عددها 50 في هذه المجموعة.
فتح الحزمة
k this deck
25
A production process delivers an unexpectedly large amount of scrap products.Top management has discovered that improper machine maintenance is the reason behind this failure.The above statement is an example of a special cause of variation.
فتح الحزمة
افتح القفل للوصول البطاقات البالغ عددها 50 في هذه المجموعة.
فتح الحزمة
k this deck
26
Which of the following is the best description of quality control?
A) The use of mass inspection in a process to ensure quality and meet customer requirements.
B) The continuous improvement of a process to better address customer needs.
C) The stabilization and maintenance of a process to produce consistent output.
D) Constancy of purpose toward improvement of the product or service.
فتح الحزمة
افتح القفل للوصول البطاقات البالغ عددها 50 في هذه المجموعة.
فتح الحزمة
k this deck
27
Which of the following statements is NOT correct?
A) Control limits represent the "voice of the process."
B) The average of the measurement data collected is the same as the center line.
C) Six sigma equates to 99.74% of output within the control limits.
D) A normal distribution of a process under control will include a very small amount outside the control limits.
فتح الحزمة
افتح القفل للوصول البطاقات البالغ عددها 50 في هذه المجموعة.
فتح الحزمة
k this deck
28
Which of the following is the best description of variables data?
A) Number of students more than six feet tall in a classroom.
B) Ratio of damaged apples to perfect apples in a shipment.
C) Downward force required to cause a critical part to fail during a quality test.
D) Adequate strength of adhesive applied between two components.
A) Number of students more than six feet tall in a classroom.
B) Ratio of damaged apples to perfect apples in a shipment.
C) Downward force required to cause a critical part to fail during a quality test.
D) Adequate strength of adhesive applied between two components.
فتح الحزمة
افتح القفل للوصول البطاقات البالغ عددها 50 في هذه المجموعة.
فتح الحزمة
k this deck
29
The seven tools of quality control include all of the following EXCEPT
A) flowcharts.
B) Pareto charts.
C) DMAIC charts.
D) scatter diagrams.
A) flowcharts.
B) Pareto charts.
C) DMAIC charts.
D) scatter diagrams.
فتح الحزمة
افتح القفل للوصول البطاقات البالغ عددها 50 في هذه المجموعة.
فتح الحزمة
k this deck
30
__________ are ideal for monitoring continuous data.
A) p-charts
B) x-bar and R-charts
C) Ishikawa charts
D) None of the above
A) p-charts
B) x-bar and R-charts
C) Ishikawa charts
D) None of the above
فتح الحزمة
افتح القفل للوصول البطاقات البالغ عددها 50 في هذه المجموعة.
فتح الحزمة
k this deck
31
A manufacturer of television wall mounts would like to make a chart to monitor the percentage of defective mounting brackets due to problems with drilled holes.These holes may be defective because they are off-center,out of round,or not drilled.Five samples,each of size 100,have been taken from the production process and the discrepancies are as follows: Using this information and a 3 standard deviation chart,the upper control limit is
A) 0.0025.
B) 0.0420.
C) 0.0602.
D) 0.102.
Using this information and a 3 standard deviation chart,the upper control limit isA) 0.0025.
B) 0.0420.
C) 0.0602.
D) 0.102.
فتح الحزمة
افتح القفل للوصول البطاقات البالغ عددها 50 في هذه المجموعة.
فتح الحزمة
k this deck
32
If the population of items produced does not meet or exceed the upper and low specification limits (all items produced are well within specification limits),the process capability index,Cp,will be
A) less than 0.0.
B) between 0.0 and 1.0.
C) equal to 1.0.
D) greater than 1.0.
A) less than 0.0.
B) between 0.0 and 1.0.
C) equal to 1.0.
D) greater than 1.0.
فتح الحزمة
افتح القفل للوصول البطاقات البالغ عددها 50 في هذه المجموعة.
فتح الحزمة
k this deck
33
Which statement best represents the key assumption(s)of process control?
A) Most processes are affected by common and special causes of variation.
B) It is easier to address common cause variation than special cause variation.
C) Most processes are found to be in control.
D) All of the above.
A) Most processes are affected by common and special causes of variation.
B) It is easier to address common cause variation than special cause variation.
C) Most processes are found to be in control.
D) All of the above.
فتح الحزمة
افتح القفل للوصول البطاقات البالغ عددها 50 في هذه المجموعة.
فتح الحزمة
k this deck
34
Attribute control occurs when the product characteristic is measured on a continuous scale.
فتح الحزمة
افتح القفل للوصول البطاقات البالغ عددها 50 في هذه المجموعة.
فتح الحزمة
k this deck
35
Put the following statements in the correct order: (1)Decide who should do the inspection.
(2)Decide on the type of measurement.
(3)Decide on the amount of inspection.
(4)Decide on the critical points requiring inspection.
A) 4, 1, 2, 3.
B) 4, 2, 3, 1.
C) 1, 2, 3, 4.
D) 2, 4, 1, 3.
(2)Decide on the type of measurement.
(3)Decide on the amount of inspection.
(4)Decide on the critical points requiring inspection.
A) 4, 1, 2, 3.
B) 4, 2, 3, 1.
C) 1, 2, 3, 4.
D) 2, 4, 1, 3.
فتح الحزمة
افتح القفل للوصول البطاقات البالغ عددها 50 في هذه المجموعة.
فتح الحزمة
k this deck
36
Which of the following makes the most sense,given today's view of quality control?
A) Full-time, certified inspectors are preferred for all critical control points.
B) The department receiving the inputs is the preferred location for the critical control point.
C) The person doing the job should have the responsibility of inspection.
D) The manager of the process should be inspecting quality at critical points.
فتح الحزمة
افتح القفل للوصول البطاقات البالغ عددها 50 في هذه المجموعة.
فتح الحزمة
k this deck
37
Which of the following statements about six sigma is NOT correct?
A) The six sigma approach is suited only for manufacturing processes.
B) Six sigma programs employ full-time specialists called black belts.
C) Six sigma employs a structured process improvement technique.
D) Data and metrics are vital in a six sigma approach.
A) The six sigma approach is suited only for manufacturing processes.
B) Six sigma programs employ full-time specialists called black belts.
C) Six sigma employs a structured process improvement technique.
D) Data and metrics are vital in a six sigma approach.
فتح الحزمة
افتح القفل للوصول البطاقات البالغ عددها 50 في هذه المجموعة.
فتح الحزمة
k this deck
38
A brewer bottles beer labeled "net weight 12 ounces." A production employee pulled 20 random samples of 5 bottles each throughout the day and found that the average weight is exactly 12 ounces and the average range of the samples is 0.25 ounce.What is the lower control limit for the averages chart for this process?
A) 12.144 ounces.
B) 11.955 ounces.
C) 11.856 ounces.
D) None of the above.
A) 12.144 ounces.
B) 11.955 ounces.
C) 11.856 ounces.
D) None of the above.
فتح الحزمة
افتح القفل للوصول البطاقات البالغ عددها 50 في هذه المجموعة.
فتح الحزمة
k this deck
39
The work of 20 claims processors is sampled and examined for errors.100 claims are randomly pulled for each processor with the results shown below.What is the upper limit of the control chart?
A) 0.059 (or 0.06).
B) 0.084 (or 0.08).
C) 0.099 (or 0.10).
D) None of the above.
A) 0.059 (or 0.06).
B) 0.084 (or 0.08).
C) 0.099 (or 0.10).
D) None of the above.
فتح الحزمة
افتح القفل للوصول البطاقات البالغ عددها 50 في هذه المجموعة.
فتح الحزمة
k this deck
40
Which of the following statements is NOT correct?
A) Six sigma projects require measurement of financial impact be closely tracked, compared to lean projects that do not insist on financial tracking.
B) Six sigma relies more on dedicated experts to guide projects as compared to lean.
C) Lean projects tend to be smaller and simpler compared to six sigma projects.
D) Lean projects tend to support strategic priorities more than is the case for six sigma projects.
فتح الحزمة
افتح القفل للوصول البطاقات البالغ عددها 50 في هذه المجموعة.
فتح الحزمة
k this deck
41
Name the seven tools of quality control typically used in process improvement.Could all of these tools be applied to service operations?
Suggest some possible service operations scenarios wherein we could apply all or some of these tools.
Suggest some possible service operations scenarios wherein we could apply all or some of these tools.
فتح الحزمة
افتح القفل للوصول البطاقات البالغ عددها 50 في هذه المجموعة.
فتح الحزمة
k this deck
42
The Cp measure requires the process to be centered for an accurate measure of process capability.
فتح الحزمة
افتح القفل للوصول البطاقات البالغ عددها 50 في هذه المجموعة.
فتح الحزمة
k this deck
43
List and explain the five steps of the DMAIC process.
فتح الحزمة
افتح القفل للوصول البطاقات البالغ عددها 50 في هذه المجموعة.
فتح الحزمة
k this deck
44
Surveys indicate that p charts are used more frequently than average (mean)and range charts are used.
فتح الحزمة
افتح القفل للوصول البطاقات البالغ عددها 50 في هذه المجموعة.
فتح الحزمة
k this deck
45
Lean is another term for six sigma process improvement.
فتح الحزمة
افتح القفل للوصول البطاقات البالغ عددها 50 في هذه المجموعة.
فتح الحزمة
k this deck
46
Lean projects are usually simpler than six sigma projects.
فتح الحزمة
افتح القفل للوصول البطاقات البالغ عددها 50 في هذه المجموعة.
فتح الحزمة
k this deck
47
Six sigma projects are typically managed by workers certified as black belts.
فتح الحزمة
افتح القفل للوصول البطاقات البالغ عددها 50 في هذه المجموعة.
فتح الحزمة
k this deck
48
In process capability analysis,the standard deviation ( )refers to the standard deviation of sample measures.
فتح الحزمة
افتح القفل للوصول البطاقات البالغ عددها 50 في هذه المجموعة.
فتح الحزمة
k this deck
49
The seven tools of quality control are equally applicable to both manufacturing and service industries.
فتح الحزمة
افتح القفل للوصول البطاقات البالغ عددها 50 في هذه المجموعة.
فتح الحزمة
k this deck
50
The quality tool that shows the relationship between two variables is a histogram.
فتح الحزمة
افتح القفل للوصول البطاقات البالغ عددها 50 في هذه المجموعة.
فتح الحزمة
k this deck
فتح الحزمة
افتح القفل للوصول البطاقات البالغ عددها 50 في هذه المجموعة.


