Deck 3: Summary Statistics
ملء الشاشة (f)
سؤال
سؤال
سؤال
Figure: 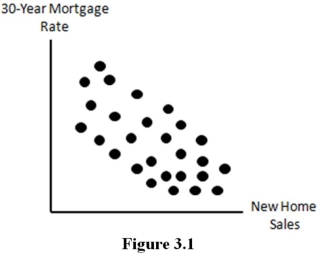
The scatter diagram in figure 3.1 suggests that ______ relationship likely exists between 30-year mortgage rates and new home sales.
A)a positive linear
B)a negative linear
C)a quadratic
D)no linear
The scatter diagram in figure 3.1 suggests that ______ relationship likely exists between 30-year mortgage rates and new home sales.
A)a positive linear
B)a negative linear
C)a quadratic
D)no linear
سؤال
سؤال
سؤال
Figure: 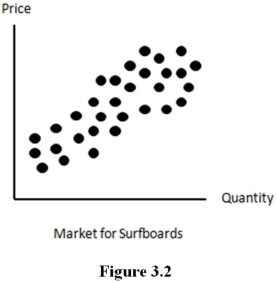
The scatter diagram in figure 3.2 suggests that _______ relationship likely exists between the price and quantity supplied of surfboards.
A)a positive linear
B)a negative linear
C)a quadratic
D)no linear
The scatter diagram in figure 3.2 suggests that _______ relationship likely exists between the price and quantity supplied of surfboards.
A)a positive linear
B)a negative linear
C)a quadratic
D)no linear
سؤال
سؤال
سؤال
سؤال
سؤال
سؤال
Figure: 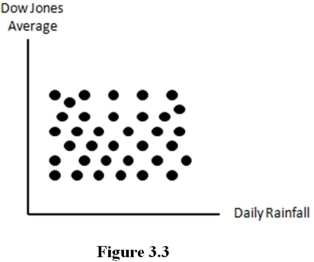
The scatter diagram in figure 3.3 suggests that ______ relationship likely exists between daily rainfall and the Dow Jones industrial average.
A)a positive linear
B)a negative linear
C)a quadratic
D)no linear
The scatter diagram in figure 3.3 suggests that ______ relationship likely exists between daily rainfall and the Dow Jones industrial average.
A)a positive linear
B)a negative linear
C)a quadratic
D)no linear
سؤال
سؤال
سؤال
سؤال
سؤال
سؤال
سؤال
سؤال
سؤال
سؤال
سؤال
سؤال
Suppose you have collected the data in Table 3.1. 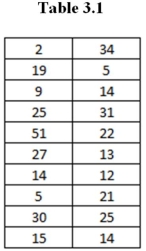
Calculate the mean,median,mode,variance,and standard deviation.Interpret these values.
Calculate the mean,median,mode,variance,and standard deviation.Interpret these values.
سؤال
سؤال
Suppose that you construct the histogram in Figure 3.4. 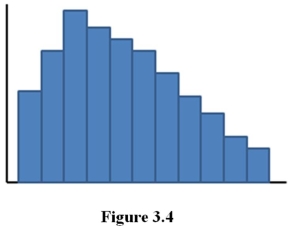
What conclusions would you draw about the data? Explain.
What conclusions would you draw about the data? Explain.
سؤال
سؤال
سؤال
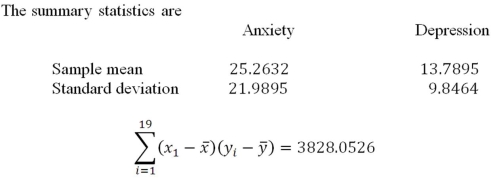
A counselor working with teenagers is interested in the relationship between anxiety and depression.The counselor administers a depression and anxiety test to each teenager.The scores obtained from the administration of the two inventories are given below. 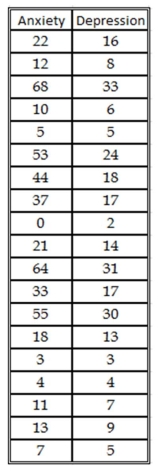
a.What do these data say about the level of anxiety and depression in these teenagers?
b.What is the correlation between anxiety and depression? What does this number tell you?
c.What is the correlation coefficient between anxiety and depression? What does this number tell you?
d.If you were counseling a teenager with high levels of anxiety,what would you expect their level of depression to be?

فتح الحزمة
قم بالتسجيل لفتح البطاقات في هذه المجموعة!
Unlock Deck
Unlock Deck
1/29
العب
ملء الشاشة (f)
Deck 3: Summary Statistics
1
Suppose that a data set contains 275 observations ranging from a low of 6,000 to a high of 70,000.What is the appropriate class width to use when constructing a histogram for the data?
A)6,400
B)7,112
C)7,778
D)8,000
A)6,400
B)7,112
C)7,778
D)8,000
B
2
The standard deviation of a distribution provides a sense of
A)how far data points tend to fall from the median.
B)where the central mass of the distribution lies.
C)how far data points tend to fall from the mean.
D)whether the distribution is skewed.
A)how far data points tend to fall from the median.
B)where the central mass of the distribution lies.
C)how far data points tend to fall from the mean.
D)whether the distribution is skewed.
C
3
Figure:
The scatter diagram in figure 3.1 suggests that ______ relationship likely exists between 30-year mortgage rates and new home sales.
A)a positive linear
B)a negative linear
C)a quadratic
D)no linear
The scatter diagram in figure 3.1 suggests that ______ relationship likely exists between 30-year mortgage rates and new home sales.
A)a positive linear
B)a negative linear
C)a quadratic
D)no linear
B
4
Suppose that a data set contains 275 observations ranging from a low of 6,000 to a high of 70,000.What is the appropriate number of classes to use when constructing a histogram for the data?
A)6
B)7
C)8
D)9
A)6
B)7
C)8
D)9
فتح الحزمة
افتح القفل للوصول البطاقات البالغ عددها 29 في هذه المجموعة.
فتح الحزمة
k this deck
5
An outlier is
A)a data point that falls more than two standard deviations away from the mean.
B)a data point that falls more than three standard deviations away from the mean.
C)a data point that exceeds the median.
D)a data point that falls below zero.
A)a data point that falls more than two standard deviations away from the mean.
B)a data point that falls more than three standard deviations away from the mean.
C)a data point that exceeds the median.
D)a data point that falls below zero.
فتح الحزمة
افتح القفل للوصول البطاقات البالغ عددها 29 في هذه المجموعة.
فتح الحزمة
k this deck
6
Figure:
The scatter diagram in figure 3.2 suggests that _______ relationship likely exists between the price and quantity supplied of surfboards.
A)a positive linear
B)a negative linear
C)a quadratic
D)no linear
The scatter diagram in figure 3.2 suggests that _______ relationship likely exists between the price and quantity supplied of surfboards.
A)a positive linear
B)a negative linear
C)a quadratic
D)no linear
فتح الحزمة
افتح القفل للوصول البطاقات البالغ عددها 29 في هذه المجموعة.
فتح الحزمة
k this deck
7
A data set is said to be skewed to the left if
A)an outlier falls more than three standard deviations below the sample mean.
B)an outlier falls more than three standard deviations above the sample mean.
C)an outlier falls more than three standard deviations below the sample median.
D)an outlier falls more than three standard deviations above the sample median.
فتح الحزمة
افتح القفل للوصول البطاقات البالغ عددها 29 في هذه المجموعة.
فتح الحزمة
k this deck
8
A smaller standard deviation of a distribution indicates that
A)the observations in a data set are closer together.
B)the observations in a data set are farther apart.
C)a smaller mean.
D)the mean and median are closer together.
A)the observations in a data set are closer together.
B)the observations in a data set are farther apart.
C)a smaller mean.
D)the mean and median are closer together.
فتح الحزمة
افتح القفل للوصول البطاقات البالغ عددها 29 في هذه المجموعة.
فتح الحزمة
k this deck
9
The standard deviation of a distribution is the
A)total distance that data points fall away from the mean.
B)sum of the distances that data points fall away from the mean.
C)variance of the data points in the distribution.
D)average distance that data points fall away from the mean.
A)total distance that data points fall away from the mean.
B)sum of the distances that data points fall away from the mean.
C)variance of the data points in the distribution.
D)average distance that data points fall away from the mean.
فتح الحزمة
افتح القفل للوصول البطاقات البالغ عددها 29 في هذه المجموعة.
فتح الحزمة
k this deck
10
When is the median most appropriate for summarizing a data set?
A)Always.
B)When the data set contains outliers.
C)When the data set is symmetric.
D)When the data are closely distributed to each other.
A)Always.
B)When the data set contains outliers.
C)When the data set is symmetric.
D)When the data are closely distributed to each other.
فتح الحزمة
افتح القفل للوصول البطاقات البالغ عددها 29 في هذه المجموعة.
فتح الحزمة
k this deck
11
The mean is the
A)middle number in an ordered data set.
B)most frequently observed value in a data set.
C)sum of the individual observation divided by the number of observations.
D)only relevant measure of central tendency.
A)middle number in an ordered data set.
B)most frequently observed value in a data set.
C)sum of the individual observation divided by the number of observations.
D)only relevant measure of central tendency.
فتح الحزمة
افتح القفل للوصول البطاقات البالغ عددها 29 في هذه المجموعة.
فتح الحزمة
k this deck
12
Figure:
The scatter diagram in figure 3.3 suggests that ______ relationship likely exists between daily rainfall and the Dow Jones industrial average.
A)a positive linear
B)a negative linear
C)a quadratic
D)no linear
The scatter diagram in figure 3.3 suggests that ______ relationship likely exists between daily rainfall and the Dow Jones industrial average.
A)a positive linear
B)a negative linear
C)a quadratic
D)no linear
فتح الحزمة
افتح القفل للوصول البطاقات البالغ عددها 29 في هذه المجموعة.
فتح الحزمة
k this deck
13
If a data set is skewed then
A)the mean is the most appropriate measure of central tendency.
B)the mean is the most appropriate measure of dispersion.
C)the median is the most appropriate measure of central tendency.
D)the median is the most appropriate measure of dispersion.
A)the mean is the most appropriate measure of central tendency.
B)the mean is the most appropriate measure of dispersion.
C)the median is the most appropriate measure of central tendency.
D)the median is the most appropriate measure of dispersion.
فتح الحزمة
افتح القفل للوصول البطاقات البالغ عددها 29 في هذه المجموعة.
فتح الحزمة
k this deck
14
An outlier that is much larger than the remaining values in a data set will cause the data set to be
A)skewed to the left.
B)skewed to the right.
C)symmetric.
D)unskewed.
A)skewed to the left.
B)skewed to the right.
C)symmetric.
D)unskewed.
فتح الحزمة
افتح القفل للوصول البطاقات البالغ عددها 29 في هذه المجموعة.
فتح الحزمة
k this deck
15
The median is the
A)middle number in an ordered data set.
B)most frequently observed value in a data set.
C)sum of the individual observation divided by the number of observations.
D)only relevant measure of central tendency.
A)middle number in an ordered data set.
B)most frequently observed value in a data set.
C)sum of the individual observation divided by the number of observations.
D)only relevant measure of central tendency.
فتح الحزمة
افتح القفل للوصول البطاقات البالغ عددها 29 في هذه المجموعة.
فتح الحزمة
k this deck
16
An outlier that is much smaller than the remaining values in a data set will cause the data set to be
A)skewed to the left.
B)skewed to the right.
C)symmetric.
D)unskewed.
A)skewed to the left.
B)skewed to the right.
C)symmetric.
D)unskewed.
فتح الحزمة
افتح القفل للوصول البطاقات البالغ عددها 29 في هذه المجموعة.
فتح الحزمة
k this deck
17
Relative frequency histograms are potentially valuable because they
A)provide a visual overview of the distribution of the data.
B)are often presented in media outlets.
C)show the mean,the median,and the mode of the sample.
D)are pretty to look at.
A)provide a visual overview of the distribution of the data.
B)are often presented in media outlets.
C)show the mean,the median,and the mode of the sample.
D)are pretty to look at.
فتح الحزمة
افتح القفل للوصول البطاقات البالغ عددها 29 في هذه المجموعة.
فتح الحزمة
k this deck
18
Identifying outliers is
A)important because data sets with outliers are best summarized by the sample mean.
B)never important.
C)important because data sets with outliers are often skewed.
D)important because outliers decrease the sample variance.
A)important because data sets with outliers are best summarized by the sample mean.
B)never important.
C)important because data sets with outliers are often skewed.
D)important because outliers decrease the sample variance.
فتح الحزمة
افتح القفل للوصول البطاقات البالغ عددها 29 في هذه المجموعة.
فتح الحزمة
k this deck
19
When is the mean most appropriate for summarizing a data set?
A)Always.
B)When the data set contains outliers.
C)When the data set is symmetric.
D)When the data are skewed to the right.
A)Always.
B)When the data set contains outliers.
C)When the data set is symmetric.
D)When the data are skewed to the right.
فتح الحزمة
افتح القفل للوصول البطاقات البالغ عددها 29 في هذه المجموعة.
فتح الحزمة
k this deck
20
A scatter diagram is potentially valuable because it
A)visually depicts the relationship between two variables.
B)visually depicts the median of the sample.
C)visually depicts the standard deviation of the sample.
D)visually depicts the distribution of a variable.
A)visually depicts the relationship between two variables.
B)visually depicts the median of the sample.
C)visually depicts the standard deviation of the sample.
D)visually depicts the distribution of a variable.
فتح الحزمة
افتح القفل للوصول البطاقات البالغ عددها 29 في هذه المجموعة.
فتح الحزمة
k this deck
21
The correlation coefficient is generally preferred to the covariance because
A)the correlation coefficient is a unit free measure of linear association.
B)the covariance is bounded to fall between -1 and 1.
C)the correlation coefficient must be positive.
D)the covariance measures the quadratic relationship between two random variables.
A)the correlation coefficient is a unit free measure of linear association.
B)the covariance is bounded to fall between -1 and 1.
C)the correlation coefficient must be positive.
D)the covariance measures the quadratic relationship between two random variables.
فتح الحزمة
افتح القفل للوصول البطاقات البالغ عددها 29 في هذه المجموعة.
فتح الحزمة
k this deck
22
a.If the correlation coefficient between two random variables equals zero,does that imply that there is no relationship between those random variables?
b.If the correlation coefficient between two random variables is close to one in absolute value,does that imply that one random variable causes another random variable?
b.If the correlation coefficient between two random variables is close to one in absolute value,does that imply that one random variable causes another random variable?
فتح الحزمة
افتح القفل للوصول البطاقات البالغ عددها 29 في هذه المجموعة.
فتح الحزمة
k this deck
23
The correlation coefficient is
A)must be positive.
B)the square root of the covariance.
C)must be negative.
D)must fall between -1 and 1.
A)must be positive.
B)the square root of the covariance.
C)must be negative.
D)must fall between -1 and 1.
فتح الحزمة
افتح القفل للوصول البطاقات البالغ عددها 29 في هذه المجموعة.
فتح الحزمة
k this deck
24
Suppose you have collected the data in Table 3.1.
Calculate the mean,median,mode,variance,and standard deviation.Interpret these values.
Calculate the mean,median,mode,variance,and standard deviation.Interpret these values.
فتح الحزمة
افتح القفل للوصول البطاقات البالغ عددها 29 في هذه المجموعة.
فتح الحزمة
k this deck
25
The covariance
A)measures the linear relationship between two random variables.
B)must fall between -1 and 1.
C)must be positive.
D)measures the quadratic relationship between two random variables.
A)measures the linear relationship between two random variables.
B)must fall between -1 and 1.
C)must be positive.
D)measures the quadratic relationship between two random variables.
فتح الحزمة
افتح القفل للوصول البطاقات البالغ عددها 29 في هذه المجموعة.
فتح الحزمة
k this deck
26
Suppose that you construct the histogram in Figure 3.4.
What conclusions would you draw about the data? Explain.
What conclusions would you draw about the data? Explain.
فتح الحزمة
افتح القفل للوصول البطاقات البالغ عددها 29 في هذه المجموعة.
فتح الحزمة
k this deck
27
In your own words,describe the potential benefits of constructing a histogram to summarize a given data set.
فتح الحزمة
افتح القفل للوصول البطاقات البالغ عددها 29 في هذه المجموعة.
فتح الحزمة
k this deck
28
List and describe the steps involved in constructing a histogram.
فتح الحزمة
افتح القفل للوصول البطاقات البالغ عددها 29 في هذه المجموعة.
فتح الحزمة
k this deck
29
A counselor working with teenagers is interested in the relationship between anxiety and depression.The counselor administers a depression and anxiety test to each teenager.The scores obtained from the administration of the two inventories are given below.
a.What do these data say about the level of anxiety and depression in these teenagers?
b.What is the correlation between anxiety and depression? What does this number tell you?
c.What is the correlation coefficient between anxiety and depression? What does this number tell you?
d.If you were counseling a teenager with high levels of anxiety,what would you expect their level of depression to be?
فتح الحزمة
افتح القفل للوصول البطاقات البالغ عددها 29 في هذه المجموعة.
فتح الحزمة
k this deck
فتح الحزمة
افتح القفل للوصول البطاقات البالغ عددها 29 في هذه المجموعة.


