Deck 5: Pearson Correlation and Regression: Descriptive Aspects
ملء الشاشة (f)
سؤال
سؤال
سؤال
سؤال
سؤال
سؤال
سؤال
سؤال
سؤال
سؤال
سؤال
سؤال
سؤال
سؤال
سؤال
سؤال
سؤال
سؤال
سؤال
سؤال
سؤال
سؤال
سؤال
سؤال
سؤال
سؤال
سؤال
سؤال
سؤال
سؤال
سؤال
سؤال
سؤال
سؤال
سؤال
سؤال
سؤال
سؤال
سؤال
سؤال
سؤال
سؤال
سؤال
سؤال
سؤال
سؤال
سؤال
سؤال
سؤال
سؤال
سؤال
سؤال
سؤال
سؤال
سؤال
سؤال
سؤال
سؤال
سؤال
سؤال
سؤال
سؤال
سؤال
سؤال
سؤال
سؤال
سؤال
Refer to the following data set. 
What is the correlation between X and Y?
A).09
B).92
C).80
D)-.80
What is the correlation between X and Y?
A).09
B).92
C).80
D)-.80
سؤال
Refer to the following data set. 
What is the sum of cross-products?
A)9
B)86
C)-222
D)47.5
What is the sum of cross-products?
A)9
B)86
C)-222
D)47.5
سؤال
سؤال
سؤال
Which type of relationship is graphed in the following scatterplot? 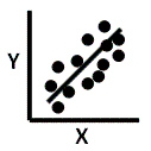
A)no relationship
B)positive curvilinear relationship
C)negative linear relationship
D)positive linear relationship
A)no relationship
B)positive curvilinear relationship
C)negative linear relationship
D)positive linear relationship
سؤال
Refer to the following data set. 
What is the slope of the regression line?
A)14
B)1.8
C)22
D)5
What is the slope of the regression line?
A)14
B)1.8
C)22
D)5
سؤال
سؤال
سؤال
سؤال
سؤال
سؤال
سؤال
Refer to the following data set. 
What is the intercept of the regression line?
A)3.5
B)5.5
C).8
D)-.80
What is the intercept of the regression line?
A)3.5
B)5.5
C).8
D)-.80
سؤال

فتح الحزمة
قم بالتسجيل لفتح البطاقات في هذه المجموعة!
Unlock Deck
Unlock Deck
1/152
العب
ملء الشاشة (f)
Deck 5: Pearson Correlation and Regression: Descriptive Aspects
1
The _____ of a line indicates the number of units variable Y changes as variable X changes by 1 unit.
A)slope
B)intercept
C)scatterplot
D)residual
A)slope
B)intercept
C)scatterplot
D)residual
slope
2
For a perfect positive linear relationship,the z scores for the X and Y variables will tend to have _____.
A)opposite signs
B)all negative signs
C)only positive signs
D)the same positive or negative signs
A)opposite signs
B)all negative signs
C)only positive signs
D)the same positive or negative signs
the same positive or negative signs
3
The general form of the linear model is _____.
A)Y = bX + aX
B)Y = a + bX
C)Y = b + a + X
D)Y = a + bX2
A)Y = bX + aX
B)Y = a + bX
C)Y = b + a + X
D)Y = a + bX2
Y = a + bX
4
The largest correlation coefficient that can be observed under any circumstance is _____.
A)100%
B) 1.00
C)+1.00
D)unlimited
A)100%
B) 1.00
C)+1.00
D)unlimited
فتح الحزمة
افتح القفل للوصول البطاقات البالغ عددها 152 في هذه المجموعة.
فتح الحزمة
k this deck
5
The sum of the cross products is a measure of _____.
A)covariation between two sets of scores
B)variability between the X mean and the Y mean
C)sum of the squares for variable y multiplied by x values
D)the determination coefficient
A)covariation between two sets of scores
B)variability between the X mean and the Y mean
C)sum of the squares for variable y multiplied by x values
D)the determination coefficient
فتح الحزمة
افتح القفل للوصول البطاقات البالغ عددها 152 في هذه المجموعة.
فتح الحزمة
k this deck
6
The Pearson correlation technique may be used to measure ______ relationships when both variables are ______ in nature.
A)curvilinear;qualitative
B)linear;qualitative
C)linear;quantitative
D)curvilinear;quantitative
A)curvilinear;qualitative
B)linear;qualitative
C)linear;quantitative
D)curvilinear;quantitative
فتح الحزمة
افتح القفل للوصول البطاقات البالغ عددها 152 في هذه المجموعة.
فتح الحزمة
k this deck
7
Which of the following correlation values represents the strongest relationship?
A).20
B)60
C)-.70
D).09
A).20
B)60
C)-.70
D).09
فتح الحزمة
افتح القفل للوصول البطاقات البالغ عددها 152 في هذه المجموعة.
فتح الحزمة
k this deck
8
The point at which a line intersects the Y axis when X = 0 is called the _____.
A)intercept
B)slope
C)abscissa
D)a and c
A)intercept
B)slope
C)abscissa
D)a and c
فتح الحزمة
افتح القفل للوصول البطاقات البالغ عددها 152 في هذه المجموعة.
فتح الحزمة
k this deck
9
If the values of the variables X and Y are directly related,then as a score in X _____ the value of a score in Y _____.
A)increase;increases
B)increases;decreases
C)decreases;increases
D)none of these
A)increase;increases
B)increases;decreases
C)decreases;increases
D)none of these
فتح الحزمة
افتح القفل للوصول البطاقات البالغ عددها 152 في هذه المجموعة.
فتح الحزمة
k this deck
10
When there is no linear relationship,the z scores on X will ______.
A)bear no relationship to the z scores on Y
B)vary in sign but not size with the z scores on Y
C)vary in size but not sign with the z scores on Y
D)none of these
A)bear no relationship to the z scores on Y
B)vary in sign but not size with the z scores on Y
C)vary in size but not sign with the z scores on Y
D)none of these
فتح الحزمة
افتح القفل للوصول البطاقات البالغ عددها 152 في هذه المجموعة.
فتح الحزمة
k this deck
11
If grade point average (GPA)and number of hours partying were related according to the following linear model: GPA= 4.00 - .40 Hours,what GPA would you predict if you partied for 8 hours?
A).80
B)2.20
C)1.00
D)3.60
A).80
B)2.20
C)1.00
D)3.60
فتح الحزمة
افتح القفل للوصول البطاقات البالغ عددها 152 في هذه المجموعة.
فتح الحزمة
k this deck
12
In the case of a _____ relationship,as scores on X increase,scores on Y also increase.
A)curvilinear
B)positive
C)negative
D)constant
A)curvilinear
B)positive
C)negative
D)constant
فتح الحزمة
افتح القفل للوصول البطاقات البالغ عددها 152 في هذه المجموعة.
فتح الحزمة
k this deck
13
If the value of variables X and Y are inversely related,then as a score on X ____ the value of a score on Y ____.
A)decreases;decreases
B)increases;increases
C)increases;decreases
D)none of these
A)decreases;decreases
B)increases;increases
C)increases;decreases
D)none of these
فتح الحزمة
افتح القفل للوصول البطاقات البالغ عددها 152 في هذه المجموعة.
فتح الحزمة
k this deck
14
In the case of a negative relationship,as scores on X _____,scores on Y _____.
A)increase;stay the same
B)decrease;stay the same
C)decrease;decrease
D)increase;decrease
A)increase;stay the same
B)decrease;stay the same
C)decrease;decrease
D)increase;decrease
فتح الحزمة
افتح القفل للوصول البطاقات البالغ عددها 152 في هذه المجموعة.
فتح الحزمة
k this deck
15
The Pearson correlation coefficient can range from _____.
A)0.0 to + 1.00
B)1.00 to 100.00
C)-1.00 to 1.00
D)0.0 to 8
A)0.0 to + 1.00
B)1.00 to 100.00
C)-1.00 to 1.00
D)0.0 to 8
فتح الحزمة
افتح القفل للوصول البطاقات البالغ عددها 152 في هذه المجموعة.
فتح الحزمة
k this deck
16
Research in the behavioral sciences is often concerned with _____ relationships.
A)qualified
B)unsystematic
C)linear
D)all of these
A)qualified
B)unsystematic
C)linear
D)all of these
فتح الحزمة
افتح القفل للوصول البطاقات البالغ عددها 152 في هذه المجموعة.
فتح الحزمة
k this deck
17
The Pearson correlation may be used to determine the _____.
A)relationship between two variables
B)variability between x and y scores
C)curvilinear relationship between x and y
D)predictive error between two scores
A)relationship between two variables
B)variability between x and y scores
C)curvilinear relationship between x and y
D)predictive error between two scores
فتح الحزمة
افتح القفل للوصول البطاقات البالغ عددها 152 في هذه المجموعة.
فتح الحزمة
k this deck
18
For a perfect negative linear relationship,the z scores for the Y and X variables will tend to have _____.
A)the same sign
B)all negative signs
C)opposite signs
D)an inconsistent pairing of signs
A)the same sign
B)all negative signs
C)opposite signs
D)an inconsistent pairing of signs
فتح الحزمة
افتح القفل للوصول البطاقات البالغ عددها 152 في هذه المجموعة.
فتح الحزمة
k this deck
19
A slope of _____ would be represented by a _____ line.
A)1.0;nonlinear
B)0;horizontal
C)-1.0;horizontal
D)1.0;horizontal
A)1.0;nonlinear
B)0;horizontal
C)-1.0;horizontal
D)1.0;horizontal
فتح الحزمة
افتح القفل للوصول البطاقات البالغ عددها 152 في هذه المجموعة.
فتح الحزمة
k this deck
20
Which of the following correlation scores represents the weakest relationship?
A).40
B).60
C)-.80
D).09
A).40
B).60
C)-.80
D).09
فتح الحزمة
افتح القفل للوصول البطاقات البالغ عددها 152 في هذه المجموعة.
فتح الحزمة
k this deck
21
The sum of the cross-products indicates the extent to which two sets of scores _____.
A)vary from their mean
B)vary from the grand mean
C)covary
D)depart from individual variation
A)vary from their mean
B)vary from the grand mean
C)covary
D)depart from individual variation
فتح الحزمة
افتح القفل للوصول البطاقات البالغ عددها 152 في هذه المجموعة.
فتح الحزمة
k this deck
22
Which of the following linear relationships describes a situation in which the value of one variable decreases as the value of the second variable also decreases?
A)-.66
B).42
C)1.10
D)-1.00
A)-.66
B).42
C)1.10
D)-1.00
فتح الحزمة
افتح القفل للوصول البطاقات البالغ عددها 152 في هذه المجموعة.
فتح الحزمة
k this deck
23
If X helps to predict Y,then the standard deviation of Y _____.
A)is larger than the standard error of estimate
B)is smaller than the standard error of estimate
C)will equal the standard error of estimate
D)will be independent of the standard error of estimate
A)is larger than the standard error of estimate
B)is smaller than the standard error of estimate
C)will equal the standard error of estimate
D)will be independent of the standard error of estimate
فتح الحزمة
افتح القفل للوصول البطاقات البالغ عددها 152 في هذه المجموعة.
فتح الحزمة
k this deck
24
The standard error of estimate is a useful index of ______.
A)the (positive square root)average error across individuals
B)the slope
C)the rate of change of one variable compared to the other variable
A)the (positive square root)average error across individuals
B)the slope
C)the rate of change of one variable compared to the other variable
فتح الحزمة
افتح القفل للوصول البطاقات البالغ عددها 152 في هذه المجموعة.
فتح الحزمة
k this deck
25
The technique which minimizes the squared vertical distances from the regression line to the data points is called the _____.
A)correlation line
B)method of least squares
C)slope minimization technique
D)truncation of range technique
A)correlation line
B)method of least squares
C)slope minimization technique
D)truncation of range technique
فتح الحزمة
افتح القفل للوصول البطاقات البالغ عددها 152 في هذه المجموعة.
فتح الحزمة
k this deck
26
Refer to the following data set.
Individual X Y
1 2 4 SCP = 80
2 4 8 SSY = 160
3 6 1 SSX = 40
4 8 16
5 10 20
The correlation coefficient for the above is ______.
A)r=.75
B)r=-1.00
C)1.00
D)0.00
Individual X Y
1 2 4 SCP = 80
2 4 8 SSY = 160
3 6 1 SSX = 40
4 8 16
5 10 20
The correlation coefficient for the above is ______.
A)r=.75
B)r=-1.00
C)1.00
D)0.00
فتح الحزمة
افتح القفل للوصول البطاقات البالغ عددها 152 في هذه المجموعة.
فتح الحزمة
k this deck
27
Which of the following linear relationships describes a situation in which the value of one variable increases as the value of the second variable decreases?
A)-.35
B).00
C).75
D)1.00
A)-.35
B).00
C).75
D)1.00
فتح الحزمة
افتح القفل للوصول البطاقات البالغ عددها 152 في هذه المجموعة.
فتح الحزمة
k this deck
28
Refer to the following data set.
Individual X Y
1 2 4 SCP = 80
2 4 8 SSY = 160
3 6 12 SSX = 40
4 8 16
5 10 20
The regression equation for the prediction of Y values is _____.
A)Y=X
B)Y=.5X
C)Y=2X+2
D)Y=2X
Individual X Y
1 2 4 SCP = 80
2 4 8 SSY = 160
3 6 12 SSX = 40
4 8 16
5 10 20
The regression equation for the prediction of Y values is _____.
A)Y=X
B)Y=.5X
C)Y=2X+2
D)Y=2X
فتح الحزمة
افتح القفل للوصول البطاقات البالغ عددها 152 في هذه المجموعة.
فتح الحزمة
k this deck
29
In the study of traditionalism and ideal family size,a correlation of .66 was found indicating a ______.
A)strong positive relationship
B)causal effect
C)weak positive relationship
D)strong causal effect
A)strong positive relationship
B)causal effect
C)weak positive relationship
D)strong causal effect
فتح الحزمة
افتح القفل للوصول البطاقات البالغ عددها 152 في هذه المجموعة.
فتح الحزمة
k this deck
30
Correlations for the types of variables studied any behavioral scientists will seldom exceed _____ and will often be considerably smaller.
A)-.80 or +.80
B)-.40 or +.40
C)-.10 or +.10
D)-.05 or +.05
A)-.80 or +.80
B)-.40 or +.40
C)-.10 or +.10
D)-.05 or +.05
فتح الحزمة
افتح القفل للوصول البطاقات البالغ عددها 152 في هذه المجموعة.
فتح الحزمة
k this deck
31
When some third variable is responsible for the correlation between X and Y,the correlation is said to be:
A)spurious
B)false
C)nonlinear
D)moderate
A)spurious
B)false
C)nonlinear
D)moderate
فتح الحزمة
افتح القفل للوصول البطاقات البالغ عددها 152 في هذه المجموعة.
فتح الحزمة
k this deck
32
In the case of a(n)_____ relationship,the standard scores on X and Y will have different signs but will be identical in size.
A)perfect negative linear
B)prefect positive linear
C)imperfect negative nonlinear
D)imperfect negative linear
A)perfect negative linear
B)prefect positive linear
C)imperfect negative nonlinear
D)imperfect negative linear
فتح الحزمة
افتح القفل للوصول البطاقات البالغ عددها 152 في هذه المجموعة.
فتح الحزمة
k this deck
33
When a correlation is perfect and positive,which of the following holds true?
A)r=1.00
B)r=.00
C)r=-1.00
D)both a and b
A)r=1.00
B)r=.00
C)r=-1.00
D)both a and b
فتح الحزمة
افتح القفل للوصول البطاقات البالغ عددها 152 في هذه المجموعة.
فتح الحزمة
k this deck
34
The extent of _____ between two variables is indexed by a statistic known as the Pearson correlation coefficient.
A)linear approximation
B)nonlinear approximation
C)linear specification
D)nonlinear specification
A)linear approximation
B)nonlinear approximation
C)linear specification
D)nonlinear specification
فتح الحزمة
افتح القفل للوصول البطاقات البالغ عددها 152 في هذه المجموعة.
فتح الحزمة
k this deck
35
The magnitude of the correlation coefficient is indexed by its:
A)sign
B)slope
C)absolute value
D)relative value
A)sign
B)slope
C)absolute value
D)relative value
فتح الحزمة
افتح القفل للوصول البطاقات البالغ عددها 152 في هذه المجموعة.
فتح الحزمة
k this deck
36
A correlation coefficient of _____ means the two variables form a perfect linear relationship.
A)+1.00
B)-1.00
C)0
D)a and b
A)+1.00
B)-1.00
C)0
D)a and b
فتح الحزمة
افتح القفل للوصول البطاقات البالغ عددها 152 في هذه المجموعة.
فتح الحزمة
k this deck
37
Refer to the following data set.
Individual X Y
1 2 4 SCP = 80
2 4 8 SSY = 160
3 6 12 SSX = 40
4 8 16
5 10 20
The standard error of estimate is _______.
A)1.00
B)0.00
C)insufficient data
D)1%
Individual X Y
1 2 4 SCP = 80
2 4 8 SSY = 160
3 6 12 SSX = 40
4 8 16
5 10 20
The standard error of estimate is _______.
A)1.00
B)0.00
C)insufficient data
D)1%
فتح الحزمة
افتح القفل للوصول البطاقات البالغ عددها 152 في هذه المجموعة.
فتح الحزمة
k this deck
38
When two variables,X and Y,are correlated,it is possible that:
A)X causes Y
B)Y causes X
C)some other variable causes both X and Y
D)all of these
A)X causes Y
B)Y causes X
C)some other variable causes both X and Y
D)all of these
فتح الحزمة
افتح القفل للوصول البطاقات البالغ عددها 152 في هذه المجموعة.
فتح الحزمة
k this deck
39
If two variables are perfectly correlated,then ____.
A)all data points fall on the regression line
B)the average error in predicting scores is very large
C)the standard error of estimate is very large
D)an increase in x leads to no change in Y
A)all data points fall on the regression line
B)the average error in predicting scores is very large
C)the standard error of estimate is very large
D)an increase in x leads to no change in Y
فتح الحزمة
افتح القفل للوصول البطاقات البالغ عددها 152 في هذه المجموعة.
فتح الحزمة
k this deck
40
Correlational analysis frequently demonstrates how one variable ______.
A)causes the value of the other variable
B)is caused by the value of the other variable
C)is caused by a third variable
D)may be related to another variable
A)causes the value of the other variable
B)is caused by the value of the other variable
C)is caused by a third variable
D)may be related to another variable
فتح الحزمة
افتح القفل للوصول البطاقات البالغ عددها 152 في هذه المجموعة.
فتح الحزمة
k this deck
41
The __________ indicates the number of units variable Y changes as variable X changes by 1 unit.
A)intercept
B)correlation coefficient
C)slope
D)standard error of estimate
A)intercept
B)correlation coefficient
C)slope
D)standard error of estimate
فتح الحزمة
افتح القفل للوصول البطاقات البالغ عددها 152 في هذه المجموعة.
فتح الحزمة
k this deck
42
A positive slope indicates _________ between two variables.
A)a direct relationship
B)an inverse relationship
C)a nonlinear relationship
D)no relationship
A)a direct relationship
B)an inverse relationship
C)a nonlinear relationship
D)no relationship
فتح الحزمة
افتح القفل للوصول البطاقات البالغ عددها 152 في هذه المجموعة.
فتح الحزمة
k this deck
43
The regression equation for predicting X from Y _____ as the regression equation for predicting Y from X.
A)is not the same
B)is exactly the same
C)gives the same results
D)b and c
A)is not the same
B)is exactly the same
C)gives the same results
D)b and c
فتح الحزمة
افتح القفل للوصول البطاقات البالغ عددها 152 في هذه المجموعة.
فتح الحزمة
k this deck
44
If two variables are related in a fashion that is nonlinear,Pearson correlation:
A)will always be negative
B)will be sensitive to this
C)will not be sensitive to this
D)will always be positive
A)will always be negative
B)will be sensitive to this
C)will not be sensitive to this
D)will always be positive
فتح الحزمة
افتح القفل للوصول البطاقات البالغ عددها 152 في هذه المجموعة.
فتح الحزمة
k this deck
45
In least squares analysis,the slope and intercept are defined so as to minimize the _____ that the data points,considered collectively,are from the regression line.
A)vertical distances
B)horizontal distances
C)squared vertical distances
D)squared horizontal distances
A)vertical distances
B)horizontal distances
C)squared vertical distances
D)squared horizontal distances
فتح الحزمة
افتح القفل للوصول البطاقات البالغ عددها 152 في هذه المجموعة.
فتح الحزمة
k this deck
46
The magnitude of the correlation coefficient indicates
A)the degree of non-linear approximation between two variables.
B)the degree to which a linear relationship is approximated.
C)the slope of the regression line.
D)the intercept of the regression line.
A)the degree of non-linear approximation between two variables.
B)the degree to which a linear relationship is approximated.
C)the slope of the regression line.
D)the intercept of the regression line.
فتح الحزمة
افتح القفل للوصول البطاقات البالغ عددها 152 في هذه المجموعة.
فتح الحزمة
k this deck
47
When scores on Y are predicted from scores on X using a regression equation,the amount of error for a given individual can be represented by the discrepancy between that person's:
A)actual and predicted Y scores
B)actual and predicted X scores
C)a and b
D)neither a nor b
A)actual and predicted Y scores
B)actual and predicted X scores
C)a and b
D)neither a nor b
فتح الحزمة
افتح القفل للوصول البطاقات البالغ عددها 152 في هذه المجموعة.
فتح الحزمة
k this deck
48
When a linear relationship is negative,
A)the z scores on X will be different in size from the z scores on Y,but they will tend to be alike in sign.
B)the z scores on X will be different in size from the z scores on Y,but they will tend to be opposite in sign.
C)the z scores on X will tend to be similar to the z scores on Y,and they will tend to be alike in sign.
D)the z scores on X will tend to be similar to the z scores on Y,but they will tend to be opposite in sign.
فتح الحزمة
افتح القفل للوصول البطاقات البالغ عددها 152 في هذه المجموعة.
فتح الحزمة
k this deck
49
When one finds that there is a strong correlation between X and Y it is possible that.....
A)changes in X cause changes is Y.
B)changes in Y cause changes is X.
C)changes in X and Y are due to another variable.
D)all of these
A)changes in X cause changes is Y.
B)changes in Y cause changes is X.
C)changes in X and Y are due to another variable.
D)all of these
فتح الحزمة
افتح القفل للوصول البطاقات البالغ عددها 152 في هذه المجموعة.
فتح الحزمة
k this deck
50
The number in a correlation matrix where a row intersects a column is
A)the frequency of the X variable.
B)the frequency of the Y variable.
C)a correlation coefficient.
D)both a and c
E)both b and c
A)the frequency of the X variable.
B)the frequency of the Y variable.
C)a correlation coefficient.
D)both a and c
E)both b and c
فتح الحزمة
افتح القفل للوصول البطاقات البالغ عددها 152 في هذه المجموعة.
فتح الحزمة
k this deck
51
Which of the following r values indicates the weakest relationship between two variables?
A).45
B)-.30
C).03
D)-.45
A).45
B)-.30
C).03
D)-.45
فتح الحزمة
افتح القفل للوصول البطاقات البالغ عددها 152 في هذه المجموعة.
فتح الحزمة
k this deck
52
When standard scores are used to calculate the regression equation,the intercept will always equal _____ and the slope will always equal _____.
A)1.0;the correlation coefficient
B)0;the correlation coefficient
C)1.0;0
D)0;1.0
A)1.0;the correlation coefficient
B)0;the correlation coefficient
C)1.0;0
D)0;1.0
فتح الحزمة
افتح القفل للوصول البطاقات البالغ عددها 152 في هذه المجموعة.
فتح الحزمة
k this deck
53
There seems to be a negative correlation between the number of errors made on an exam and the level of satisfaction with performance.What does this mean?
A)a high level of satisfaction with performance causes more errors on an exam
B)a low level of satisfaction with performance causes more errors on an exam
C)there is a tendency for those with a high level of satisfaction with performance to have made more errors on an exam
D)there is a tendency for those with a low level of satisfaction with performance to have made more errors on an exam
فتح الحزمة
افتح القفل للوصول البطاقات البالغ عددها 152 في هذه المجموعة.
فتح الحزمة
k this deck
54
A scatterplot primarily is intended to show
A)the relationship between X and Y scores.
B)the frequencies of X and Y scores.
C)the correlation of X scores.
D)the correlation of Y scores.
A)the relationship between X and Y scores.
B)the frequencies of X and Y scores.
C)the correlation of X scores.
D)the correlation of Y scores.
فتح الحزمة
افتح القفل للوصول البطاقات البالغ عددها 152 في هذه المجموعة.
فتح الحزمة
k this deck
55
From a conceptual perspective,the tradition is to designate the independent variable as the _____ variable and the dependent variable as the _____ variable.
A)linear;nonlinear
B)Y;X
C)standardized;unstandardized
D)X;Y
A)linear;nonlinear
B)Y;X
C)standardized;unstandardized
D)X;Y
فتح الحزمة
افتح القفل للوصول البطاقات البالغ عددها 152 في هذه المجموعة.
فتح الحزمة
k this deck
56
If X helps to predict Y,then the _____ will be smaller than the _____.
A)standard deviation of Y;standard estimate of error
B)standard error of estimate;sum of squares for Y
C)standard estimate of error;standard deviation of X
D)standard error of estimate;standard deviation of Y
A)standard deviation of Y;standard estimate of error
B)standard error of estimate;sum of squares for Y
C)standard estimate of error;standard deviation of X
D)standard error of estimate;standard deviation of Y
فتح الحزمة
افتح القفل للوصول البطاقات البالغ عددها 152 في هذه المجموعة.
فتح الحزمة
k this deck
57
The _____ represents an average error across individuals in predicting scores on Y from the regression equation.
A)standard deviation
B)standard error of estimate
C)standard estimate of error
D)standard error of discrepancy
A)standard deviation
B)standard error of estimate
C)standard estimate of error
D)standard error of discrepancy
فتح الحزمة
افتح القفل للوصول البطاقات البالغ عددها 152 في هذه المجموعة.
فتح الحزمة
k this deck
58
The criterion for deriving the values of the slope and intercept in a linear regression problem is formally known as the:
A)maximum likelihood criterion
B)oblique squares criterion
C)least squares criterion
D)sum of squares criterion
A)maximum likelihood criterion
B)oblique squares criterion
C)least squares criterion
D)sum of squares criterion
فتح الحزمة
افتح القفل للوصول البطاقات البالغ عددها 152 في هذه المجموعة.
فتح الحزمة
k this deck
59
Outliers are most likely to raise interpretational complexities when:
A)sample sizes are small
B)sample sizes are large
C)correlation coefficients are small
D)correlation coefficients are large
A)sample sizes are small
B)sample sizes are large
C)correlation coefficients are small
D)correlation coefficients are large
فتح الحزمة
افتح القفل للوصول البطاقات البالغ عددها 152 في هذه المجموعة.
فتح الحزمة
k this deck
60
An r value of .20 always indicates a small correlation between two variables in the behavioral science literature.
فتح الحزمة
افتح القفل للوصول البطاقات البالغ عددها 152 في هذه المجموعة.
فتح الحزمة
k this deck
61
An outlier may influence the _____ of a correlation coefficient.
A)magnitude
B)sign
C)both magnitude and sign
A)magnitude
B)sign
C)both magnitude and sign
فتح الحزمة
افتح القفل للوصول البطاقات البالغ عددها 152 في هذه المجموعة.
فتح الحزمة
k this deck
62
The y-intercept tells you ______.
A)the change in Y for every 1-unit change in X
B)the change X for every 1-unit change in Y
C)the predicted value of Y when X equals zero
D)the average amount of error when predicting Y from X
A)the change in Y for every 1-unit change in X
B)the change X for every 1-unit change in Y
C)the predicted value of Y when X equals zero
D)the average amount of error when predicting Y from X
فتح الحزمة
افتح القفل للوصول البطاقات البالغ عددها 152 في هذه المجموعة.
فتح الحزمة
k this deck
63
Which of the following statements is true?
A)for a given set of X and Y scores there is more than one regression line when regressing Y onto X
B)a minimum of two data points must fall directly on the regression line
C)the equation for a regression line is defined by the slope and the intercept
D)a regression line has at least two intercepts
A)for a given set of X and Y scores there is more than one regression line when regressing Y onto X
B)a minimum of two data points must fall directly on the regression line
C)the equation for a regression line is defined by the slope and the intercept
D)a regression line has at least two intercepts
فتح الحزمة
افتح القفل للوصول البطاقات البالغ عددها 152 في هذه المجموعة.
فتح الحزمة
k this deck
64
The magnitude of the correlation when a limited portion of the range of a variable is considered will be _____ if the range had not been so restricted.
A)greater than
B)less than
C)either greater than,equal to,or less than
A)greater than
B)less than
C)either greater than,equal to,or less than
فتح الحزمة
افتح القفل للوصول البطاقات البالغ عددها 152 في هذه المجموعة.
فتح الحزمة
k this deck
65
The slope of a line tells you ______.
A)the change in Y for every 1-unit change in X
B)the change X for every 1-unit change in Y
C)the predicted value of Y when X equals zero
D)the average amount of error when predicting Y from X
A)the change in Y for every 1-unit change in X
B)the change X for every 1-unit change in Y
C)the predicted value of Y when X equals zero
D)the average amount of error when predicting Y from X
فتح الحزمة
افتح القفل للوصول البطاقات البالغ عددها 152 في هذه المجموعة.
فتح الحزمة
k this deck
66
If you compute a negative Pearson r between two variables (X and Y),this tells you that _____.
A)higher scores on X are associated with higher scores on Y
B)higher scores on X are associated with lower scores on Y
C)X and Y are unrelated to each other in the population
D)you have made a computational error
A)higher scores on X are associated with higher scores on Y
B)higher scores on X are associated with lower scores on Y
C)X and Y are unrelated to each other in the population
D)you have made a computational error
فتح الحزمة
افتح القفل للوصول البطاقات البالغ عددها 152 في هذه المجموعة.
فتح الحزمة
k this deck
67
Refer to the following data set.
What is the correlation between X and Y?
A).09
B).92
C).80
D)-.80
What is the correlation between X and Y?
A).09
B).92
C).80
D)-.80
فتح الحزمة
افتح القفل للوصول البطاقات البالغ عددها 152 في هذه المجموعة.
فتح الحزمة
k this deck
68
Refer to the following data set.
What is the sum of cross-products?
A)9
B)86
C)-222
D)47.5
What is the sum of cross-products?
A)9
B)86
C)-222
D)47.5
فتح الحزمة
افتح القفل للوصول البطاقات البالغ عددها 152 في هذه المجموعة.
فتح الحزمة
k this deck
69
Outliers are most likely to produce misleading results when:
A)sample sizes are small
B)sample sizes are large
C)correlation coefficients are small
D)correlation coefficients are large
A)sample sizes are small
B)sample sizes are large
C)correlation coefficients are small
D)correlation coefficients are large
فتح الحزمة
افتح القفل للوصول البطاقات البالغ عددها 152 في هذه المجموعة.
فتح الحزمة
k this deck
70
The purpose of a scatterplot is to
A)graph a straight line that represents a relationship
B)calculate the slop of the line
C)calculate the linear equation for the data set
D)graph the values of variables X and Y for each person
A)graph a straight line that represents a relationship
B)calculate the slop of the line
C)calculate the linear equation for the data set
D)graph the values of variables X and Y for each person
فتح الحزمة
افتح القفل للوصول البطاقات البالغ عددها 152 في هذه المجموعة.
فتح الحزمة
k this deck
71
Which type of relationship is graphed in the following scatterplot?
A)no relationship
B)positive curvilinear relationship
C)negative linear relationship
D)positive linear relationship
A)no relationship
B)positive curvilinear relationship
C)negative linear relationship
D)positive linear relationship
فتح الحزمة
افتح القفل للوصول البطاقات البالغ عددها 152 في هذه المجموعة.
فتح الحزمة
k this deck
72
Refer to the following data set.
What is the slope of the regression line?
A)14
B)1.8
C)22
D)5
What is the slope of the regression line?
A)14
B)1.8
C)22
D)5
فتح الحزمة
افتح القفل للوصول البطاقات البالغ عددها 152 في هذه المجموعة.
فتح الحزمة
k this deck
73
Researchers were recently surprised to learn that the correlation between the type of clothing people wear when they are not working and the type of jobs they hold is approximately zero.Based on this,we can conclude that _____.
A)people with lower status jobs tend to dress worse than people with higher status jobs
B)people with higher status jobs tend to dress better on and off the job
C)there is no relationship between the types of clothing worn in non-work settings and the type of work that people do
D)people with higher status jobs tend to dress worse when they are not at work
E)people with lower status jobs tend to wear the same clothing both on and off the job
فتح الحزمة
افتح القفل للوصول البطاقات البالغ عددها 152 في هذه المجموعة.
فتح الحزمة
k this deck
74
In a scatterplot,the X variable should be plotted on the _____,and the Y variable should be plotted on the _____.
A)ordinate;abscissa
B)abscissa;ordinate
C)y-intercept;slope
D)function;abscissa
A)ordinate;abscissa
B)abscissa;ordinate
C)y-intercept;slope
D)function;abscissa
فتح الحزمة
افتح القفل للوصول البطاقات البالغ عددها 152 في هذه المجموعة.
فتح الحزمة
k this deck
75
The _____ represents the average error across individuals in predicting scores on Y from the regression equation.
A)regression line
B)correlation coefficient
C)slope
D)standard error of estimate
A)regression line
B)correlation coefficient
C)slope
D)standard error of estimate
فتح الحزمة
افتح القفل للوصول البطاقات البالغ عددها 152 في هذه المجموعة.
فتح الحزمة
k this deck
76
The Pearson correlation coefficient (r)provides information about the ______.
A)degree of a linear relationship between two variables
B)magnitude of the difference between two group means
C)curvilinear effects of a predictor variable on a criterion variable
D)degree of range restriction in your data
A)degree of a linear relationship between two variables
B)magnitude of the difference between two group means
C)curvilinear effects of a predictor variable on a criterion variable
D)degree of range restriction in your data
فتح الحزمة
افتح القفل للوصول البطاقات البالغ عددها 152 في هذه المجموعة.
فتح الحزمة
k this deck
77
The criterion for deriving the values of the slope and intercept in a linear regression equation is formally known as the:
A)maximum likelihood criterion
B)oblique squares criterion
C)least squares criterion
D)sum of squares criterion
A)maximum likelihood criterion
B)oblique squares criterion
C)least squares criterion
D)sum of squares criterion
فتح الحزمة
افتح القفل للوصول البطاقات البالغ عددها 152 في هذه المجموعة.
فتح الحزمة
k this deck
78
The statistical technique of _____ can be used to identify a line that will fit the data points better than any other line,as determined by the _____.
A)correlation;least squares criterion
B)regression;least squares criterion
C)correlation;standard error of the estimate
D)regression;standard error of the estimate
A)correlation;least squares criterion
B)regression;least squares criterion
C)correlation;standard error of the estimate
D)regression;standard error of the estimate
فتح الحزمة
افتح القفل للوصول البطاقات البالغ عددها 152 في هذه المجموعة.
فتح الحزمة
k this deck
79
Refer to the following data set.
What is the intercept of the regression line?
A)3.5
B)5.5
C).8
D)-.80
What is the intercept of the regression line?
A)3.5
B)5.5
C).8
D)-.80
فتح الحزمة
افتح القفل للوصول البطاقات البالغ عددها 152 في هذه المجموعة.
فتح الحزمة
k this deck
80
Correlation and regression both can help researchers to
A)understand how one variable is causally related to a second
B)describe a linear relationship between two variables
C)describe data for a single variable
D)understand the distribution for scores on one variable
A)understand how one variable is causally related to a second
B)describe a linear relationship between two variables
C)describe data for a single variable
D)understand the distribution for scores on one variable
فتح الحزمة
افتح القفل للوصول البطاقات البالغ عددها 152 في هذه المجموعة.
فتح الحزمة
k this deck
فتح الحزمة
افتح القفل للوصول البطاقات البالغ عددها 152 في هذه المجموعة.


