Deck 2: Frequency and Probability Distributions
ملء الشاشة (f)
سؤال
Refer to the following distribution 
What is the cumulative frequency associated with a score of 6?
A)2
B)5
C)7
D)13
What is the cumulative frequency associated with a score of 6?
A)2
B)5
C)7
D)13
سؤال
سؤال
سؤال
سؤال
سؤال
سؤال
سؤال
سؤال
سؤال
سؤال
سؤال
سؤال
سؤال
سؤال
سؤال
سؤال
Refer to the following distribution 
What is the relative frequency associated with a score of 9?
A).15
B).30
C).45
D)3
What is the relative frequency associated with a score of 9?
A).15
B).30
C).45
D)3
سؤال
سؤال
سؤال
سؤال
سؤال
سؤال
سؤال
سؤال
سؤال
سؤال
سؤال
سؤال
سؤال
سؤال
سؤال
سؤال
سؤال
سؤال
سؤال
سؤال
سؤال
سؤال
سؤال
سؤال
سؤال
Below is a frequency distribution of the number of days absent from school in a group of 25 fifth-grade students. 
What is the cumulative relative frequency for 7 days absent?
A)0
B).87
C).96
D)24.0
What is the cumulative relative frequency for 7 days absent?
A)0
B).87
C).96
D)24.0
سؤال
سؤال
Below is a frequency distribution of the number of days absent from school in a group of 25 fifth-grade students. 
What percentage of students were absent for 4 days?
A)4.0
B)20.0
C)52.0
D)68.0
What percentage of students were absent for 4 days?
A)4.0
B)20.0
C)52.0
D)68.0
سؤال
سؤال
سؤال
سؤال
سؤال
سؤال
سؤال
Below is a frequency distribution of the number of days absent from school in a group of 25 fifth-grade students. 
What is the cumulative frequency for a score of 5?
A)17
B)21
C)4
D)5
What is the cumulative frequency for a score of 5?
A)17
B)21
C)4
D)5
سؤال
Below is a frequency distribution of the number of days absent from school in a group of 25 fifth-grade students. 
What proportion of students were absent for 3 or less days?
A).08
B).40
C).48
D).60
What proportion of students were absent for 3 or less days?
A).08
B).40
C).48
D).60
سؤال
سؤال
سؤال
سؤال
سؤال
سؤال
سؤال
سؤال
سؤال
سؤال
The Human resource department wants to determine the frequency of sick days for 8 employees' that make up their department.Below is their data 
What is the cumulative relative frequency for being sick for 5 days?
A).375
B)1.00
C).125
D).250
E)None of these
What is the cumulative relative frequency for being sick for 5 days?
A).375
B)1.00
C).125
D).250
E)None of these
سؤال
سؤال
سؤال
سؤال
The axis labeled "a" is called the_____. 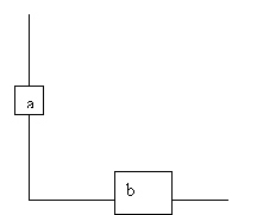
A)y-axis
B)x-axis
C)ordinate
D)both b & c
E)both a & c
A)y-axis
B)x-axis
C)ordinate
D)both b & c
E)both a & c
سؤال
سؤال
سؤال
سؤال
سؤال
سؤال
سؤال
The Human resource department wants to determine the frequency of sick days for 8 employees' that make up their department.Below is their data 
What is the cumulative frequency for being sick 7 days?
A)8
B)5
C)1.00
D)3.00
What is the cumulative frequency for being sick 7 days?
A)8
B)5
C)1.00
D)3.00
سؤال
سؤال
The Human resource department wants to determine the frequency of sick days for 8 employees' that make up their department.Below is their data 
What was the percentage of employee's that were sick for 7 days?
A)37.5%
B)12.50%
C)25.00%
D)90%
What was the percentage of employee's that were sick for 7 days?
A)37.5%
B)12.50%
C)25.00%
D)90%
سؤال
The Human resource department wants to determine the frequency of sick days for 8 employees' that make up their department.Below is their data 
What is the relative frequency for being sick 8 days?
A).375
B)1.00
C).125
D)None of these
What is the relative frequency for being sick 8 days?
A).375
B)1.00
C).125
D)None of these
سؤال
سؤال
سؤال
سؤال
The axis labeled "b" is called the______. 
A)y-axis
B)x-axis
C)ordinate
D)both b& c
E)both a & c
A)y-axis
B)x-axis
C)ordinate
D)both b& c
E)both a & c

فتح الحزمة
قم بالتسجيل لفتح البطاقات في هذه المجموعة!
Unlock Deck
Unlock Deck
1/150
العب
ملء الشاشة (f)
Deck 2: Frequency and Probability Distributions
1
Refer to the following distribution
What is the cumulative frequency associated with a score of 6?
A)2
B)5
C)7
D)13
What is the cumulative frequency associated with a score of 6?
A)2
B)5
C)7
D)13
7
2
Guidelines for grouping scores suggest you use ____ groups.
A)the fewest number of
B)between 0 and 5
C)between 5 and 15
D)over 20
A)the fewest number of
B)between 0 and 5
C)between 5 and 15
D)over 20
between 5 and 15
3
When we are concerned with a continuous variable,such as the degree of hyperactivity,frequencies and relative frequencies should be thought of in terms of the _____ of the scores.
A)proportions
B)percentages
C)real limits
D)proportions and percentages
A)proportions
B)percentages
C)real limits
D)proportions and percentages
real limits
4
If the lowest score in a distribution is 47 and the highest score is 99 and you used six groups,what is the appropriate interval size?
A)5
B)2
C)10
D)10.4
A)5
B)2
C)10
D)10.4
فتح الحزمة
افتح القفل للوصول البطاقات البالغ عددها 150 في هذه المجموعة.
فتح الحزمة
k this deck
5
A frequency distribution is a table that lists _____ on a variable and shows the number of individuals who obtained each _____.
A)scores;value
B)classes;frequencies
C)frequencies;class
D)scores;frequency
A)scores;value
B)classes;frequencies
C)frequencies;class
D)scores;frequency
فتح الحزمة
افتح القفل للوصول البطاقات البالغ عددها 150 في هذه المجموعة.
فتح الحزمة
k this deck
6
Suppose you were given 102 scores which ranged from 0 to 45 and you were asked to create a grouped frequency distribution using 15 intervals.What would be the most appropriate starting value?
A)0
B)15
C)3
D)7
A)0
B)15
C)3
D)7
فتح الحزمة
افتح القفل للوصول البطاقات البالغ عددها 150 في هذه المجموعة.
فتح الحزمة
k this deck
7
If the range of scores in a distribution were equal to 48 and you placed the scores within ten groups,what interval size should be used?
A)4.8
B)5.0
C)10
D)4.0
A)4.8
B)5.0
C)10
D)4.0
فتح الحزمة
افتح القفل للوصول البطاقات البالغ عددها 150 في هذه المجموعة.
فتح الحزمة
k this deck
8
When a relative frequency is multiplied by 100,it reflects the _____ of times the score occurred.
A)proportion
B)percentage
C)absolute frequency
D)cumulative frequency
A)proportion
B)percentage
C)absolute frequency
D)cumulative frequency
فتح الحزمة
افتح القفل للوصول البطاقات البالغ عددها 150 في هذه المجموعة.
فتح الحزمة
k this deck
9
Given the scores 50,50,60,70,80,90,92,92,what is the cumulative relative frequency for a score of 90?
A).125
B).83
C).25
D).75
A).125
B).83
C).25
D).75
فتح الحزمة
افتح القفل للوصول البطاقات البالغ عددها 150 في هذه المجموعة.
فتح الحزمة
k this deck
10
In grouped frequency distributions,we typically use interval sizes of _____.
A)2 or 3
B)5 or 10
C)2,3,or multiples of 5
D)none of these
A)2 or 3
B)5 or 10
C)2,3,or multiples of 5
D)none of these
فتح الحزمة
افتح القفل للوصول البطاقات البالغ عددها 150 في هذه المجموعة.
فتح الحزمة
k this deck
11
A table that lists scores on a variable and shows the number of occurrences of each score is called a _____ distribution.
A)probability
B)frequency
C)normal
D)density
A)probability
B)frequency
C)normal
D)density
فتح الحزمة
افتح القفل للوصول البطاقات البالغ عددها 150 في هذه المجموعة.
فتح الحزمة
k this deck
12
If the scores of a class at midterm are 70,70,70,80,80,90,92,and 92,what is the relative frequency of the score 80?
A)2
B).25
C).125
D)5/8
A)2
B).25
C).125
D)5/8
فتح الحزمة
افتح القفل للوصول البطاقات البالغ عددها 150 في هذه المجموعة.
فتح الحزمة
k this deck
13
For any given score,the cumulative frequency is the frequency associated with that score plus the sum of:
A)all frequencies
B)all frequencies above that score
C)all frequencies below that score
D)all frequencies except for that score
A)all frequencies
B)all frequencies above that score
C)all frequencies below that score
D)all frequencies except for that score
فتح الحزمة
افتح القفل للوصول البطاقات البالغ عددها 150 في هذه المجموعة.
فتح الحزمة
k this deck
14
The relative frequencies in a distribution will always sum to:
A)1.00
B)100.00
C)relative frequencies can not be summed
D)none of these
A)1.00
B)100.00
C)relative frequencies can not be summed
D)none of these
فتح الحزمة
افتح القفل للوصول البطاقات البالغ عددها 150 في هذه المجموعة.
فتح الحزمة
k this deck
15
As a rule of thumb,the use of _____ groups in a grouped frequency distribution tends to strike the appropriate balance between imprecision and incomprehensibility.
A)5 to 15
B)10
C)10 to 20
D)5 to 10
A)5 to 15
B)10
C)10 to 20
D)5 to 10
فتح الحزمة
افتح القفل للوصول البطاقات البالغ عددها 150 في هذه المجموعة.
فتح الحزمة
k this deck
16
In a grouped frequency distribution,the conventional starting point for the lowest interval is the closest number evenly divisible by the interval size that is equal to or less than the _____:
A)highest score
B)lowest score
C)interval size
D)real limits of the score
A)highest score
B)lowest score
C)interval size
D)real limits of the score
فتح الحزمة
افتح القفل للوصول البطاقات البالغ عددها 150 في هذه المجموعة.
فتح الحزمة
k this deck
17
Refer to the following distribution
What is the relative frequency associated with a score of 9?
A).15
B).30
C).45
D)3
What is the relative frequency associated with a score of 9?
A).15
B).30
C).45
D)3
فتح الحزمة
افتح القفل للوصول البطاقات البالغ عددها 150 في هذه المجموعة.
فتح الحزمة
k this deck
18
A relative frequency is:
A)the proportion of times that a score occurred
B)the number of scores of a given value divided by the total number of scores
C)usually a more informative statistic than an absolute frequency
D)all of these
A)the proportion of times that a score occurred
B)the number of scores of a given value divided by the total number of scores
C)usually a more informative statistic than an absolute frequency
D)all of these
فتح الحزمة
افتح القفل للوصول البطاقات البالغ عددها 150 في هذه المجموعة.
فتح الحزمة
k this deck
19
A useful tool for summarizing a large set of data is a _____.
A)qualitative distribution
B)frequency distribution
C)descriptive distribution
D)all of these
A)qualitative distribution
B)frequency distribution
C)descriptive distribution
D)all of these
فتح الحزمة
افتح القفل للوصول البطاقات البالغ عددها 150 في هذه المجموعة.
فتح الحزمة
k this deck
20
The number of times that a score occurs divided by the total number of scores is termed a(n)_____.
A)relative frequency
B)cumulative frequency
C)probability density
D)average distribution
A)relative frequency
B)cumulative frequency
C)probability density
D)average distribution
فتح الحزمة
افتح القفل للوصول البطاقات البالغ عددها 150 في هذه المجموعة.
فتح الحزمة
k this deck
21
A major difference between bar graphs and histograms is that _____.
A)bar graphs exhibit only discrete data
B)histograms use qualitative data
C)bar graphs separate the bars
D)histograms separate the bars
A)bar graphs exhibit only discrete data
B)histograms use qualitative data
C)bar graphs separate the bars
D)histograms separate the bars
فتح الحزمة
افتح القفل للوصول البطاقات البالغ عددها 150 في هذه المجموعة.
فتح الحزمة
k this deck
22
If you want to graph a variable that is qualitative in nature,then you should use ____.
A)a bar graph
B)a histogram
C)a frequency polygon
D)It doesn't matter
A)a bar graph
B)a histogram
C)a frequency polygon
D)It doesn't matter
فتح الحزمة
افتح القفل للوصول البطاقات البالغ عددها 150 في هذه المجموعة.
فتح الحزمة
k this deck
23
In a frequency histogram,the horizontal dimension is called the _____,and the vertical dimension is called the _____.
A)X axis;Y axis
B)abscissa;ordinate
C)ordinate;abscissa
D)a and b
A)X axis;Y axis
B)abscissa;ordinate
C)ordinate;abscissa
D)a and b
فتح الحزمة
افتح القفل للوصول البطاقات البالغ عددها 150 في هذه المجموعة.
فتح الحزمة
k this deck
24
The horizontal dimension of a frequency histogram is called a(n)_____.
A)abscissa
B)Y axis
C)ordinate
D)frequency line
A)abscissa
B)Y axis
C)ordinate
D)frequency line
فتح الحزمة
افتح القفل للوصول البطاقات البالغ عددها 150 في هذه المجموعة.
فتح الحزمة
k this deck
25
In a frequency polygon,the vertical bar denotes the _____,and the horizontal bar denotes the _____.
A)frequencies;variable values
B)variable values;frequencies
C)abscissa;ordinate
D)frequencies;ordinate
A)frequencies;variable values
B)variable values;frequencies
C)abscissa;ordinate
D)frequencies;ordinate
فتح الحزمة
افتح القفل للوصول البطاقات البالغ عددها 150 في هذه المجموعة.
فتح الحزمة
k this deck
26
In a cumulative frequency graph,the cumulative frequency curve will always _____ or _____ as it moves from left to right.
A)be variable;decrease
B)remain level;increase
C)increase;decrease
D)remain level;decrease
A)be variable;decrease
B)remain level;increase
C)increase;decrease
D)remain level;decrease
فتح الحزمة
افتح القفل للوصول البطاقات البالغ عددها 150 في هذه المجموعة.
فتح الحزمة
k this deck
27
A(n)_____ is a case or a set of cases that shows a very extreme score relative to the majority of cases in the data set.
A)outlier
B)anomaly
C)residual
D)deviant case
A)outlier
B)anomaly
C)residual
D)deviant case
فتح الحزمة
افتح القفل للوصول البطاقات البالغ عددها 150 في هذه المجموعة.
فتح الحزمة
k this deck
28
In a histogram,the horizontal bar denotes the _____,and the vertical bar denotes the ______.
A)frequencies;ordinate
B)variable values;frequencies
C)abscissa;variable values
D)frequencies;variable values
A)frequencies;ordinate
B)variable values;frequencies
C)abscissa;variable values
D)frequencies;variable values
فتح الحزمة
افتح القفل للوصول البطاقات البالغ عددها 150 في هذه المجموعة.
فتح الحزمة
k this deck
29
In a stem and leaf plot of IQ scores,the digits representing the number of "hundreds" and "tens" are the _____.
A)leaf
B)base
C)stem
D)base and stem
A)leaf
B)base
C)stem
D)base and stem
فتح الحزمة
افتح القفل للوصول البطاقات البالغ عددها 150 في هذه المجموعة.
فتح الحزمة
k this deck
30
Because frequency graphs can be misleading depending on how the abscissa and ordinate are formatted,behavioral scientists have adopted a _____.
A)"two-thirds high" rule
B)"ordinate only" rule
C)"formatted ordinate" rule
D)"one-third high" rule
A)"two-thirds high" rule
B)"ordinate only" rule
C)"formatted ordinate" rule
D)"one-third high" rule
فتح الحزمة
افتح القفل للوصول البطاقات البالغ عددها 150 في هذه المجموعة.
فتح الحزمة
k this deck
31
A frequency distribution for qualitative variables would include all but which of the following?
A)frequencies
B)cumulative frequency
C)relative frequency
D)percentages
A)frequencies
B)cumulative frequency
C)relative frequency
D)percentages
فتح الحزمة
افتح القفل للوصول البطاقات البالغ عددها 150 في هذه المجموعة.
فتح الحزمة
k this deck
32
Quantitative variables can be graphed using _____.
A)frequency polygons
B)bar graphs
C)frequency histograms
D)both frequency polygons and frequency histograms
A)frequency polygons
B)bar graphs
C)frequency histograms
D)both frequency polygons and frequency histograms
فتح الحزمة
افتح القفل للوصول البطاقات البالغ عددها 150 في هذه المجموعة.
فتح الحزمة
k this deck
33
In frequency histograms,the frequencies associated with score values are labeled along the ______,and the score values are labeled along the ____.
A)abscissa;ordinate
B)bottom;side
C)ordinate;abscissa
D)horizontal axis;vertical axis
A)abscissa;ordinate
B)bottom;side
C)ordinate;abscissa
D)horizontal axis;vertical axis
فتح الحزمة
افتح القفل للوصول البطاقات البالغ عددها 150 في هذه المجموعة.
فتح الحزمة
k this deck
34
The major difference between a frequency histogram and a bar graph is that,in a bar graph,the bars are drawn such that they:
A)represent quantitative variables
B)represent continuous variables
C)do not touch one another
D)do touch one another
A)represent quantitative variables
B)represent continuous variables
C)do not touch one another
D)do touch one another
فتح الحزمة
افتح القفل للوصول البطاقات البالغ عددها 150 في هذه المجموعة.
فتح الحزمة
k this deck
35
A frequency polygon is typically used when the variable of interest is _____.
A)discrete
B)nominal
C)qualitative
D)continuous
A)discrete
B)nominal
C)qualitative
D)continuous
فتح الحزمة
افتح القفل للوصول البطاقات البالغ عددها 150 في هذه المجموعة.
فتح الحزمة
k this deck
36
To produce a probability distribution of some variable,that variable must have the properties of being _____ and ______.
A)continuous;inclusive
B)mutually inclusive;discrete
C)exhaustive;inclusive
D)mutually exclusive;exhaustive
A)continuous;inclusive
B)mutually inclusive;discrete
C)exhaustive;inclusive
D)mutually exclusive;exhaustive
فتح الحزمة
افتح القفل للوصول البطاقات البالغ عددها 150 في هذه المجموعة.
فتح الحزمة
k this deck
37
Cumulative relative frequencies are not appropriate for ____ variables.
A)quantitative
B)qualitative
C)discrete
A)quantitative
B)qualitative
C)discrete
فتح الحزمة
افتح القفل للوصول البطاقات البالغ عددها 150 في هذه المجموعة.
فتح الحزمة
k this deck
38
In frequency distributions for qualitative variables,the concepts of cumulative frequencies,cumulative relative frequencies,and cumulative percentages:
A)are still applicable
B)are mathematically different
C)are functionally equivalent
D)are not applicable
A)are still applicable
B)are mathematically different
C)are functionally equivalent
D)are not applicable
فتح الحزمة
افتح القفل للوصول البطاقات البالغ عددها 150 في هذه المجموعة.
فتح الحزمة
k this deck
39
The vertical dimension of a frequency histogram is called _____.
A)an ordinate
B)an X axis
C)an abscissa
D)none of these
A)an ordinate
B)an X axis
C)an abscissa
D)none of these
فتح الحزمة
افتح القفل للوصول البطاقات البالغ عددها 150 في هذه المجموعة.
فتح الحزمة
k this deck
40
Frequency graphs typically plot the frequency of a score along the _____.
A)abscissa
B)ordinate
C)X axis
D)all of these
A)abscissa
B)ordinate
C)X axis
D)all of these
فتح الحزمة
افتح القفل للوصول البطاقات البالغ عددها 150 في هذه المجموعة.
فتح الحزمة
k this deck
41
Probability distributions for continuous variables are conceptualized in terms of ______.
A)exact probability calculations
B)precise calculations
C)mutually exclusive scores
D)probability density functions
A)exact probability calculations
B)precise calculations
C)mutually exclusive scores
D)probability density functions
فتح الحزمة
افتح القفل للوصول البطاقات البالغ عددها 150 في هذه المجموعة.
فتح الحزمة
k this deck
42
Below is a frequency distribution of the number of days absent from school in a group of 25 fifth-grade students.
What is the cumulative relative frequency for 7 days absent?
A)0
B).87
C).96
D)24.0
What is the cumulative relative frequency for 7 days absent?
A)0
B).87
C).96
D)24.0
فتح الحزمة
افتح القفل للوصول البطاقات البالغ عددها 150 في هذه المجموعة.
فتح الحزمة
k this deck
43
A frequency distribution cannot be created for qualitative data,because these variables are not measured on any mathematical scale.
فتح الحزمة
افتح القفل للوصول البطاقات البالغ عددها 150 في هذه المجموعة.
فتح الحزمة
k this deck
44
Below is a frequency distribution of the number of days absent from school in a group of 25 fifth-grade students.
What percentage of students were absent for 4 days?
A)4.0
B)20.0
C)52.0
D)68.0
What percentage of students were absent for 4 days?
A)4.0
B)20.0
C)52.0
D)68.0
فتح الحزمة
افتح القفل للوصول البطاقات البالغ عددها 150 في هذه المجموعة.
فتح الحزمة
k this deck
45
All distributions in the family of _____ distributions are symmetrical and characterized by a "bell shape."
A)empirical
B)theoretical
C)actual
D)normal
A)empirical
B)theoretical
C)actual
D)normal
فتح الحزمة
افتح القفل للوصول البطاقات البالغ عددها 150 في هذه المجموعة.
فتح الحزمة
k this deck
46
Which of the following graphs is "closed" with the abscissa?
A)line plot
B)frequency polygon
C)histogram
D)polygon
A)line plot
B)frequency polygon
C)histogram
D)polygon
فتح الحزمة
افتح القفل للوصول البطاقات البالغ عددها 150 في هذه المجموعة.
فتح الحزمة
k this deck
47
In a grouped frequency distribution,the interval size refers to
A)the total number of values used in the frequency table
B)the lowest score in the frequency table
C)how many scores will be included in each group
D)the range of values that will characterize each group
A)the total number of values used in the frequency table
B)the lowest score in the frequency table
C)how many scores will be included in each group
D)the range of values that will characterize each group
فتح الحزمة
افتح القفل للوصول البطاقات البالغ عددها 150 في هذه المجموعة.
فتح الحزمة
k this deck
48
Based on the Method of Presentation section of Chapter 2,the reason that a published manuscript does not typically report all types of frequency information is because
A)journal readers are expected to construct complete information from what is given
B)it is assumed that just relative frequencies or percentages provide the most concise information about any given research area
C)journal space is costly and it is not economically or practically feasible
D)researchers do not have enough time to provide complete information
فتح الحزمة
افتح القفل للوصول البطاقات البالغ عددها 150 في هذه المجموعة.
فتح الحزمة
k this deck
49
The total area under the _____ represents _____.
A)density area;1.0
B)density curve;10.0
C)density curve;1.0
D)density area;100%
A)density area;1.0
B)density curve;10.0
C)density curve;1.0
D)density area;100%
فتح الحزمة
افتح القفل للوصول البطاقات البالغ عددها 150 في هذه المجموعة.
فتح الحزمة
k this deck
50
On a graph,the _____ refers to the Y-axis,while the _____ refers to the X-axis.
A)ordinate,abscissa
B)ordinal,abscissa
C)abscissa,ordinate
D)abscissa,ordinal
A)ordinate,abscissa
B)ordinal,abscissa
C)abscissa,ordinate
D)abscissa,ordinal
فتح الحزمة
افتح القفل للوصول البطاقات البالغ عددها 150 في هذه المجموعة.
فتح الحزمة
k this deck
51
Below is a frequency distribution of the number of days absent from school in a group of 25 fifth-grade students.
What is the cumulative frequency for a score of 5?
A)17
B)21
C)4
D)5
What is the cumulative frequency for a score of 5?
A)17
B)21
C)4
D)5
فتح الحزمة
افتح القفل للوصول البطاقات البالغ عددها 150 في هذه المجموعة.
فتح الحزمة
k this deck
52
Below is a frequency distribution of the number of days absent from school in a group of 25 fifth-grade students.
What proportion of students were absent for 3 or less days?
A).08
B).40
C).48
D).60
What proportion of students were absent for 3 or less days?
A).08
B).40
C).48
D).60
فتح الحزمة
افتح القفل للوصول البطاقات البالغ عددها 150 في هذه المجموعة.
فتح الحزمة
k this deck
53
A stem and leaf plot is useful because it combines features of both a _____ and a(n)_____.
A)grouped frequency distribution;ungrouped frequency distribution
B)parameter;statistic
C)line plot;pie chart
D)frequency distribution;histogram
A)grouped frequency distribution;ungrouped frequency distribution
B)parameter;statistic
C)line plot;pie chart
D)frequency distribution;histogram
فتح الحزمة
افتح القفل للوصول البطاقات البالغ عددها 150 في هذه المجموعة.
فتح الحزمة
k this deck
54
When the potential values for a qualitative or discrete variable are _____ and _____,then the probabilities associated with the individual score values will represent a probability distribution with respect to that variable.
A)mutually exclusive;exhaustive
B)mutually exclusive;nonexhaustive
C)nominal;cumulative
D)normally distributed;exhaustive
A)mutually exclusive;exhaustive
B)mutually exclusive;nonexhaustive
C)nominal;cumulative
D)normally distributed;exhaustive
فتح الحزمة
افتح القفل للوصول البطاقات البالغ عددها 150 في هذه المجموعة.
فتح الحزمة
k this deck
55
Which of the following types of variables cannot be specified by listing possible values of the variable with corresponding probabilities?
A)qualitative
B)discrete
C)continuous
D)all of these
A)qualitative
B)discrete
C)continuous
D)all of these
فتح الحزمة
افتح القفل للوصول البطاقات البالغ عددها 150 في هذه المجموعة.
فتح الحزمة
k this deck
56
Given a distribution of scores,the probability of randomly selecting a given score from that distribution equals the _____ of that score.
A)cumulative frequency
B)cumulative relative frequency
C)frequency
D)relative frequency
A)cumulative frequency
B)cumulative relative frequency
C)frequency
D)relative frequency
فتح الحزمة
افتح القفل للوصول البطاقات البالغ عددها 150 في هذه المجموعة.
فتح الحزمة
k this deck
57
Which is not true of a normal distribution?
A)It is bell-shaped.
B)It is theoretical in nature.
C)It is symmetrical.
D)It is empirically deriveD.
A)It is bell-shaped.
B)It is theoretical in nature.
C)It is symmetrical.
D)It is empirically deriveD.
فتح الحزمة
افتح القفل للوصول البطاقات البالغ عددها 150 في هذه المجموعة.
فتح الحزمة
k this deck
58
A probability density function ______.
A)can be graphically represented as a bar graph
B)can be used only to represent variables that are measured on a ratio curve
C)is a smooth curve including all possible values of a continuous variable
D)is always bell-shaped
A)can be graphically represented as a bar graph
B)can be used only to represent variables that are measured on a ratio curve
C)is a smooth curve including all possible values of a continuous variable
D)is always bell-shaped
فتح الحزمة
افتح القفل للوصول البطاقات البالغ عددها 150 في هذه المجموعة.
فتح الحزمة
k this deck
59
_____ are derived by making assumptions and representing those assumptions mathematically.
A)Empirical distributions
B)Theoretical distributions
C)Assumptive distributions
D)Realistic distributions
A)Empirical distributions
B)Theoretical distributions
C)Assumptive distributions
D)Realistic distributions
فتح الحزمة
افتح القفل للوصول البطاقات البالغ عددها 150 في هذه المجموعة.
فتح الحزمة
k this deck
60
Statisticians conceptualize a probability distribution of a _____ in terms of a probability density function.
A)qualitative variable
B)discrete variable
C)density slope
D)continuous variable
A)qualitative variable
B)discrete variable
C)density slope
D)continuous variable
فتح الحزمة
افتح القفل للوصول البطاقات البالغ عددها 150 في هذه المجموعة.
فتح الحزمة
k this deck
61
Relative frequency is the_____.
A)Proportion of scores that occur in the distributions set divided by N
B)The proportion of scores that occur at a particular score or lower than this score
C)The proportion of all scores in the distribution
D)None of these
A)Proportion of scores that occur in the distributions set divided by N
B)The proportion of scores that occur at a particular score or lower than this score
C)The proportion of all scores in the distribution
D)None of these
فتح الحزمة
افتح القفل للوصول البطاقات البالغ عددها 150 في هذه المجموعة.
فتح الحزمة
k this deck
62
The Human resource department wants to determine the frequency of sick days for 8 employees' that make up their department.Below is their data
What is the cumulative relative frequency for being sick for 5 days?
A).375
B)1.00
C).125
D).250
E)None of these
What is the cumulative relative frequency for being sick for 5 days?
A).375
B)1.00
C).125
D).250
E)None of these
فتح الحزمة
افتح القفل للوصول البطاقات البالغ عددها 150 في هذه المجموعة.
فتح الحزمة
k this deck
63
The stem plot graph is used for_____.
A)quantitative
B)qualitative
C)normally distributed data only
D)none of the above
A)quantitative
B)qualitative
C)normally distributed data only
D)none of the above
فتح الحزمة
افتح القفل للوصول البطاقات البالغ عددها 150 في هذه المجموعة.
فتح الحزمة
k this deck
64
Frequency histograms are used to present_____.
A)quantitative variables
B)qualitative variables
C)normally distributed data
D)Both a & b
A)quantitative variables
B)qualitative variables
C)normally distributed data
D)Both a & b
فتح الحزمة
افتح القفل للوصول البطاقات البالغ عددها 150 في هذه المجموعة.
فتح الحزمة
k this deck
65
The x-axis is reserved for the _____variable and the y-axis is where the _____ variable is found.
A)independent;dependent
B)dependent;independent
C)quantitative;qualitative
D)None of the above
A)independent;dependent
B)dependent;independent
C)quantitative;qualitative
D)None of the above
فتح الحزمة
افتح القفل للوصول البطاقات البالغ عددها 150 في هذه المجموعة.
فتح الحزمة
k this deck
66
The axis labeled "a" is called the_____.
A)y-axis
B)x-axis
C)ordinate
D)both b & c
E)both a & c
A)y-axis
B)x-axis
C)ordinate
D)both b & c
E)both a & c
فتح الحزمة
افتح القفل للوصول البطاقات البالغ عددها 150 في هذه المجموعة.
فتح الحزمة
k this deck
67
When the potential values for a qualitative or discrete variable are such that a person can have one and only one score,the score values are said to be
A)mutually exclusive.
B)exhaustive.
C)infinite.
D)exact.
A)mutually exclusive.
B)exhaustive.
C)infinite.
D)exact.
فتح الحزمة
افتح القفل للوصول البطاقات البالغ عددها 150 في هذه المجموعة.
فتح الحزمة
k this deck
68
A graph can be misleading,depending how the abscissa and ordinate are formatted.
فتح الحزمة
افتح القفل للوصول البطاقات البالغ عددها 150 في هذه المجموعة.
فتح الحزمة
k this deck
69
_____distributions are based on actual measurements collected in the real world,while _____ distributions are constructed by making assumptions and representing these assumptions mathematically.
A)Normal;empirical
B)Empirical;theoretical
C)Theoretical;empirical
D)Normal;theoretical
A)Normal;empirical
B)Empirical;theoretical
C)Theoretical;empirical
D)Normal;theoretical
فتح الحزمة
افتح القفل للوصول البطاقات البالغ عددها 150 في هذه المجموعة.
فتح الحزمة
k this deck
70
Many frequency distributions use intervals to group data.For example,the in class exam scores ranged from 90-60 and the professor wants to have at least 6 groupings.What should be the interval?
A)6
B)5
C)7
D)None of these
A)6
B)5
C)7
D)None of these
فتح الحزمة
افتح القفل للوصول البطاقات البالغ عددها 150 في هذه المجموعة.
فتح الحزمة
k this deck
71
Cumulative frequency is the_____.
A)Proportion of scores that occur in the distributions set divided by N
B)The proportion of scores that occur at a particular score or lower than this score
C)The proportion of all scores in the distribution
D)None of these
A)Proportion of scores that occur in the distributions set divided by N
B)The proportion of scores that occur at a particular score or lower than this score
C)The proportion of all scores in the distribution
D)None of these
فتح الحزمة
افتح القفل للوصول البطاقات البالغ عددها 150 في هذه المجموعة.
فتح الحزمة
k this deck
72
The concept of a probability density function is used with a
A)qualitative variable.
B)nominal variable.
C)continuous variable.
D)none of the above
A)qualitative variable.
B)nominal variable.
C)continuous variable.
D)none of the above
فتح الحزمة
افتح القفل للوصول البطاقات البالغ عددها 150 في هذه المجموعة.
فتح الحزمة
k this deck
73
The Human resource department wants to determine the frequency of sick days for 8 employees' that make up their department.Below is their data
What is the cumulative frequency for being sick 7 days?
A)8
B)5
C)1.00
D)3.00
What is the cumulative frequency for being sick 7 days?
A)8
B)5
C)1.00
D)3.00
فتح الحزمة
افتح القفل للوصول البطاقات البالغ عددها 150 في هذه المجموعة.
فتح الحزمة
k this deck
74
If measuring reaction times of subjects on a task,which is a continuous variable,on the x-axis should have_____.
A)real limits of the number
B)the number only
C)probability mutualism
D)Both a & c
A)real limits of the number
B)the number only
C)probability mutualism
D)Both a & c
فتح الحزمة
افتح القفل للوصول البطاقات البالغ عددها 150 في هذه المجموعة.
فتح الحزمة
k this deck
75
The Human resource department wants to determine the frequency of sick days for 8 employees' that make up their department.Below is their data
What was the percentage of employee's that were sick for 7 days?
A)37.5%
B)12.50%
C)25.00%
D)90%
What was the percentage of employee's that were sick for 7 days?
A)37.5%
B)12.50%
C)25.00%
D)90%
فتح الحزمة
افتح القفل للوصول البطاقات البالغ عددها 150 في هذه المجموعة.
فتح الحزمة
k this deck
76
The Human resource department wants to determine the frequency of sick days for 8 employees' that make up their department.Below is their data
What is the relative frequency for being sick 8 days?
A).375
B)1.00
C).125
D)None of these
What is the relative frequency for being sick 8 days?
A).375
B)1.00
C).125
D)None of these
فتح الحزمة
افتح القفل للوصول البطاقات البالغ عددها 150 في هذه المجموعة.
فتح الحزمة
k this deck
77
Frequency distributions are used to _____
A)summarize data that is quantitative in nature
B)summarize data that is qualitative in nature
C)summarize data that is normally distributed
D)Both a & c
A)summarize data that is quantitative in nature
B)summarize data that is qualitative in nature
C)summarize data that is normally distributed
D)Both a & c
فتح الحزمة
افتح القفل للوصول البطاقات البالغ عددها 150 في هذه المجموعة.
فتح الحزمة
k this deck
78
An outlier is
A)a case that shows a very extreme score relative to the majority of cases.
B)a case that represents the score of the majority of cases.
C)always caused by a clerical error in data collection.
D)both a and c
E)both b and c
A)a case that shows a very extreme score relative to the majority of cases.
B)a case that represents the score of the majority of cases.
C)always caused by a clerical error in data collection.
D)both a and c
E)both b and c
فتح الحزمة
افتح القفل للوصول البطاقات البالغ عددها 150 في هذه المجموعة.
فتح الحزمة
k this deck
79
Bar graphs are used to present_____.
A)quantitative variables
B)qualitative variables
C)normally distributed data
D)Both a & b
A)quantitative variables
B)qualitative variables
C)normally distributed data
D)Both a & b
فتح الحزمة
افتح القفل للوصول البطاقات البالغ عددها 150 في هذه المجموعة.
فتح الحزمة
k this deck
80
The axis labeled "b" is called the______.
A)y-axis
B)x-axis
C)ordinate
D)both b& c
E)both a & c
A)y-axis
B)x-axis
C)ordinate
D)both b& c
E)both a & c
فتح الحزمة
افتح القفل للوصول البطاقات البالغ عددها 150 في هذه المجموعة.
فتح الحزمة
k this deck
فتح الحزمة
افتح القفل للوصول البطاقات البالغ عددها 150 في هذه المجموعة.


