Deck 11: Correlation
ملء الشاشة (f)
سؤال
based on the following scenarios. 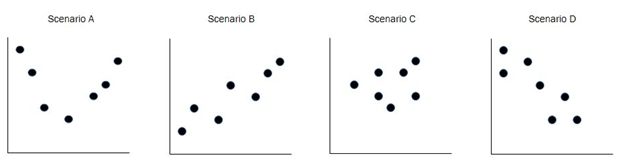
Which graph depicts a negative correlation?
A)Scenario A
B)Scenario B
C)Scenario C
D)Scenario D
Which graph depicts a negative correlation?
A)Scenario A
B)Scenario B
C)Scenario C
D)Scenario D
سؤال
سؤال
سؤال
سؤال
سؤال
سؤال
based on the following scenarios.
Which graph depicts no correlation?
A)Scenario A
B)Scenario B
C)Scenario C
D)Scenario D
Which graph depicts no correlation?
A)Scenario A
B)Scenario B
C)Scenario C
D)Scenario D
سؤال
سؤال
سؤال
سؤال
سؤال
سؤال
سؤال
سؤال
سؤال
سؤال
سؤال
سؤال
سؤال
سؤال
سؤال
سؤال
سؤال
سؤال
سؤال
سؤال
سؤال
سؤال
سؤال
سؤال
سؤال
سؤال
سؤال
سؤال
سؤال
سؤال
سؤال
سؤال
سؤال
سؤال
سؤال
سؤال
سؤال
سؤال
سؤال
سؤال
سؤال
سؤال
سؤال
سؤال
سؤال
سؤال
سؤال
سؤال
سؤال
سؤال
سؤال
سؤال
سؤال
سؤال
The items below (# 62 - 64)are based on the following table. 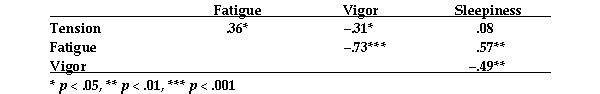
The strongest correlation is between __________ and __________.(Give variable names.)
The strongest correlation is between __________ and __________.(Give variable names.)
سؤال
سؤال
An experimenter conducted a study of the relation of size in a particular species of bird to behavioral displays of dominance.The results for the first four birds observed were as follows. 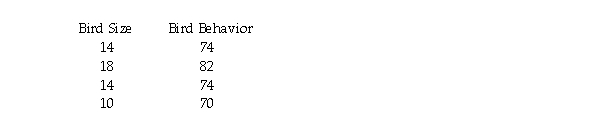 a.Make a scatter diagram of the raw scores.
b.Describe in words the general pattern of association,if any.
c.Figure the correlation coefficient.
d.Determine whether the correlation is significant using the .05 level and a two-tailed test.
e.Explain the logic of what you have done to someone who has never heard of correlation,but who does understand the mean,standard deviation,Z scores,and hypothesis testing.
f.Give three logically possible directions of causality,saying for each whether it is a reasonable direction in light of the variables involved and why.
a.Make a scatter diagram of the raw scores.b.Describe in words the general pattern of association,if any.
c.Figure the correlation coefficient.
d.Determine whether the correlation is significant using the .05 level and a two-tailed test.
e.Explain the logic of what you have done to someone who has never heard of correlation,but who does understand the mean,standard deviation,Z scores,and hypothesis testing.
f.Give three logically possible directions of causality,saying for each whether it is a reasonable direction in light of the variables involved and why.
سؤال
سؤال
The items below (# 62 - 64)are based on the following table.
The weakest correlation is between __________ and __________.(Give variable names.)
The weakest correlation is between __________ and __________.(Give variable names.)
سؤال
A social psychologist conducting a study of the relation between income and generosity observed the amount of money given to a panhandler and determined the wealth of the giver by a rating of the clothing worn.The results for the first four people observed were as follows. 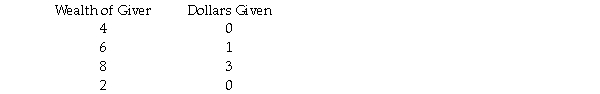 a.Make a scatter diagram of the raw scores.
b.Describe in words the general pattern of association,if any.
c.Figure the correlation coefficient.
d.Determine whether the correlation is significant using the .05 level and a two-tailed test.
e.Explain the logic of what you have done to someone who has never heard of correlation,but who does understand the mean,standard deviation,Z scores,and hypothesis testing.
f.Give three logically possible directions of causality,saying for each whether it is a reasonable direction in light of the variables involved and why.
a.Make a scatter diagram of the raw scores.b.Describe in words the general pattern of association,if any.
c.Figure the correlation coefficient.
d.Determine whether the correlation is significant using the .05 level and a two-tailed test.
e.Explain the logic of what you have done to someone who has never heard of correlation,but who does understand the mean,standard deviation,Z scores,and hypothesis testing.
f.Give three logically possible directions of causality,saying for each whether it is a reasonable direction in light of the variables involved and why.
سؤال
A cognitive psychologist studying the structure of intelligence obtained the following scores for verbal reasoning and numerical ability for six female students.(Z scores are provided.) 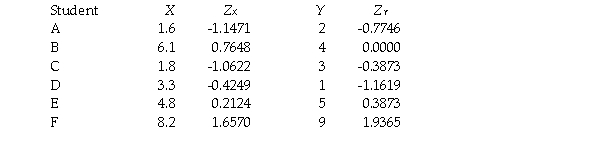 a.Make a scatter diagram of the raw scores.
b.Describe in words the general pattern of association,if any.
c.Figure the correlation coefficient.
d.Determine whether the correlation is significant using the .05 level and a two-tailed test.
e.Explain the logic of what you have done to someone who has never heard of correlation,but who does understand the mean,standard deviation,Z scores,and hypothesis testing.
f.Give three logically possible directions of causality,saying for each whether it is a reasonable direction in light of the variables involved and why.
a.Make a scatter diagram of the raw scores.b.Describe in words the general pattern of association,if any.
c.Figure the correlation coefficient.
d.Determine whether the correlation is significant using the .05 level and a two-tailed test.
e.Explain the logic of what you have done to someone who has never heard of correlation,but who does understand the mean,standard deviation,Z scores,and hypothesis testing.
f.Give three logically possible directions of causality,saying for each whether it is a reasonable direction in light of the variables involved and why.
سؤال
The items below (# 62 - 64)are based on the following table.
The correlation between sleepiness and fatigue is __________ (indicate direction)and __________ (indicate strength).
The correlation between sleepiness and fatigue is __________ (indicate direction)and __________ (indicate strength).
سؤال
سؤال
A health psychologist conducted a study of the relation of number of hours exercised each week (as the predictor variable)and number of days sick per year.The results for four individuals studied were as follows.  a.Make a scatter diagram of the raw scores.
b.Describe in words the general pattern of association,if any.
c.Figure the correlation coefficient.
d.Determine whether the correlation is significant using the .05 level and a two-tailed test.
e.Explain the logic of what you have done to someone who has never heard of correlation,but who does understand the mean,standard deviation,Z scores,and hypothesis testing.
f.Give three logically possible directions of causality,saying for each whether it is a reasonable direction in light of the variables involved and why.
a.Make a scatter diagram of the raw scores.b.Describe in words the general pattern of association,if any.
c.Figure the correlation coefficient.
d.Determine whether the correlation is significant using the .05 level and a two-tailed test.
e.Explain the logic of what you have done to someone who has never heard of correlation,but who does understand the mean,standard deviation,Z scores,and hypothesis testing.
f.Give three logically possible directions of causality,saying for each whether it is a reasonable direction in light of the variables involved and why.
سؤال

فتح الحزمة
قم بالتسجيل لفتح البطاقات في هذه المجموعة!
Unlock Deck
Unlock Deck
1/71
العب
ملء الشاشة (f)
Deck 11: Correlation
1
based on the following scenarios.
Which graph depicts a negative correlation?
A)Scenario A
B)Scenario B
C)Scenario C
D)Scenario D
Which graph depicts a negative correlation?
A)Scenario A
B)Scenario B
C)Scenario C
D)Scenario D
Scenario D
2
When making a scatter diagram,
A)the values on the vertical axis go from highest at the bottom to lowest at the top.
B)the overall shape should be roughly square.
C)two dots are used to mark each score.
D)outlying values are excluded to maintain the proper shape.
A)the values on the vertical axis go from highest at the bottom to lowest at the top.
B)the overall shape should be roughly square.
C)two dots are used to mark each score.
D)outlying values are excluded to maintain the proper shape.
the overall shape should be roughly square.
3
Making a scatter diagram before figuring the correlation coefficient is a good idea because
A)there is no point in figuring the correlation if a clear line is formed on the graph.
B)there are different procedures depending on whether there appears to be a positive or a negative correlation.
C)it allows estimation of the degree and direction of correlation to provide a check on eventual figuring.
D)a correlation coefficient should be figured only if a clear curvilinear correlation is seen.
it allows estimation of the degree and direction of correlation to provide a check on eventual figuring.
4
When is the correlation coefficient zero?
A)never
B)when there is no linear correlation
C)when there is a perfect positive linear correlation
D)when there is a perfect negative linear correlation
A)never
B)when there is no linear correlation
C)when there is a perfect positive linear correlation
D)when there is a perfect negative linear correlation
فتح الحزمة
افتح القفل للوصول البطاقات البالغ عددها 71 في هذه المجموعة.
فتح الحزمة
k this deck
5
When figuring a correlation coefficient,scores are first converted to Z scores because
A)the standard deviation is the same for every variable.
B)scores can never be more than 2 standard deviations from the mean.
C)all scores are on a consistent 0 to 1 scale.
D)high scores are positive numbers,and low scores are negative numbers.
A)the standard deviation is the same for every variable.
B)scores can never be more than 2 standard deviations from the mean.
C)all scores are on a consistent 0 to 1 scale.
D)high scores are positive numbers,and low scores are negative numbers.
فتح الحزمة
افتح القفل للوصول البطاقات البالغ عددها 71 في هذه المجموعة.
فتح الحزمة
k this deck
6
A study indicates that in general the more fruit students eat before a test,the better they do on the test.However,beyond a certain point,the more fruit students eat,the worse they do on the test.Thus,the relation between amount of fruit eaten and test performance is an example of
A)a positive linear correlation.
B)a curvilinear correlation.
C)a negative linear correlation.
D)no correlation.
A)a positive linear correlation.
B)a curvilinear correlation.
C)a negative linear correlation.
D)no correlation.
فتح الحزمة
افتح القفل للوصول البطاقات البالغ عددها 71 في هذه المجموعة.
فتح الحزمة
k this deck
7
based on the following scenarios.
Which graph depicts no correlation?
A)Scenario A
B)Scenario B
C)Scenario C
D)Scenario D
Which graph depicts no correlation?
A)Scenario A
B)Scenario B
C)Scenario C
D)Scenario D
فتح الحزمة
افتح القفل للوصول البطاقات البالغ عددها 71 في هذه المجموعة.
فتح الحزمة
k this deck
8
The difference between a positive correlation and a negative correlation is that
A)in a negative correlation,high scores go with high scores and low with low; in a positive correlation,high scores go with low scores and low with high.
B)in a negative correlation,high scores go with low scores and low with high; in a positive correlation,high scores go with high scores and low with low.
C)negative correlations are curvilinear; positive correlations are straight lines.
D)negative correlations represent a weak relationship; positive correlations represent a strong relationship.
فتح الحزمة
افتح القفل للوصول البطاقات البالغ عددها 71 في هذه المجموعة.
فتح الحزمة
k this deck
9
A scatter diagram
A)is a bar graph that shows the frequencies of the different values in a distribution.
B)is a line graph that looks like a mountain-peak skyline and shows the frequencies of the different values in a distribution.
C)shows the relation of two variables as dots in a two-dimensional graph.
D)is also called a random distribution frequency plot.
فتح الحزمة
افتح القفل للوصول البطاقات البالغ عددها 71 في هذه المجموعة.
فتح الحزمة
k this deck
10
If the correlation between two personality traits is .07,the correlation is considered a
A)weak positive linear correlation.
B)weak negative linear correlation.
C)strong positive linear correlation.
D)strong negative linear correlation.
A)weak positive linear correlation.
B)weak negative linear correlation.
C)strong positive linear correlation.
D)strong negative linear correlation.
فتح الحزمة
افتح القفل للوصول البطاقات البالغ عددها 71 في هذه المجموعة.
فتح الحزمة
k this deck
11
If a psychologist interested in the relation between number of years working for a particular company and loneliness at work surveyed 40 workers at this company and figured a correlation between these two variables of -.90,the correlation is considered a
A)weak positive linear correlation.
B)weak negative linear correlation.
C)strong positive linear correlation.
D)strong negative linear correlation.
A)weak positive linear correlation.
B)weak negative linear correlation.
C)strong positive linear correlation.
D)strong negative linear correlation.
فتح الحزمة
افتح القفل للوصول البطاقات البالغ عددها 71 في هذه المجموعة.
فتح الحزمة
k this deck
12
The average of the cross-products of Z scores is a better indicator of the relationship between two variables than the sum of the cross-products of Z scores because the average
A)appropriately measures the strength of the relationship whereas the sum does not.
B)appropriately measures the direction of the relationship whereas the sum does not.
C)is converted to a standard scale from -10 to +10 whereas the sum is not.
D)is formed using a combination of the two variables' measurement scales whereas the sum is not.
فتح الحزمة
افتح القفل للوصول البطاقات البالغ عددها 71 في هذه المجموعة.
فتح الحزمة
k this deck
13
When conducting a t test for the correlation coefficient in a study with 16 individuals,the degrees of freedom will be
A)14
B)15
C)30
D)31
A)14
B)15
C)30
D)31
فتح الحزمة
افتح القفل للوصول البطاقات البالغ عددها 71 في هذه المجموعة.
فتح الحزمة
k this deck
14
An assumption for a significance test of the correlation coefficient is that in the populations,
A)the variance of each variable is the same.
B)the variance of the deviation scores for each variable is the same.
C)the variance of each variable is the same at each point of the other variable.
D)the variance of the squared deviations of each variable is the same at each point of the distribution of the squared deviations of the other variable.
فتح الحزمة
افتح القفل للوصول البطاقات البالغ عددها 71 في هذه المجموعة.
فتح الحزمة
k this deck
15
The result of multiplying two Z scores is always
A)Positive if the individual has a high raw score on one variable,a low raw score on the other variable,and the Z for the high raw score is larger than the Z for the low raw score.
B)Positive if the individual has low raw scores on both variables.
C)Negative if the individual has high raw scores on both variables.
D)Zero
فتح الحزمة
افتح القفل للوصول البطاقات البالغ عددها 71 في هذه المجموعة.
فتح الحزمة
k this deck
16
When testing the significance of the correlation coefficient,the null hypothesis is usually that in the population,the true correlation
A)is less than 1.
B)is zero.
C)is greater than the actual correlation.
D)is less than the actual correlation.
A)is less than 1.
B)is zero.
C)is greater than the actual correlation.
D)is less than the actual correlation.
فتح الحزمة
افتح القفل للوصول البطاقات البالغ عددها 71 في هذه المجموعة.
فتح الحزمة
k this deck
17
The last step when figuring the correlation coefficient is to
A)multiply the sum of the cross-products of Z scores by the sample size.
B)divide the sum of the cross-products of Z scores by the sample size.
C)add the sample size to the sum of the cross-products of Z scores.
D)subtract the sample size from the sum of the cross-products of Z scores.
A)multiply the sum of the cross-products of Z scores by the sample size.
B)divide the sum of the cross-products of Z scores by the sample size.
C)add the sample size to the sum of the cross-products of Z scores.
D)subtract the sample size from the sum of the cross-products of Z scores.
فتح الحزمة
افتح القفل للوصول البطاقات البالغ عددها 71 في هذه المجموعة.
فتح الحزمة
k this deck
18
Which of the following calculations is necessary for figuring the correlation coefficient?
A)finding the grand mean
B)finding the cross-products of each person's X and Y raw scores
C)finding the means of X and Y
D)finding the difference between each person's X and Y raw scores
A)finding the grand mean
B)finding the cross-products of each person's X and Y raw scores
C)finding the means of X and Y
D)finding the difference between each person's X and Y raw scores
فتح الحزمة
افتح القفل للوصول البطاقات البالغ عددها 71 في هذه المجموعة.
فتح الحزمة
k this deck
19
When figuring a correlation coefficient,the absolute value of the summed cross-products
A)gets larger when the scores of more people are included in the analysis.
B)gets smaller as the variance of the scores for each variable increases.
C)gets larger as the measurement scale for each variable becomes more restricted.
D)is negative when the scores of large numbers of people are included in the analysis.
فتح الحزمة
افتح القفل للوصول البطاقات البالغ عددها 71 في هذه المجموعة.
فتح الحزمة
k this deck
20
A graph that shows the pattern of the relation of two variables is a
A)histogram.
B)scatter diagram.
C)frequency polygon.
D)box plot.
A)histogram.
B)scatter diagram.
C)frequency polygon.
D)box plot.
فتح الحزمة
افتح القفل للوصول البطاقات البالغ عددها 71 في هذه المجموعة.
فتح الحزمة
k this deck
21
When is it inappropriate to conduct a t test for the correlation coefficient?
A)when the correlation is negative
B)when the correlation is positive
C)when the relationship is linear
D)when the relationship is nonlinear
A)when the correlation is negative
B)when the correlation is positive
C)when the relationship is linear
D)when the relationship is nonlinear
فتح الحزمة
افتح القفل للوصول البطاقات البالغ عددها 71 في هذه المجموعة.
فتح الحزمة
k this deck
22
Under what conditions can the possibility that Y causes X be ruled out when two variables,X and Y,are strongly correlated?
A)if the correlation is positive
B)if the correlation is negative
C)if X occurs before Y
D)if Y occurs before X
A)if the correlation is positive
B)if the correlation is negative
C)if X occurs before Y
D)if Y occurs before X
فتح الحزمة
افتح القفل للوصول البطاقات البالغ عددها 71 في هذه المجموعة.
فتح الحزمة
k this deck
23
To compare correlations with each other,the proportionate reduction in error can be figured by
A)multiplying each correlation coefficient by 10.
B)calculating the square root of each correlation coefficient.
C)squaring each correlation coefficient.
D)multiplying each correlation coefficient by 2.
A)multiplying each correlation coefficient by 10.
B)calculating the square root of each correlation coefficient.
C)squaring each correlation coefficient.
D)multiplying each correlation coefficient by 2.
فتح الحزمة
افتح القفل للوصول البطاقات البالغ عددها 71 في هذه المجموعة.
فتح الحزمة
k this deck
24
The person given credit for inventing correlation is
A)Ronald Fisher.
B)Francis Galton.
C)William Gossett.
D)Ralph Rosnow.
A)Ronald Fisher.
B)Francis Galton.
C)William Gossett.
D)Ralph Rosnow.
فتح الحزمة
افتح القفل للوصول البطاقات البالغ عددها 71 في هذه المجموعة.
فتح الحزمة
k this deck
25
A score that has an extreme value in relation to other scores in a distribution is a(n)
A)outlier.
B)deviation.
C)outlaw.
D)miscalculation.
A)outlier.
B)deviation.
C)outlaw.
D)miscalculation.
فتح الحزمة
افتح القفل للوصول البطاقات البالغ عددها 71 في هذه المجموعة.
فتح الحزمة
k this deck
26
When the relationship between two variables is shown by listing the variables on both the top and left side,the table is called a
A)correlation matrix.
B)scatter diagram.
C)binomial effect size display.
D)C table.
A)correlation matrix.
B)scatter diagram.
C)binomial effect size display.
D)C table.
فتح الحزمة
افتح القفل للوصول البطاقات البالغ عددها 71 في هذه المجموعة.
فتح الحزمة
k this deck
27
The proportionate reduction in error is preferred over the correlation coefficient for
A)determining the direction of causality.
B)eliminating any third variables that may have been affecting the results.
C)reducing any errors that may have occurred.
D)comparing correlations with each other.
A)determining the direction of causality.
B)eliminating any third variables that may have been affecting the results.
C)reducing any errors that may have occurred.
D)comparing correlations with each other.
فتح الحزمة
افتح القفل للوصول البطاقات البالغ عددها 71 في هذه المجموعة.
فتح الحزمة
k this deck
28
The t test for the correlation coefficient
A)is robust to moderate violations of its assumptions.
B)is robust to even extreme violations of its assumptions.
C)is slightly less robust than other t tests to violations of its assumptions.
D)is much less robust than other t tests to violations of its assumptions.
A)is robust to moderate violations of its assumptions.
B)is robust to even extreme violations of its assumptions.
C)is slightly less robust than other t tests to violations of its assumptions.
D)is much less robust than other t tests to violations of its assumptions.
فتح الحزمة
افتح القفل للوصول البطاقات البالغ عددها 71 في هذه المجموعة.
فتح الحزمة
k this deck
29
Spearman's rho handles curvilinearity in the relation between two variables by first converting all scores to
A)ranks.
B)deviation scores.
C)Z scores.
D)logs of the original scores.
A)ranks.
B)deviation scores.
C)Z scores.
D)logs of the original scores.
فتح الحزمة
افتح القفل للوصول البطاقات البالغ عددها 71 في هذه المجموعة.
فتح الحزمة
k this deck
30
When correlations are reported in a research article,which of the following information is least likely to be provided?
A)the value of r
B)the significance level
C)the Z scores
D)a correlation matrix
A)the value of r
B)the significance level
C)the Z scores
D)a correlation matrix
فتح الحزمة
افتح القفل للوصول البطاقات البالغ عددها 71 في هذه المجموعة.
فتح الحزمة
k this deck
31
Under what conditions can an experimenter be confident that X is the cause of Y if two variables,X and Y,are strongly correlated?
A)if people are randomly assigned to levels of X in a true experiment
B)if people are randomly assigned to levels of Y in a true experiment
C)if X is measured before Y
D)if Y is measured before X
A)if people are randomly assigned to levels of X in a true experiment
B)if people are randomly assigned to levels of Y in a true experiment
C)if X is measured before Y
D)if Y is measured before X
فتح الحزمة
افتح القفل للوصول البطاقات البالغ عددها 71 في هذه المجموعة.
فتح الحزمة
k this deck
32
The term for the subjective overestimation of the strength of the relationship between two variables is
A)illusory correlation.
B)negative correlation.
C)positive correlation.
D)inflated correlation.
A)illusory correlation.
B)negative correlation.
C)positive correlation.
D)inflated correlation.
فتح الحزمة
افتح القفل للوصول البطاقات البالغ عددها 71 في هذه المجموعة.
فتح الحزمة
k this deck
33
One way to handle a situation in which high scores go with high scores and low scores with low scores but the pattern of scores is not linear is to
A)convert all scores to Z scores before figuring the correlation coefficient.
B)add a random variable to the presumed predictor variable.
C)figure the Wilcoxon R.
D)figure Spearman's rho.
A)convert all scores to Z scores before figuring the correlation coefficient.
B)add a random variable to the presumed predictor variable.
C)figure the Wilcoxon R.
D)figure Spearman's rho.
فتح الحزمة
افتح القفل للوصول البطاقات البالغ عددها 71 في هذه المجموعة.
فتح الحزمة
k this deck
34
Low reliability of the variables reduces the correlation coefficient because
A)the Z scores are less likely to follow a normal curve.
B)the cross-products of the Z scores are less likely to follow a normal curve.
C)it adds random noise to the computations.
D)it reduces random influences that would otherwise add to the overall variance.
A)the Z scores are less likely to follow a normal curve.
B)the cross-products of the Z scores are less likely to follow a normal curve.
C)it adds random noise to the computations.
D)it reduces random influences that would otherwise add to the overall variance.
فتح الحزمة
افتح القفل للوصول البطاقات البالغ عددها 71 في هذه المجموعة.
فتح الحزمة
k this deck
35
A reduction in a correlation due to the unreliability of a measure is
A)attenuation.
B)a restriction in range.
C)negative correlation.
D)binomial effect.
A)attenuation.
B)a restriction in range.
C)negative correlation.
D)binomial effect.
فتح الحزمة
افتح القفل للوصول البطاقات البالغ عددها 71 في هذه المجموعة.
فتح الحزمة
k this deck
36
How does Ralph Rosnow and Robert Rosenthal's position on the interpretation of correlations differ from traditional views?
A)They argue that even low correlations can have important implications.
B)They argue that low correlations (below .10)should be treated as if they are zero in virtually all cases.
C)They argue that correlational research designs can provide evidence of causality in most cases.
D)They argue that even with an experimental design,it is not possible to determine causality from a correlation.
فتح الحزمة
افتح القفل للوصول البطاقات البالغ عددها 71 في هذه المجموعة.
فتح الحزمة
k this deck
37
Illusory correlations are caused by
A)any mistake that occurs during the figuring of the correlation coefficient.
B)comparing correlations without converting them to proportionate reductions in error.
C)incorrect theories based on prejudices.
D)the combined effects of restriction in range and curvilinearity.
A)any mistake that occurs during the figuring of the correlation coefficient.
B)comparing correlations without converting them to proportionate reductions in error.
C)incorrect theories based on prejudices.
D)the combined effects of restriction in range and curvilinearity.
فتح الحزمة
افتح القفل للوصول البطاقات البالغ عددها 71 في هذه المجموعة.
فتح الحزمة
k this deck
38
What is the direction of causality when two variables,A and B,have a strong linear correlation?
A)A causes B.
B)B causes A.
C)Some third variable is causing both A and B.
D)All of the above are possible.
A)A causes B.
B)B causes A.
C)Some third variable is causing both A and B.
D)All of the above are possible.
فتح الحزمة
افتح القفل للوصول البطاقات البالغ عددها 71 في هذه المجموعة.
فتح الحزمة
k this deck
39
When figuring a correlation coefficient,an outlier
A)usually has only a small effect on the computed correlation.
B)can have an strong effect on the computed correlation.
C)generally increases the statistical power of the study.
D)can be balanced by the effects of attenuation.
A)usually has only a small effect on the computed correlation.
B)can have an strong effect on the computed correlation.
C)generally increases the statistical power of the study.
D)can be balanced by the effects of attenuation.
فتح الحزمة
افتح القفل للوصول البطاقات البالغ عددها 71 في هذه المجموعة.
فتح الحزمة
k this deck
40
The situation in which you figure a correlation but only a limited range of the possible values on one of the variables is included in the group studied is called
A)restriction in range.
B)attenuation.
C)proportionate reduction in error.
D)unreliable measurement.
A)restriction in range.
B)attenuation.
C)proportionate reduction in error.
D)unreliable measurement.
فتح الحزمة
افتح القفل للوصول البطاقات البالغ عددها 71 في هذه المجموعة.
فتح الحزمة
k this deck
41
In a study in which hearing sensitivity is considered to be the cause of love of music,a scatter diagram shows the relation between hearing sensitivity and love of music.A dot located at 4.5 across and 8 up means a person had a score of 8 on __________.
فتح الحزمة
افتح القفل للوصول البطاقات البالغ عددها 71 في هذه المجموعة.
فتح الحزمة
k this deck
42
The shape of a scatter diagram should be __________.
فتح الحزمة
افتح القفل للوصول البطاقات البالغ عددها 71 في هذه المجموعة.
فتح الحزمة
k this deck
43
When high scores go with low scores,and low with high,the correlation coefficient will be between __________ and __________.(Give numbers.)
فتح الحزمة
افتح القفل للوصول البطاقات البالغ عددها 71 في هذه المجموعة.
فتح الحزمة
k this deck
44
If an experimenter figuring a correlation between variables X and Y finds that one of the people studied had a very unusual combination of scores,the person would be called a(n)__________.
فتح الحزمة
افتح القفل للوصول البطاقات البالغ عددها 71 في هذه المجموعة.
فتح الحزمة
k this deck
45
A graphic display of the pattern of relationship between two variables is a(n)__________.
فتح الحزمة
افتح القفل للوصول البطاقات البالغ عددها 71 في هذه المجموعة.
فتح الحزمة
k this deck
46
When high scores go with high scores,and low with low,the correlation coefficient will be between __________ and __________.(Give numbers.)
فتح الحزمة
افتح القفل للوصول البطاقات البالغ عددها 71 في هذه المجموعة.
فتح الحزمة
k this deck
47
If a study finds that the scarier the movie a person is watching,the more popcorn the person will eat,the relationship between scariness and popcorn is an example of a(n)__________ correlation.
فتح الحزمة
افتح القفل للوصول البطاقات البالغ عددها 71 في هذه المجموعة.
فتح الحزمة
k this deck
48
If an experimenter wants to compare a correlation of -.3 to a correlation of .2,the actual numbers that should be compared are __________ and __________.(Give numbers.)
فتح الحزمة
افتح القفل للوصول البطاقات البالغ عددها 71 في هذه المجموعة.
فتح الحزمة
k this deck
49
In a scatter diagram,the variable thought to be the cause or the predictor goes on the __________ axis.
فتح الحزمة
افتح القفل للوصول البطاقات البالغ عددها 71 في هذه المجموعة.
فتح الحزمة
k this deck
50
A statistically significant correlation means that it is unlikely that a correlation this high would have been observed in the group studied if the correlation were in fact zero for __________.
فتح الحزمة
افتح القفل للوصول البطاقات البالغ عددها 71 في هذه المجموعة.
فتح الحزمة
k this deck
51
If there is a correlation between X and Y,and if X occurs before Y,it is possible that X causes Y or that the relation of X and Y is due to __________.
فتح الحزمة
افتح القفل للوصول البطاقات البالغ عددها 71 في هذه المجموعة.
فتح الحزمة
k this deck
52
A scatter diagram in which the pattern of dots goes reasonably straight across,but then about half-way across starts going down,is indicating a(n)__________ correlation.
فتح الحزمة
افتح القفل للوصول البطاقات البالغ عددها 71 في هذه المجموعة.
فتح الحزمة
k this deck
53
Two or more identical pairs of scores can be identified on a scatter diagram by __________.
فتح الحزمة
افتح القفل للوصول البطاقات البالغ عددها 71 في هذه المجموعة.
فتح الحزمة
k this deck
54
If a study finds that the longer a book,the less willing children are to read it,the relationship between book length and willingness to read is an example of a(n)__________ correlation.
فتح الحزمة
افتح القفل للوصول البطاقات البالغ عددها 71 في هذه المجموعة.
فتح الحزمة
k this deck
55
Multiplying a low score by a low score will always be __________.
فتح الحزمة
افتح القفل للوصول البطاقات البالغ عددها 71 في هذه المجموعة.
فتح الحزمة
k this deck
56
If a sample of only those people who have unusually high scores on A can be included in a study of the correlation between variables A and B,the correlation will be smaller due to __________.
فتح الحزمة
افتح القفل للوصول البطاقات البالغ عددها 71 في هذه المجموعة.
فتح الحزمة
k this deck
57
When testing the significance of a correlation coefficient,the usual null hypothesis is that the correlation in the population is __________.(Give a number.)
فتح الحزمة
افتح القفل للوصول البطاقات البالغ عددها 71 في هذه المجموعة.
فتح الحزمة
k this deck
58
Multiplying a person's Z score on one variable times the person's Z score on another variable creates a(n)__________ of Z scores.
فتح الحزمة
افتح القفل للوصول البطاقات البالغ عددها 71 في هذه المجموعة.
فتح الحزمة
k this deck
59
Correlations will be lower if one or both of the variables are measured with tests or inventories that are __________.
فتح الحزمة
افتح القفل للوصول البطاقات البالغ عددها 71 في هذه المجموعة.
فتح الحزمة
k this deck
60
Another name for r2 is __________.
فتح الحزمة
افتح القفل للوصول البطاقات البالغ عددها 71 في هذه المجموعة.
فتح الحزمة
k this deck
61
The items below (# 62 - 64)are based on the following table.
The strongest correlation is between __________ and __________.(Give variable names.)
The strongest correlation is between __________ and __________.(Give variable names.)
فتح الحزمة
افتح القفل للوصول البطاقات البالغ عددها 71 في هذه المجموعة.
فتح الحزمة
k this deck
62
People who observe a minority-group person doing something that is unusual for anyone and mistakenly associate the action with this minority group are demonstrating __________ correlation.
فتح الحزمة
افتح القفل للوصول البطاقات البالغ عددها 71 في هذه المجموعة.
فتح الحزمة
k this deck
63
An experimenter conducted a study of the relation of size in a particular species of bird to behavioral displays of dominance.The results for the first four birds observed were as follows. a.Make a scatter diagram of the raw scores.
b.Describe in words the general pattern of association,if any.
c.Figure the correlation coefficient.
d.Determine whether the correlation is significant using the .05 level and a two-tailed test.
e.Explain the logic of what you have done to someone who has never heard of correlation,but who does understand the mean,standard deviation,Z scores,and hypothesis testing.
f.Give three logically possible directions of causality,saying for each whether it is a reasonable direction in light of the variables involved and why.
a.Make a scatter diagram of the raw scores.b.Describe in words the general pattern of association,if any.
c.Figure the correlation coefficient.
d.Determine whether the correlation is significant using the .05 level and a two-tailed test.
e.Explain the logic of what you have done to someone who has never heard of correlation,but who does understand the mean,standard deviation,Z scores,and hypothesis testing.
f.Give three logically possible directions of causality,saying for each whether it is a reasonable direction in light of the variables involved and why.
فتح الحزمة
افتح القفل للوصول البطاقات البالغ عددها 71 في هذه المجموعة.
فتح الحزمة
k this deck
64
Using a standard power table,what is the approximate power of each of the following studies that will use correlation and the .05 significance level?
فتح الحزمة
افتح القفل للوصول البطاقات البالغ عددها 71 في هذه المجموعة.
فتح الحزمة
k this deck
65
The items below (# 62 - 64)are based on the following table.
The weakest correlation is between __________ and __________.(Give variable names.)
The weakest correlation is between __________ and __________.(Give variable names.)
فتح الحزمة
افتح القفل للوصول البطاقات البالغ عددها 71 في هذه المجموعة.
فتح الحزمة
k this deck
66
A social psychologist conducting a study of the relation between income and generosity observed the amount of money given to a panhandler and determined the wealth of the giver by a rating of the clothing worn.The results for the first four people observed were as follows. a.Make a scatter diagram of the raw scores.
b.Describe in words the general pattern of association,if any.
c.Figure the correlation coefficient.
d.Determine whether the correlation is significant using the .05 level and a two-tailed test.
e.Explain the logic of what you have done to someone who has never heard of correlation,but who does understand the mean,standard deviation,Z scores,and hypothesis testing.
f.Give three logically possible directions of causality,saying for each whether it is a reasonable direction in light of the variables involved and why.
a.Make a scatter diagram of the raw scores.b.Describe in words the general pattern of association,if any.
c.Figure the correlation coefficient.
d.Determine whether the correlation is significant using the .05 level and a two-tailed test.
e.Explain the logic of what you have done to someone who has never heard of correlation,but who does understand the mean,standard deviation,Z scores,and hypothesis testing.
f.Give three logically possible directions of causality,saying for each whether it is a reasonable direction in light of the variables involved and why.
فتح الحزمة
افتح القفل للوصول البطاقات البالغ عددها 71 في هذه المجموعة.
فتح الحزمة
k this deck
67
A cognitive psychologist studying the structure of intelligence obtained the following scores for verbal reasoning and numerical ability for six female students.(Z scores are provided.) a.Make a scatter diagram of the raw scores.
b.Describe in words the general pattern of association,if any.
c.Figure the correlation coefficient.
d.Determine whether the correlation is significant using the .05 level and a two-tailed test.
e.Explain the logic of what you have done to someone who has never heard of correlation,but who does understand the mean,standard deviation,Z scores,and hypothesis testing.
f.Give three logically possible directions of causality,saying for each whether it is a reasonable direction in light of the variables involved and why.
a.Make a scatter diagram of the raw scores.b.Describe in words the general pattern of association,if any.
c.Figure the correlation coefficient.
d.Determine whether the correlation is significant using the .05 level and a two-tailed test.
e.Explain the logic of what you have done to someone who has never heard of correlation,but who does understand the mean,standard deviation,Z scores,and hypothesis testing.
f.Give three logically possible directions of causality,saying for each whether it is a reasonable direction in light of the variables involved and why.
فتح الحزمة
افتح القفل للوصول البطاقات البالغ عددها 71 في هذه المجموعة.
فتح الحزمة
k this deck
68
The items below (# 62 - 64)are based on the following table.
The correlation between sleepiness and fatigue is __________ (indicate direction)and __________ (indicate strength).
The correlation between sleepiness and fatigue is __________ (indicate direction)and __________ (indicate strength).
فتح الحزمة
افتح القفل للوصول البطاقات البالغ عددها 71 في هذه المجموعة.
فتح الحزمة
k this deck
69
If a scatter diagram shows that high scores on one variable go with high scores on the other and low scores go with low scores,but the increase becomes increasingly steep,resulting in a curvilinear relation between two variables,the experimenter can figure a statistic called __________.
فتح الحزمة
افتح القفل للوصول البطاقات البالغ عددها 71 في هذه المجموعة.
فتح الحزمة
k this deck
70
A health psychologist conducted a study of the relation of number of hours exercised each week (as the predictor variable)and number of days sick per year.The results for four individuals studied were as follows. a.Make a scatter diagram of the raw scores.
b.Describe in words the general pattern of association,if any.
c.Figure the correlation coefficient.
d.Determine whether the correlation is significant using the .05 level and a two-tailed test.
e.Explain the logic of what you have done to someone who has never heard of correlation,but who does understand the mean,standard deviation,Z scores,and hypothesis testing.
f.Give three logically possible directions of causality,saying for each whether it is a reasonable direction in light of the variables involved and why.
a.Make a scatter diagram of the raw scores.b.Describe in words the general pattern of association,if any.
c.Figure the correlation coefficient.
d.Determine whether the correlation is significant using the .05 level and a two-tailed test.
e.Explain the logic of what you have done to someone who has never heard of correlation,but who does understand the mean,standard deviation,Z scores,and hypothesis testing.
f.Give three logically possible directions of causality,saying for each whether it is a reasonable direction in light of the variables involved and why.
فتح الحزمة
افتح القفل للوصول البطاقات البالغ عددها 71 في هذه المجموعة.
فتح الحزمة
k this deck
71
Using a standard power table,approximately how many participants are needed for 80% power in each of the following planned studies that will use correlation and the .05 significance level?
فتح الحزمة
افتح القفل للوصول البطاقات البالغ عددها 71 في هذه المجموعة.
فتح الحزمة
k this deck
فتح الحزمة
افتح القفل للوصول البطاقات البالغ عددها 71 في هذه المجموعة.


