Deck 16: Quality Control and Spc
ملء الشاشة (f)
سؤال
سؤال
سؤال
سؤال
سؤال
سؤال
سؤال
سؤال
سؤال
سؤال
سؤال
سؤال
سؤال
سؤال
An  -chart is always analyzed first because the control limits in the R-chart depend on the mean (
  ) of the data.
-chart is always analyzed first because the control limits in the R-chart depend on the mean ( ) of the data. سؤال
سؤال
سؤال
سؤال
سؤال
سؤال
سؤال
سؤال
سؤال
سؤال
سؤال
سؤال
سؤال
سؤال
سؤال
سؤال
سؤال
سؤال
سؤال
سؤال
سؤال
سؤال
سؤال
سؤال
سؤال
سؤال
سؤال
سؤال
سؤال
سؤال
سؤال
سؤال
To monitor the fraction of printed circuit boards that do not pass a functional test, a(n) ____ is used.
A) -chart
B)p-chart
C)c-chart
D)R-chart
A)
-chartB)p-chart
C)c-chart
D)R-chart
سؤال
سؤال
سؤال
سؤال
سؤال
سؤال
سؤال
سؤال
سؤال
سؤال
سؤال
If one was monitoring the average time to load a web page, the chart to use would be the
A) -chart
B)R-chart
C)p-chart
D)c-chart
A)
-chartB)R-chart
C)p-chart
D)c-chart
سؤال
سؤال
سؤال
سؤال
سؤال
سؤال
سؤال
سؤال
سؤال
سؤال
سؤال
سؤال
Find the control limits for a c-chart with  = 7.
= 7.
= 7. سؤال
سؤال
سؤال
Flaws are counted on a standard steel plate (sheet). Each sheet has the exact same dimensions. Ten sheets are selected at random and the number of flaws per sheet is as follows: 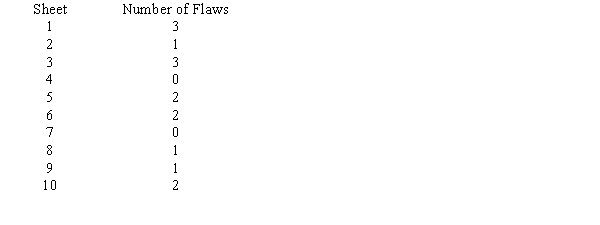
Determine the lower and upper control limits for a c-chart.
Determine the lower and upper control limits for a c-chart.
سؤال
سؤال
A Procter and Gamble factory process fills boxes with detergent. Construct an appropriate set of control charts to monitor the process. Historical data for fill weight (in ounces) of eight samples is presented below. A sample size of six was used. 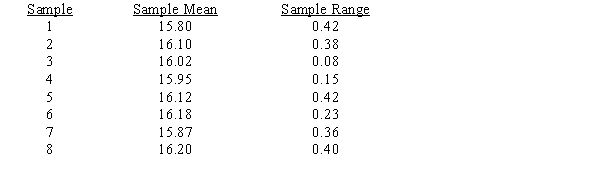
a.Compute the limits for both an R-chart and x-bar chart. Compare the sample results to the limits of the charts.
b.Briefly explain what the quality control charts tell you. What actions, if any, would you take?
a.Compute the limits for both an R-chart and x-bar chart. Compare the sample results to the limits of the charts.
b.Briefly explain what the quality control charts tell you. What actions, if any, would you take?
سؤال
Over several days, 25 samples of 100 items each were tested for electrical resistance. A total of 60 items failed. Determine  and the control limits for a p-chart.
and the control limits for a p-chart. سؤال
سؤال
سؤال
سؤال
سؤال

فتح الحزمة
قم بالتسجيل لفتح البطاقات في هذه المجموعة!
Unlock Deck
Unlock Deck
1/85
العب
ملء الشاشة (f)
Deck 16: Quality Control and Spc
1
"Quality at the source" focuses on supplier quality at the beginning of a value chain.
False
2
Poor quality that might result from a broken tool or an employee who is ill would be an example of special cause variation.
True
3
Quality control of front-office operations in services can effectively use many of the same techniques that are applied in manufacturing.
False
4
Special cause variation tends to be easily detectable using statistical methods.
فتح الحزمة
افتح القفل للوصول البطاقات البالغ عددها 85 في هذه المجموعة.
فتح الحزمة
k this deck
5
As long as no points are outside of the control limits in a control chart, the process would be considered to be in control.
فتح الحزمة
افتح القفل للوصول البطاقات البالغ عددها 85 في هذه المجموعة.
فتح الحزمة
k this deck
6
A process is considered to be in control when all common and special causes have been eliminated.
فتح الحزمة
افتح القفل للوصول البطاقات البالغ عددها 85 في هذه المجموعة.
فتح الحزمة
k this deck
7
If the mean in the range chart shifts down significantly, it indicates that the variation in the process has decreased.
فتح الحزمة
افتح القفل للوصول البطاقات البالغ عددها 85 في هذه المجموعة.
فتح الحزمة
k this deck
8
It generally costs more to correct an error or defect at the design stage than after it has reached the customer.
فتح الحزمة
افتح القفل للوصول البطاقات البالغ عددها 85 في هذه المجموعة.
فتح الحزمة
k this deck
9
The goal of statistical process control (SPC) is to help identify and eliminate unwanted causes of variation.
فتح الحزمة
افتح القفل للوصول البطاقات البالغ عددها 85 في هذه المجموعة.
فتح الحزمة
k this deck
10
In developing process control charts, if special causes are present, they are not representative of the true state of statistical control, and the calculations of the center line and control limits will be biased.
فتح الحزمة
افتح القفل للوصول البطاقات البالغ عددها 85 في هذه المجموعة.
فتح الحزمة
k this deck
11
In-process quality control is typically performed by the employees who run the processes.
فتح الحزمة
افتح القفل للوصول البطاقات البالغ عددها 85 في هذه المجموعة.
فتح الحزمة
k this deck
12
A key element of a control system is the ability to measure performance and compare it to a performance standard.
فتح الحزمة
افتح القفل للوصول البطاقات البالغ عددها 85 في هذه المجموعة.
فتح الحزمة
k this deck
13
Over-adjusting a process that is in control will usually increase the variation in the output.
فتح الحزمة
افتح القفل للوصول البطاقات البالغ عددها 85 في هذه المجموعة.
فتح الحزمة
k this deck
14
An -chart is always analyzed first because the control limits in the R-chart depend on the mean ( ) of the data.
-chart is always analyzed first because the control limits in the R-chart depend on the mean ( ) of the data. فتح الحزمة
افتح القفل للوصول البطاقات البالغ عددها 85 في هذه المجموعة.
فتح الحزمة
k this deck
15
Collecting continuous data is usually easier than collecting discrete data.
فتح الحزمة
افتح القفل للوصول البطاقات البالغ عددها 85 في هذه المجموعة.
فتح الحزمة
k this deck
16
Common cause variation generally accounts for about 10 to 15% of all variation within a process.
فتح الحزمة
افتح القفل للوصول البطاقات البالغ عددها 85 في هذه المجموعة.
فتح الحزمة
k this deck
17
In manufacturing, quality control is generally applied at the receiving stage from suppliers, during various production processes, and at the finished goods stage.
فتح الحزمة
افتح القفل للوصول البطاقات البالغ عددها 85 في هذه المجموعة.
فتح الحزمة
k this deck
18
Quality control focuses on the design of a good or service to ensure meeting customer expectations.
فتح الحزمة
افتح القفل للوصول البطاقات البالغ عددها 85 في هذه المجموعة.
فتح الحزمة
k this deck
19
With good management, all variability of output from any goods- or service-producing process can be eliminated.
فتح الحزمة
افتح القفل للوصول البطاقات البالغ عددها 85 في هذه المجموعة.
فتح الحزمة
k this deck
20
A system governed only by common causes is called a stable system.
فتح الحزمة
افتح القفل للوصول البطاقات البالغ عددها 85 في هذه المجموعة.
فتح الحزمة
k this deck
21
Common cause variation
A)Cannot be explained except in an aggregate sense
B)Is easily detectable with statistical methods and control charts
C)Cannot be reduced through better technology, process design, or training
D)Is the responsibility of the workers who run the processes
A)Cannot be explained except in an aggregate sense
B)Is easily detectable with statistical methods and control charts
C)Cannot be reduced through better technology, process design, or training
D)Is the responsibility of the workers who run the processes
فتح الحزمة
افتح القفل للوصول البطاقات البالغ عددها 85 في هذه المجموعة.
فتح الحزمة
k this deck
22
In the 1:10:100 Rule, which of the following would be correct?
A)If a defect or service error is identified and corrected at the design stage, it might cost $100 to fix.
B)If a defect or service error is identified and corrected at the production process stage, it might cost $100 to fix.
C)If a defect or service error is identified and corrected after it reaches the customer, it might cost $100 to fix.
D)If a defect or service error is identified and corrected at the design stage, it might cost $1 * $10 * $100 = $1,000 to fix.
فتح الحزمة
افتح القفل للوصول البطاقات البالغ عددها 85 في هذه المجموعة.
فتح الحزمة
k this deck
23
The lower the rate of defects, the higher the sample size should be in p-charts.
فتح الحزمة
افتح القفل للوصول البطاقات البالغ عددها 85 في هذه المجموعة.
فتح الحزمة
k this deck
24
Larger sample sizes allow smaller changes in process characteristics to be detected with higher probability.
فتح الحزمة
افتح القفل للوصول البطاقات البالغ عددها 85 في هذه المجموعة.
فتح الحزمة
k this deck
25
Evaluating the trade-offs between the costs of detecting and replacing a defective part or allowing it to continue on through the production process is related to
A)Supplier certification and management
B)In-process control
C)Finished goods control
D)Statistical process control
A)Supplier certification and management
B)In-process control
C)Finished goods control
D)Statistical process control
فتح الحزمة
افتح القفل للوصول البطاقات البالغ عددها 85 في هذه المجموعة.
فتح الحزمة
k this deck
26
Testing whether a computer boots up the first time is an example of
A)Supplier certification and management
B)In-process control
C)Finished goods control
D)Statistical process control
A)Supplier certification and management
B)In-process control
C)Finished goods control
D)Statistical process control
فتح الحزمة
افتح القفل للوصول البطاقات البالغ عددها 85 في هذه المجموعة.
فتح الحزمة
k this deck
27
Which of the following is most closely related to Statistical Process Control (SPC)?
A)Removing common causes of variation
B)Removing special causes of variation
C)Removing all causes of variation
D)Computing process capability
A)Removing common causes of variation
B)Removing special causes of variation
C)Removing all causes of variation
D)Computing process capability
فتح الحزمة
افتح القفل للوصول البطاقات البالغ عددها 85 في هذه المجموعة.
فتح الحزمة
k this deck
28
When the range of process variation is larger than the design specifications, the process capability index will be less than 1.
فتح الحزمة
افتح القفل للوصول البطاقات البالغ عددها 85 في هذه المجموعة.
فتح الحزمة
k this deck
29
If process quality approaches six sigma levels, then standard types of control charts are not useful.
فتح الحزمة
افتح القفل للوصول البطاقات البالغ عددها 85 في هذه المجموعة.
فتح الحزمة
k this deck
30
Quality at the source means that quality is controlled by
A)People responsible for the work
B)Quality control managers
C)Front line supervisors
D)Top management
A)People responsible for the work
B)Quality control managers
C)Front line supervisors
D)Top management
فتح الحزمة
افتح القفل للوصول البطاقات البالغ عددها 85 في هذه المجموعة.
فتح الحزمة
k this deck
31
Common cause variation is
A)Controllable at the sources
B)Called assignable cause
C)Can be reduced by statistical process control methods
D)The responsibility of management
A)Controllable at the sources
B)Called assignable cause
C)Can be reduced by statistical process control methods
D)The responsibility of management
فتح الحزمة
افتح القفل للوصول البطاقات البالغ عددها 85 في هذه المجموعة.
فتح الحزمة
k this deck
32
It is not necessary to have a process in control when establishing control limits.
فتح الحزمة
افتح القفل للوصول البطاقات البالغ عددها 85 في هذه المجموعة.
فتح الحزمة
k this deck
33
If no special causes affect the output of a process, we say that the process is ____; when special causes are present, the process is said to be ____.
A)Qualified; not qualified
B)In control; out of control
C)Capable; not capable
D)Certified; not certified
A)Qualified; not qualified
B)In control; out of control
C)Capable; not capable
D)Certified; not certified
فتح الحزمة
افتح القفل للوصول البطاقات البالغ عددها 85 في هذه المجموعة.
فتح الحزمة
k this deck
34
Which of the following is not a component of a control system?
A)Statistical sampling
B)Measures of actual performance
C)Goals or standards
D)Comparison of actual performance with standards or goals for corrective action if necessary
A)Statistical sampling
B)Measures of actual performance
C)Goals or standards
D)Comparison of actual performance with standards or goals for corrective action if necessary
فتح الحزمة
افتح القفل للوصول البطاقات البالغ عددها 85 في هذه المجموعة.
فتح الحزمة
k this deck
35
To account for the process centering, a two-sided capability index is often used.
فتح الحزمة
افتح القفل للوصول البطاقات البالغ عددها 85 في هذه المجموعة.
فتح الحزمة
k this deck
36
Regarding special cause variability, all are true except
A)Disrupt the random patterns of common cause variation
B)Arises from external sources that are not inherent in the process
C)Appear sporadically
D)Hard to detect using statistical methods
A)Disrupt the random patterns of common cause variation
B)Arises from external sources that are not inherent in the process
C)Appear sporadically
D)Hard to detect using statistical methods
فتح الحزمة
افتح القفل للوصول البطاقات البالغ عددها 85 في هذه المجموعة.
فتح الحزمة
k this deck
37
A c-chart is used to monitor the fraction nonconforming, whereas a p-chart monitors the number of nonconformances per unit.
فتح الحزمة
افتح القفل للوصول البطاقات البالغ عددها 85 في هذه المجموعة.
فتح الحزمة
k this deck
38
Process capability quantifies the variation that results from common causes.
فتح الحزمة
افتح القفل للوصول البطاقات البالغ عددها 85 في هذه المجموعة.
فتح الحزمة
k this deck
39
Both the p-chart and the c-chart use variable data.
فتح الحزمة
افتح القفل للوصول البطاقات البالغ عددها 85 في هذه المجموعة.
فتح الحزمة
k this deck
40
The value of Cpk is the average of the lower and upper capability indexes; that is, Cpk = (Cpl + Cpu)/2.
فتح الحزمة
افتح القفل للوصول البطاقات البالغ عددها 85 في هذه المجموعة.
فتح الحزمة
k this deck
41
Indications in a control chart of an out-of-control situation include all of the following except
A)Six or seven consecutive points that increase or decrease in value
B)About the same number of points above and below the center line
C)There are points outside control limits
D)There are no more points near the center line than there are close to the control limits
A)Six or seven consecutive points that increase or decrease in value
B)About the same number of points above and below the center line
C)There are points outside control limits
D)There are no more points near the center line than there are close to the control limits
فتح الحزمة
افتح القفل للوصول البطاقات البالغ عددها 85 في هذه المجموعة.
فتح الحزمة
k this deck
42
The upper and lower specification limits for a component are 4.20 and 4.30 ounces, respectively. The process standard deviation is .02, and the process average is 4.24 ounces. Which one of the following statements is true?
A)The Cp index indicates the process is centered.
B)The Cp index indicates the process is not centered.
C)The Cpk index indicates the process is centered.
D)The Cpk index indicates the process is not centered.
A)The Cp index indicates the process is centered.
B)The Cp index indicates the process is not centered.
C)The Cpk index indicates the process is centered.
D)The Cpk index indicates the process is not centered.
فتح الحزمة
افتح القفل للوصول البطاقات البالغ عددها 85 في هذه المجموعة.
فتح الحزمة
k this deck
43
c-charts
A)Are used for the fraction of non-conforming items
B)Count the number of nonconformances per unit
C)Use continuous metrics
D)Can have negative lower limits
A)Are used for the fraction of non-conforming items
B)Count the number of nonconformances per unit
C)Use continuous metrics
D)Can have negative lower limits
فتح الحزمة
افتح القفل للوصول البطاقات البالغ عددها 85 في هذه المجموعة.
فتح الحزمة
k this deck
44
The center line (p-bar) for a p-chart is 0.50 with an UCL = 0.70 and a LCL = 0.35. The results of the next eight sample means are 0.45, 0.60, 0.39, 0.44, 0.48, 0.53, 0.54, and 0.61. What would you do?
A)Nothing; the process is in control.
B)increase the sample size to get a better measure.
C)investigate assignable causes because four observations are above the center line.
D)investigate assignable causes because there is a bad trend (run).
A)Nothing; the process is in control.
B)increase the sample size to get a better measure.
C)investigate assignable causes because four observations are above the center line.
D)investigate assignable causes because there is a bad trend (run).
فتح الحزمة
افتح القفل للوصول البطاقات البالغ عددها 85 في هذه المجموعة.
فتح الحزمة
k this deck
45
Define "quality at the source."
فتح الحزمة
افتح القفل للوصول البطاقات البالغ عددها 85 في هذه المجموعة.
فتح الحزمة
k this deck
46
To monitor the fraction of printed circuit boards that do not pass a functional test, a(n) ____ is used.
A) -chart
B)p-chart
C)c-chart
D)R-chart
A)
-chartB)p-chart
C)c-chart
D)R-chart
فتح الحزمة
افتح القفل للوصول البطاقات البالغ عددها 85 في هذه المجموعة.
فتح الحزمة
k this deck
47
Statistical calculations will show that if p = .01, then the sample size needed to have at least a 95% chance of finding at least one nonconformance is
A)30
B)100
C)300
D)1,000
A)30
B)100
C)300
D)1,000
فتح الحزمة
افتح القفل للوصول البطاقات البالغ عددها 85 في هذه المجموعة.
فتح الحزمة
k this deck
48
Which one of the following statements is true?
A)Common cause variation arises from external sources that are not inherent in the process and is where statistical quality control methods are most useful.
B)If the metric is discrete, a p- or c-chart is normally used.
C)Statistical process control is not used in hospitals due to the high liability costs.
D)Statistical process control charts are used when trying to monitor and control 5- and 6-sigma quality levels.
فتح الحزمة
افتح القفل للوصول البطاقات البالغ عددها 85 في هذه المجموعة.
فتح الحزمة
k this deck
49
A supplier is producing a machined part for the transmission of your vehicle. The upper specification limit is 0.125 cm and the lower specification limit is 0.085. The process standard deviation for the process that makes this part is 0.008 and the process average is 0.105. What conclusion can be drawn from these process capability data?
A)The process is centered and capable.
B)The process is not centered and capable.
C)The process is centered and not capable.
D)The process is not centered and not capable.
A)The process is centered and capable.
B)The process is not centered and capable.
C)The process is centered and not capable.
D)The process is not centered and not capable.
فتح الحزمة
افتح القفل للوصول البطاقات البالغ عددها 85 في هذه المجموعة.
فتح الحزمة
k this deck
50
p-charts
A)Are used for the fraction of non-conforming items
B)Count the number of nonconformances per unit
C)Use continuous metrics
D)Can have negative lower limits
A)Are used for the fraction of non-conforming items
B)Count the number of nonconformances per unit
C)Use continuous metrics
D)Can have negative lower limits
فتح الحزمة
افتح القفل للوصول البطاقات البالغ عددها 85 في هذه المجموعة.
فتح الحزمة
k this deck
51
A bottling process sometimes results in overfills or underfills. Overfills are especially damaging to the equipment. Which process capability index would this company most want to monitor?
A)Cp
B)Cpl
C)Cpu
D)Cpk
A)Cp
B)Cpl
C)Cpu
D)Cpk
فتح الحزمة
افتح القفل للوصول البطاقات البالغ عددها 85 في هذه المجموعة.
فتح الحزمة
k this deck
52
Which of the following is not related to a continuous metric?
A)Measured as the degree of conformance to a specification
B)x-bar and R-charts
C)p-chart
D)Time
A)Measured as the degree of conformance to a specification
B)x-bar and R-charts
C)p-chart
D)Time
فتح الحزمة
افتح القفل للوصول البطاقات البالغ عددها 85 في هذه المجموعة.
فتح الحزمة
k this deck
53
Honda wants to monitor the number of blemishes (scratches, blisters, etc.) on the fenders of its cars using a statistical process control chart. The most appropriate type of SPC chart is
A)x-bar.
B)R-bar chart.
C)Cpk chart
D)c-chart
A)x-bar.
B)R-bar chart.
C)Cpk chart
D)c-chart
فتح الحزمة
افتح القفل للوصول البطاقات البالغ عددها 85 في هذه المجموعة.
فتح الحزمة
k this deck
54
Ritz-Carlton Hotel Company uses which one of the following methods to control quality?
A)R-bar and x-bar control charts to monitor customer complaints.
B)The 1:10:100 rule for goods quality only
C)Self-control of the individual employee based on their spontaneous behavior.
D)The process capability index for all goods and services provided by the hotel.
A)R-bar and x-bar control charts to monitor customer complaints.
B)The 1:10:100 rule for goods quality only
C)Self-control of the individual employee based on their spontaneous behavior.
D)The process capability index for all goods and services provided by the hotel.
فتح الحزمة
افتح القفل للوصول البطاقات البالغ عددها 85 في هذه المجموعة.
فتح الحزمة
k this deck
55
Explain and give the significance of the 1:10:100 Rule.
فتح الحزمة
افتح القفل للوصول البطاقات البالغ عددها 85 في هذه المجموعة.
فتح الحزمة
k this deck
56
Which of the following suggests a process that is not in control?
A)Points follow a smooth pattern from the lower control limit to the upper control limit
B)The number of points above and below the center line is about the same
C)Points fall randomly above and below the center line
D)No points are outside the control limits
A)Points follow a smooth pattern from the lower control limit to the upper control limit
B)The number of points above and below the center line is about the same
C)Points fall randomly above and below the center line
D)No points are outside the control limits
فتح الحزمة
افتح القفل للوصول البطاقات البالغ عددها 85 في هذه المجموعة.
فتح الحزمة
k this deck
57
If one was monitoring the average time to load a web page, the chart to use would be the
A) -chart
B)R-chart
C)p-chart
D)c-chart
A)
-chartB)R-chart
C)p-chart
D)c-chart
فتح الحزمة
افتح القفل للوصول البطاقات البالغ عددها 85 في هذه المجموعة.
فتح الحزمة
k this deck
58
Define and give an example of the three components of any control system.
فتح الحزمة
افتح القفل للوصول البطاقات البالغ عددها 85 في هذه المجموعة.
فتح الحزمة
k this deck
59
Historically, the average proportion of defective bars has been 0.015. Samples of 100 bars each are taken. Construct a p-chart using z = 3. Suppose a sample had 0.044 defectives. What would you do?
A)Nothing; it appears to be random variation.
B)Look for assignable causes.
C)Delete the sample with 0.044 defects and take another sample that is better.
D)None of these choices
A)Nothing; it appears to be random variation.
B)Look for assignable causes.
C)Delete the sample with 0.044 defects and take another sample that is better.
D)None of these choices
فتح الحزمة
افتح القفل للوصول البطاقات البالغ عددها 85 في هذه المجموعة.
فتح الحزمة
k this deck
60
Which is not related to a discrete metric?
A)Counting
B)Visual inspection
C)Good or bad
D)Time
A)Counting
B)Visual inspection
C)Good or bad
D)Time
فتح الحزمة
افتح القفل للوصول البطاقات البالغ عددها 85 في هذه المجموعة.
فتح الحزمة
k this deck
61
The time to check out guests at a hotel was measured over the course of several weeks. Management believes that the target time for checking out guests should be between 2 and 4 minutes with a target of 3 minutes. The data gathered had a mean time of 2.75 minutes with a standard deviation of 0.4 minutes. Find and interpret Cp, Cpl, Cpu, and Cpk in the context of this situation.
فتح الحزمة
افتح القفل للوصول البطاقات البالغ عددها 85 في هذه المجموعة.
فتح الحزمة
k this deck
62
Fifteen samples of size 5 have been taken from a production process. The sum of the sample averages was found to be 92.54 cm while the sum of the ranges was 115.36. Find the values of the center lines for the x-bar and R-charts.
فتح الحزمة
افتح القفل للوصول البطاقات البالغ عددها 85 في هذه المجموعة.
فتح الحزمة
k this deck
63
In general, discuss how to interpret control charts.
فتح الحزمة
افتح القفل للوصول البطاقات البالغ عددها 85 في هذه المجموعة.
فتح الحزمة
k this deck
64
An airline found that on average, 0.62% of the luggage they received from passengers at LAX (Los Angeles Airport) is lost or damaged. On a typical day, 1000 pieces of luggage pass through this airport. What are the control limits for a p-chart for monitoring the daily fraction nonconforming?
فتح الحزمة
افتح القفل للوصول البطاقات البالغ عددها 85 في هذه المجموعة.
فتح الحزمة
k this deck
65
A manufacturing company has a production process that has a target percent nonconforming of 4% which was developed based on numerous samples of 200 observations each. They want to develop control charts using 3 standard deviation limits.
a.What is the center line for the p-chart?
b.What is the upper control limit for a p-chart?
c.What is the lower control limit for a p-chart?
a.What is the center line for the p-chart?
b.What is the upper control limit for a p-chart?
c.What is the lower control limit for a p-chart?
فتح الحزمة
افتح القفل للوصول البطاقات البالغ عددها 85 في هذه المجموعة.
فتح الحزمة
k this deck
66
Explain the issues associated with selecting the appropriate sample size and sampling frequency for control charts.
فتح الحزمة
افتح القفل للوصول البطاقات البالغ عددها 85 في هذه المجموعة.
فتح الحزمة
k this deck
67
Discuss the three basic quality control practices used in manufacturing.
فتح الحزمة
افتح القفل للوصول البطاقات البالغ عددها 85 في هذه المجموعة.
فتح الحزمة
k this deck
68
Define Statistical Process Control (SPC) and differentiate between common cause and special (or assignable) cause variation.
فتح الحزمة
افتح القفل للوصول البطاقات البالغ عددها 85 في هذه المجموعة.
فتح الحزمة
k this deck
69
Find the control limits for a c-chart with = 7.
= 7. فتح الحزمة
افتح القفل للوصول البطاقات البالغ عددها 85 في هذه المجموعة.
فتح الحزمة
k this deck
70
A company is measuring the time it takes to complete an order. Twenty-five samples of size 6 resulted in an average time of 80 minutes with an average range of 20 minutes. Find control limits for the appropriate control chart(s) that would be used to monitor this process.
فتح الحزمة
افتح القفل للوصول البطاقات البالغ عددها 85 في هذه المجموعة.
فتح الحزمة
k this deck
71
A manufacturer inspected 40 circuit boards and found a total of 640 defects. If the company wants to use SPC to control the manufacturing process by monitoring the number of defects per circuit board, what type of chart should they use and what should the control limits be?
فتح الحزمة
افتح القفل للوصول البطاقات البالغ عددها 85 في هذه المجموعة.
فتح الحزمة
k this deck
72
Flaws are counted on a standard steel plate (sheet). Each sheet has the exact same dimensions. Ten sheets are selected at random and the number of flaws per sheet is as follows:
Determine the lower and upper control limits for a c-chart.
Determine the lower and upper control limits for a c-chart.
فتح الحزمة
افتح القفل للوصول البطاقات البالغ عددها 85 في هذه المجموعة.
فتح الحزمة
k this deck
73
Discuss the difference between a continuous metric and a discrete metric, give examples of each, and list the common control charts associated with each.
فتح الحزمة
افتح القفل للوصول البطاقات البالغ عددها 85 في هذه المجموعة.
فتح الحزمة
k this deck
74
A Procter and Gamble factory process fills boxes with detergent. Construct an appropriate set of control charts to monitor the process. Historical data for fill weight (in ounces) of eight samples is presented below. A sample size of six was used.
a.Compute the limits for both an R-chart and x-bar chart. Compare the sample results to the limits of the charts.
b.Briefly explain what the quality control charts tell you. What actions, if any, would you take?
a.Compute the limits for both an R-chart and x-bar chart. Compare the sample results to the limits of the charts.
b.Briefly explain what the quality control charts tell you. What actions, if any, would you take?
فتح الحزمة
افتح القفل للوصول البطاقات البالغ عددها 85 في هذه المجموعة.
فتح الحزمة
k this deck
75
Over several days, 25 samples of 100 items each were tested for electrical resistance. A total of 60 items failed. Determine and the control limits for a p-chart.
and the control limits for a p-chart. فتح الحزمة
افتح القفل للوصول البطاقات البالغ عددها 85 في هذه المجموعة.
فتح الحزمة
k this deck
76
A high-paced discount store in Los Angeles has noticed that checking errors have increased recently. They plan to use control charts with three standard deviation control limits to monitor the process. They decided to take a sample of 100 transactions over each of 10 days. The number of transactions in error for each day was 5, 7, 6, 5, 6, 4, 6, 3, 10, and 8.
a.What is the center line for the p-chart?
b.What is the upper control limit for the p-chart?
c.What is the lower control limit for the p-chart?
a.What is the center line for the p-chart?
b.What is the upper control limit for the p-chart?
c.What is the lower control limit for the p-chart?
فتح الحزمة
افتح القفل للوصول البطاقات البالغ عددها 85 في هذه المجموعة.
فتح الحزمة
k this deck
77
A bottling machine fills soft drink bottles with an average of 12.000 ounces with a standard deviation of 0.002 ounces. Determine the process capability index, Cp, if the design specification for the fill weight of the bottles is 12.000 ounces plus or minus 0.015 ounces.
فتح الحزمة
افتح القفل للوصول البطاقات البالغ عددها 85 في هذه المجموعة.
فتح الحزمة
k this deck
78
What is the purpose of a process-capability study and what is a process capability index?
فتح الحزمة
افتح القفل للوصول البطاقات البالغ عددها 85 في هذه المجموعة.
فتح الحزمة
k this deck
79
An operator has determined what her percent defectives is for the machine which she operates. Based on several samples of 75 observations, she found p-bar to be 10%. She wants to set up a control chart using 3 standard deviation control limits.
a.What is the upper control limit for a p-chart?
b.What is the lower control limit for a p-chart?
a.What is the upper control limit for a p-chart?
b.What is the lower control limit for a p-chart?
فتح الحزمة
افتح القفل للوصول البطاقات البالغ عددها 85 في هذه المجموعة.
فتح الحزمة
k this deck
80
A production process is sampled 24 times with a sample size of 6 yields an overall mean of 25.2 and an average range of 0.8. Determine the control limits for the x-bar and R-charts.
فتح الحزمة
افتح القفل للوصول البطاقات البالغ عددها 85 في هذه المجموعة.
فتح الحزمة
k this deck
فتح الحزمة
افتح القفل للوصول البطاقات البالغ عددها 85 في هذه المجموعة.


