Deck 8: Economic Growth
ملء الشاشة (f)
سؤال
Refer to the above table.Between years 1 and 2,real GDP grew by _______ percent in Italy:
A) 3
B) 4
C) 5
D) 10
سؤال
سؤال
سؤال
سؤال
سؤال
Refer to the above table,per capita GDP was about:
A) $105 in year 3 in Italy.
B) $303 in year 3 in China.
C) $200 in year 1 in China
D) $5 in year 2 in Italy.
سؤال
سؤال
سؤال
سؤال
سؤال
سؤال
سؤال
سؤال
سؤال
سؤال
Refer to the above table.Between years 1 and 2,real GDP per capita grew by _____ percent in Italy:
A) 3
B) 4
C) 5
D) 10
سؤال
سؤال
Refer to the above table,between years 2 and 3:
A) Italy's real GDP grew more rapidly than China's real GDP.
B) real GDP fell in China.
C) population growth reduced Italy's real GDP growth to zero.
D) population fell in Italy's.
سؤال
سؤال
سؤال
سؤال
سؤال
سؤال
سؤال
سؤال
سؤال
سؤال
سؤال
سؤال
سؤال
سؤال
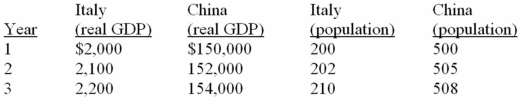
Refer to the above diagram.If the production possibilities curve of an economy shifts from AB to CD,it is most likely the result of what factor affecting economic growth?
A) a supply factor
B) a demand factor
C) an efficiency factor
D) an allocation factor
سؤال
سؤال
سؤال
سؤال
سؤال
Refer to the above diagram.If the production possibilities curve for an economy is at AB but the economy is operating at point 4,the reasons are most likely to be because of:
A) supply and environmental factors.
B) demand and efficiency factors.
C) labour inputs and labour productivity.
D) technological progress.
سؤال
سؤال
سؤال
Refer to the above diagram.If the production possibilities curve of an economy shifts from AB to EF,it is most likely the result of what factor affecting economic growth?
A) a supply factor
B) a demand factor
C) an efficiency factor
D) an allocation factor
سؤال
Refer to the diagram below.A shift in the production possibilities curve from AB to CD is most likely due to: 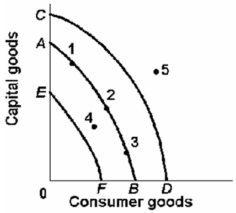
A) the use of the economy's resources in an efficient way.
B) an increase in the spending of business and consumers.
C) an increase in government purchase of the economy's output.
D) an increase in the quantity and quality of labour resources.
A) the use of the economy's resources in an efficient way.
B) an increase in the spending of business and consumers.
C) an increase in government purchase of the economy's output.
D) an increase in the quantity and quality of labour resources.
سؤال
Refer to the above diagram.If there is a movement away from the full employment of resources in an economy with production possibilities curve AB,this can be shown by:
A) a shift of the curve from AB to CD.
B) a movement from point 3 to point 1.
C) a movement from point 2 to point 4.
D) point 5 in the diagram.
سؤال
سؤال
سؤال
سؤال
سؤال
سؤال
سؤال
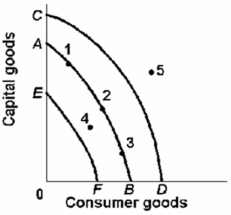
Refer to the above graph.If the production possibilities curve of an economy shifts from AB to CD,it is most likely caused by:
A) a decrease in the price level.
B) allocative efficiency.
C) technological progress.
D) full employment of resources.
سؤال
سؤال
سؤال
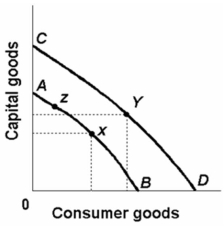
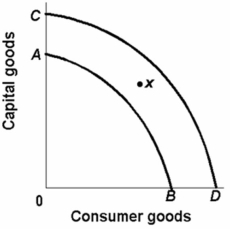
Refer to the above diagram.Realized economic growth is best represented by a:
A) shift in the production possibilities curve from y on AB to x on CD.
B) move from x on AB to y on CD.
C) shift in the production possibilities curve from CD to AB.
D) move from x to z along AB.
سؤال
Refer to the above graph.If the production possibilities curve for an economy is at CD but the economy is operating at point X,the reasons are most likely to be:
A) technological progress and industrial change.
B) increases in the quantity and the quality of resources.
C) improvement in labour productivity and the number of worker-hours.
D) lack of full employment and inefficient allocation of resources.
سؤال
سؤال
سؤال
سؤال
Refer to the above diagram.The most likely cause of a shift from AB to CD would be a(n):
A) increase in productivity.
B) increase in the price level.
C) decrease in the size of the labour force.
D) recession.
سؤال
سؤال
سؤال
Refer to the above diagram.Assume a nation's current production possibilities are represented by the curve AB.Positive economic growth would best be indicated by a:
A) shift in the curve from AB to CD.
B) shift in the curve from AB to EF.
C) movement from point 1 to point 2.
D) movement from point 3 to point 4.
سؤال
سؤال
سؤال
سؤال
سؤال
سؤال
سؤال
سؤال
سؤال
سؤال
سؤال
سؤال
سؤال
سؤال
سؤال
سؤال
سؤال
سؤال
سؤال
سؤال

فتح الحزمة
قم بالتسجيل لفتح البطاقات في هذه المجموعة!
Unlock Deck
Unlock Deck
1/112
العب
ملء الشاشة (f)
Deck 8: Economic Growth
1
Refer to the above table.Between years 1 and 2,real GDP grew by _______ percent in Italy:
A) 3
B) 4
C) 5
D) 10
5
2
Assume that in 2012 the nominal GDP was $350 billion and in 2013 it was $375 billion.On the basis of this information we:
A) cannot make a meaningful comparison of the economy's performance in 2013 relative to 2012.
B) can conclude that the economy was achieving real economic growth.
C) can conclude that real GDP was higher in 2012 than in 2013.
D) can conclude that real GDP was lower in 2012 than in 2013.
A) cannot make a meaningful comparison of the economy's performance in 2013 relative to 2012.
B) can conclude that the economy was achieving real economic growth.
C) can conclude that real GDP was higher in 2012 than in 2013.
D) can conclude that real GDP was lower in 2012 than in 2013.
cannot make a meaningful comparison of the economy's performance in 2013 relative to 2012.
3
The rate of economic growth is best defined as the:
A) increase in investment as a percentage of GDP over time.
B) percentage increase in nominal GDP over time.
C) percentage increase in real GDP over time.
D) percentage increase in the quantity and quality of capital,human,and natural resources which occurs over time.
A) increase in investment as a percentage of GDP over time.
B) percentage increase in nominal GDP over time.
C) percentage increase in real GDP over time.
D) percentage increase in the quantity and quality of capital,human,and natural resources which occurs over time.
percentage increase in real GDP over time.
4
Over a year,a nation's GDP at current prices rose by 15 percent while the price index increased from 100 to 110.GDP at constant prices rose by about:
A) 3 percent.
B) 5 percent.
C) 7 percent.
D) 9 percent.
A) 3 percent.
B) 5 percent.
C) 7 percent.
D) 9 percent.
فتح الحزمة
افتح القفل للوصول البطاقات البالغ عددها 112 في هذه المجموعة.
فتح الحزمة
k this deck
5
Which would be the best economic measure to compare standards of living among nations over time?
A) changes in labour productivity
B) changes in real domestic output
C) changes in real GDP per capita
D) changes in nominal income per capita
A) changes in labour productivity
B) changes in real domestic output
C) changes in real GDP per capita
D) changes in nominal income per capita
فتح الحزمة
افتح القفل للوصول البطاقات البالغ عددها 112 في هذه المجموعة.
فتح الحزمة
k this deck
6
Refer to the above table,per capita GDP was about:
A) $105 in year 3 in Italy.
B) $303 in year 3 in China.
C) $200 in year 1 in China
D) $5 in year 2 in Italy.
فتح الحزمة
افتح القفل للوصول البطاقات البالغ عددها 112 في هذه المجموعة.
فتح الحزمة
k this deck
7
Real GDP was $4,719 billion in Year 1 and $4,848 billion in Year 2.In contrast,real GDP per capita in Year 1 was $19,261,but in Year 2 it was only $19,162.Why did one measure increase while the other measure decreased?
A) Real GDP indicates the level of industrial production and provides a measure of the economic strength of the nation;it is the only valid measure of economic growth.
B) Inflation occurred during this period;therefore the two measures are not comparable.
C) Population increased during this time period so real GDP per capita data reflect this change.
D) Real GDP per capita measures changes in labour productivity that are not captured by a simple measure like real GDP.
فتح الحزمة
افتح القفل للوصول البطاقات البالغ عددها 112 في هذه المجموعة.
فتح الحزمة
k this deck
8
If an economy's real GDP doubles in fourteen years,then the average annual rate of growth in real GDP is about:
A) 3 percent.
B) 4 percent.
C) 5 percent.
D) 6 percent.
A) 3 percent.
B) 4 percent.
C) 5 percent.
D) 6 percent.
فتح الحزمة
افتح القفل للوصول البطاقات البالغ عددها 112 في هذه المجموعة.
فتح الحزمة
k this deck
9
Other things being equal,all of the following would cause a rise in a country's real per capita GDP,except a(n):
A) increase in the general price level.
B) decrease in the population size.
C) increase in labour productivity.
D) decrease in imports.
A) increase in the general price level.
B) decrease in the population size.
C) increase in labour productivity.
D) decrease in imports.
فتح الحزمة
افتح القفل للوصول البطاقات البالغ عددها 112 في هذه المجموعة.
فتح الحزمة
k this deck
10
If a nation's real GDP is growing by 3 percent per year,its real domestic output will double in approximately:
A) 21 years.
B) 23 years.
C) 29 years.
D) 42 years.
A) 21 years.
B) 23 years.
C) 29 years.
D) 42 years.
فتح الحزمة
افتح القفل للوصول البطاقات البالغ عددها 112 في هذه المجموعة.
فتح الحزمة
k this deck
11
Economic growth is best defined as an increase in:
A) either real GDP or real GDP per capita.
B) nominal GDP.
C) total consumption expenditures.
D) wealth in the economy.
A) either real GDP or real GDP per capita.
B) nominal GDP.
C) total consumption expenditures.
D) wealth in the economy.
فتح الحزمة
افتح القفل للوصول البطاقات البالغ عددها 112 في هذه المجموعة.
فتح الحزمة
k this deck
12
Growth is advantageous to a nation because it:
A) promotes faster population growth.
B) lessens the burden of scarcity.
C) eliminates the economizing problem.
D) slows the growth of wants.
A) promotes faster population growth.
B) lessens the burden of scarcity.
C) eliminates the economizing problem.
D) slows the growth of wants.
فتح الحزمة
افتح القفل للوصول البطاقات البالغ عددها 112 في هذه المجموعة.
فتح الحزمة
k this deck
13
Real GDP was $9,950 billion in Year 1 and $10,270 billion in Year 2.The population rose from 270 million in Year 1 to 275 million in Year 2.What was the approximate increase in real GDP per capita rate from Year 1 to Year 2?
A) 1.3 percent
B) 2.1 percent
C) 3.3 percent
D) 4.2 percent
A) 1.3 percent
B) 2.1 percent
C) 3.3 percent
D) 4.2 percent
فتح الحزمة
افتح القفل للوصول البطاقات البالغ عددها 112 في هذه المجموعة.
فتح الحزمة
k this deck
14
Real GDP was $9,950 billion in Year 1 and $10,270 billion in Year 2.What was the approximate rate of economic growth from Year 1 to Year 2?
A) 1.6 percent
B) 2.4 percent
C) 3.2 percent
D) 4.3 percent
A) 1.6 percent
B) 2.4 percent
C) 3.2 percent
D) 4.3 percent
فتح الحزمة
افتح القفل للوصول البطاقات البالغ عددها 112 في هذه المجموعة.
فتح الحزمة
k this deck
15
Real GDP per capita is found by:
A) adding real GDP and population.
B) subtracting population from real GDP.
C) dividing real GDP by population.
D) dividing population by real GDP.
A) adding real GDP and population.
B) subtracting population from real GDP.
C) dividing real GDP by population.
D) dividing population by real GDP.
فتح الحزمة
افتح القفل للوصول البطاقات البالغ عددها 112 في هذه المجموعة.
فتح الحزمة
k this deck
16
Refer to the above table.Between years 1 and 2,real GDP per capita grew by _____ percent in Italy:
A) 3
B) 4
C) 5
D) 10
فتح الحزمة
افتح القفل للوصول البطاقات البالغ عددها 112 في هذه المجموعة.
فتح الحزمة
k this deck
17
Nominal GDP was $9,500 billion in Year 1 and $10,000 billion in Year 2.The GDP price index was 170 in Year 1 and 175 in Year 2.Between Years 1 and 2,the rate of growth in real GDP was approximately:
A) 1.6 percent.
B) 2.3 percent.
C) 4.4 percent.
D) 5.3 percent.
A) 1.6 percent.
B) 2.3 percent.
C) 4.4 percent.
D) 5.3 percent.
فتح الحزمة
افتح القفل للوصول البطاقات البالغ عددها 112 في هذه المجموعة.
فتح الحزمة
k this deck
18
Refer to the above table,between years 2 and 3:
A) Italy's real GDP grew more rapidly than China's real GDP.
B) real GDP fell in China.
C) population growth reduced Italy's real GDP growth to zero.
D) population fell in Italy's.
فتح الحزمة
افتح القفل للوصول البطاقات البالغ عددها 112 في هذه المجموعة.
فتح الحزمة
k this deck
19
The best measure of economic growth adjusted for the population of a nation is the increase in:
A) aggregate demand over time.
B) real GDP per worker over time.
C) real GDP per capita over time.
D) real GDP per dollar of capital stock over time.
A) aggregate demand over time.
B) real GDP per worker over time.
C) real GDP per capita over time.
D) real GDP per dollar of capital stock over time.
فتح الحزمة
افتح القفل للوصول البطاقات البالغ عددها 112 في هذه المجموعة.
فتح الحزمة
k this deck
20
Suppose nominal GDP in 1996 was $100 billion and in 1998 it was $260 billion.The general price index in 1996 was 100 and in 1998 it was 180.Between 1996 and 1998 the real GDP rose by:
A) 160 percent.
B) 44 percent.
C) 37 percent.
D) 12 percent.
A) 160 percent.
B) 44 percent.
C) 37 percent.
D) 12 percent.
فتح الحزمة
افتح القفل للوصول البطاقات البالغ عددها 112 في هذه المجموعة.
فتح الحزمة
k this deck
21
Which of the following is not a supply factor in economic growth?
A) the stock of capital
B) technological advance
C) the size and quality of the labour force
D) full employment
A) the stock of capital
B) technological advance
C) the size and quality of the labour force
D) full employment
فتح الحزمة
افتح القفل للوصول البطاقات البالغ عددها 112 في هذه المجموعة.
فتح الحزمة
k this deck
22
If a nation's real GDP is growing by 5 percent per year,its real GDP will double in approximately:
A) 22 years.
B) 20 years.
C) 14 years.
D) 8 years.
A) 22 years.
B) 20 years.
C) 14 years.
D) 8 years.
فتح الحزمة
افتح القفل للوصول البطاقات البالغ عددها 112 في هذه المجموعة.
فتح الحزمة
k this deck
23
Which is an efficiency factor in economic growth?
A) an efficient allocation of resources
B) natural resources
C) the quantity and quality of labour
D) technological knowledge
A) an efficient allocation of resources
B) natural resources
C) the quantity and quality of labour
D) technological knowledge
فتح الحزمة
افتح القفل للوصول البطاقات البالغ عددها 112 في هذه المجموعة.
فتح الحزمة
k this deck
24
Which is best considered an efficiency factor in economic growth?
A) the quantity of human resources
B) the quality of human resources
C) the quantity of natural resources
D) the full employment of resources
A) the quantity of human resources
B) the quality of human resources
C) the quantity of natural resources
D) the full employment of resources
فتح الحزمة
افتح القفل للوصول البطاقات البالغ عددها 112 في هذه المجموعة.
فتح الحزمة
k this deck
25
Which is a demand factor in economic growth?
A) more human and natural resources
B) technological progress and innovation
C) an increase in the economy's stock of capital goods
D) an increase in total spending in the economy
A) more human and natural resources
B) technological progress and innovation
C) an increase in the economy's stock of capital goods
D) an increase in total spending in the economy
فتح الحزمة
افتح القفل للوصول البطاقات البالغ عددها 112 في هذه المجموعة.
فتح الحزمة
k this deck
26
The different starting dates for modern economic growth in different parts of the world are the main cause of:
A) today's small differences in per capita GDP levels around the world.
B) today's large differences in per capita GDP levels around the world.
C) today's small differences in nominal GDP levels around the world.
D) today's large differences in population levels around the world.
A) today's small differences in per capita GDP levels around the world.
B) today's large differences in per capita GDP levels around the world.
C) today's small differences in nominal GDP levels around the world.
D) today's large differences in population levels around the world.
فتح الحزمة
افتح القفل للوصول البطاقات البالغ عددها 112 في هذه المجموعة.
فتح الحزمة
k this deck
27
The average living standards in Canada compared to Africa are much higher because:
A) the economic growth has occurred for nearly two centuries in Africa compared to a few decades in Canada.
B) the economic growth has occurred for nearly two centuries in Canada compared to more than two centuries in Africa.
C) the economic growth differences have no relationship to the differences in the average standards of living.
D) the economic growth has occurred for nearly two centuries in Canada compared to a few decades in Africa.
فتح الحزمة
افتح القفل للوصول البطاقات البالغ عددها 112 في هذه المجموعة.
فتح الحزمة
k this deck
28
The countries which have begun modern economic growth later than the others can catch up because:
A) for them,it is quicker to adopt technology rather than inventing one.
B) for them,it is harder to adopt technology rather than inventing one.
C) for them,it is as hard to adopt technology as it is to invent one.
D) for them,it is very easy to invent a new technology with lower cost.
A) for them,it is quicker to adopt technology rather than inventing one.
B) for them,it is harder to adopt technology rather than inventing one.
C) for them,it is as hard to adopt technology as it is to invent one.
D) for them,it is very easy to invent a new technology with lower cost.
فتح الحزمة
افتح القفل للوصول البطاقات البالغ عددها 112 في هذه المجموعة.
فتح الحزمة
k this deck
29
Compared to the leader countries,the follower countries can grow at a faster rate because:
A) follower countries have a hard time adopting a technology.
B) leader countries cannot grow anymore.
C) follower countries can skip past many stages of technology that the leader countries had to pass through.
D) leader countries can skip past many stages of technology that the follower countries had to pass through.
فتح الحزمة
افتح القفل للوصول البطاقات البالغ عددها 112 في هذه المجموعة.
فتح الحزمة
k this deck
30
If the economy's real GDP doubles in 18 years,we can:
A) not say anything about the average annual rate of growth.
B) conclude that its average annual rate of growth is about 5.5 percent.
C) conclude that its average annual rate of growth is about 2 percent.
D) conclude that its average annual rate of growth is about 4 percent.
A) not say anything about the average annual rate of growth.
B) conclude that its average annual rate of growth is about 5.5 percent.
C) conclude that its average annual rate of growth is about 2 percent.
D) conclude that its average annual rate of growth is about 4 percent.
فتح الحزمة
افتح القفل للوصول البطاقات البالغ عددها 112 في هذه المجموعة.
فتح الحزمة
k this deck
31
Which is best considered a supply factor for long-run economic growth?
A) government spending
B) the stock of capital goods
C) full employment of resources
D) personal consumption expenditures
A) government spending
B) the stock of capital goods
C) full employment of resources
D) personal consumption expenditures
فتح الحزمة
افتح القفل للوصول البطاقات البالغ عددها 112 في هذه المجموعة.
فتح الحزمة
k this deck
32
Refer to the above diagram.If the production possibilities curve of an economy shifts from AB to CD,it is most likely the result of what factor affecting economic growth?
A) a supply factor
B) a demand factor
C) an efficiency factor
D) an allocation factor
فتح الحزمة
افتح القفل للوصول البطاقات البالغ عددها 112 في هذه المجموعة.
فتح الحزمة
k this deck
33
Economic well-being in Canada is understated by growth rates because they:
A) account for pollution expenditures.
B) account for improvement in products.
C) account for illegal activity.
D) don't account for the added leisure of labour.
A) account for pollution expenditures.
B) account for improvement in products.
C) account for illegal activity.
D) don't account for the added leisure of labour.
فتح الحزمة
افتح القفل للوصول البطاقات البالغ عددها 112 في هذه المجموعة.
فتح الحزمة
k this deck
34
Which of the following countries has achieved the highest average annual rate of growth of real GDP from 1960 to 2007?
A) United Kingdom
B) South Korea
C) Canada
D) United States
A) United Kingdom
B) South Korea
C) Canada
D) United States
فتح الحزمة
افتح القفل للوصول البطاقات البالغ عددها 112 في هذه المجموعة.
فتح الحزمة
k this deck
35
Economic well-being in Canada is overstated by growth rates because they don't account for:
A) increases in services.
B) increase in leisure time.
C) improvements in product quality.
D) adverse effects on the environment.
A) increases in services.
B) increase in leisure time.
C) improvements in product quality.
D) adverse effects on the environment.
فتح الحزمة
افتح القفل للوصول البطاقات البالغ عددها 112 في هذه المجموعة.
فتح الحزمة
k this deck
36
A supply factor in economic growth would be:
A) a fall in the efficient use of resources.
B) a rise in the rate of resource depletion.
C) an increase in the quantity of labour.
D) an increase in consumption spending.
A) a fall in the efficient use of resources.
B) a rise in the rate of resource depletion.
C) an increase in the quantity of labour.
D) an increase in consumption spending.
فتح الحزمة
افتح القفل للوصول البطاقات البالغ عددها 112 في هذه المجموعة.
فتح الحزمة
k this deck
37
Refer to the above diagram.If the production possibilities curve for an economy is at AB but the economy is operating at point 4,the reasons are most likely to be because of:
A) supply and environmental factors.
B) demand and efficiency factors.
C) labour inputs and labour productivity.
D) technological progress.
فتح الحزمة
افتح القفل للوصول البطاقات البالغ عددها 112 في هذه المجموعة.
فتح الحزمة
k this deck
38
Which of the following statements is correct?
A) between 1961 to 2011,Canadian real GDP has grown at about 3.3 percent per year and real GDP per capita has grown at about 2.1 percent per year.
B) between 1961 to 2011,Canadian real GDP has grown at about 2.1 percent per year and real GDP per capita has grown at about 3.3 percent per year.
C) between 1961 to 2011,Canadian real GDP and real GDP per capita have both grown at about 4 percent per year.
D) between 1961 to 2011,Canadian real GDP and real GDP per capita have both grown at about 2 percent per year.
فتح الحزمة
افتح القفل للوصول البطاقات البالغ عددها 112 في هذه المجموعة.
فتح الحزمة
k this deck
39
Economic well-being in Canada is understated by growth rates because they:
A) account for pollution expenditures.
B) don't account for improvement in products.
C) account for illegal activity.
D) don't account for the slowdown in productivity.
A) account for pollution expenditures.
B) don't account for improvement in products.
C) account for illegal activity.
D) don't account for the slowdown in productivity.
فتح الحزمة
افتح القفل للوصول البطاقات البالغ عددها 112 في هذه المجموعة.
فتح الحزمة
k this deck
40
Refer to the above diagram.If the production possibilities curve of an economy shifts from AB to EF,it is most likely the result of what factor affecting economic growth?
A) a supply factor
B) a demand factor
C) an efficiency factor
D) an allocation factor
فتح الحزمة
افتح القفل للوصول البطاقات البالغ عددها 112 في هذه المجموعة.
فتح الحزمة
k this deck
41
Refer to the diagram below.A shift in the production possibilities curve from AB to CD is most likely due to:
A) the use of the economy's resources in an efficient way.
B) an increase in the spending of business and consumers.
C) an increase in government purchase of the economy's output.
D) an increase in the quantity and quality of labour resources.
A) the use of the economy's resources in an efficient way.
B) an increase in the spending of business and consumers.
C) an increase in government purchase of the economy's output.
D) an increase in the quantity and quality of labour resources.
فتح الحزمة
افتح القفل للوصول البطاقات البالغ عددها 112 في هذه المجموعة.
فتح الحزمة
k this deck
42
Refer to the above diagram.If there is a movement away from the full employment of resources in an economy with production possibilities curve AB,this can be shown by:
A) a shift of the curve from AB to CD.
B) a movement from point 3 to point 1.
C) a movement from point 2 to point 4.
D) point 5 in the diagram.
فتح الحزمة
افتح القفل للوصول البطاقات البالغ عددها 112 في هذه المجموعة.
فتح الحزمة
k this deck
43
Suppose total output (real GDP)is $10,000 and worker-hours are 20,000.We can conclude that:
A) real GDP per capita must be $200,000.
B) the price-level index must be less than 100.
C) labour productivity must be 0.5.
D) nominal GDP must be between $10,000 and $20,000.
A) real GDP per capita must be $200,000.
B) the price-level index must be less than 100.
C) labour productivity must be 0.5.
D) nominal GDP must be between $10,000 and $20,000.
فتح الحزمة
افتح القفل للوصول البطاقات البالغ عددها 112 في هذه المجموعة.
فتح الحزمة
k this deck
44
Suppose total output (real GDP)is $4000 and labour productivity is 8.We can conclude that:
A) real GDP per capita must be $500.
B) the price-level index must be greater than 100.
C) nominal GDP must be $500.
D) the number of worker-hours must be 500.
A) real GDP per capita must be $500.
B) the price-level index must be greater than 100.
C) nominal GDP must be $500.
D) the number of worker-hours must be 500.
فتح الحزمة
افتح القفل للوصول البطاقات البالغ عددها 112 في هذه المجموعة.
فتح الحزمة
k this deck
45
Economic growth can be portrayed as a(n):
A) outward shift of the production possibilities curve.
B) inward shift of the production possibilities curve.
C) movement from a point on to a point inside a production possibilities curve.
D) movement from one point to another point on a production possibilities curve.
A) outward shift of the production possibilities curve.
B) inward shift of the production possibilities curve.
C) movement from a point on to a point inside a production possibilities curve.
D) movement from one point to another point on a production possibilities curve.
فتح الحزمة
افتح القفل للوصول البطاقات البالغ عددها 112 في هذه المجموعة.
فتح الحزمة
k this deck
46
If the number of worker-hours in an economy is 100 and its labour productivity is 5 units of output per worker-hour,the economy's real GDP:
A) is $20.
B) is $500.
C) is $5000.
D) cannot be calculated.
A) is $20.
B) is $500.
C) is $5000.
D) cannot be calculated.
فتح الحزمة
افتح القفل للوصول البطاقات البالغ عددها 112 في هذه المجموعة.
فتح الحزمة
k this deck
47
Assume that an economy has 1500 workers,each working 2000 hours per year.If the average real output per worker-hour is $20,then total output or real GDP will be:
A) $3 million.
B) $30 million.
C) $45 million.
D) $60 million.
A) $3 million.
B) $30 million.
C) $45 million.
D) $60 million.
فتح الحزمة
افتح القفل للوصول البطاقات البالغ عددها 112 في هذه المجموعة.
فتح الحزمة
k this deck
48
An outward shift of a nation's production possibilities curve:
A) ensures the nation of an increase in real GDP per capita.
B) could increase the nation's real GDP,but not the real- GDP per capita.
C) could reduce the nation's real GDP.
D) corresponds to a leftward shift of the nation's long-run aggregate supply curve.
A) ensures the nation of an increase in real GDP per capita.
B) could increase the nation's real GDP,but not the real- GDP per capita.
C) could reduce the nation's real GDP.
D) corresponds to a leftward shift of the nation's long-run aggregate supply curve.
فتح الحزمة
افتح القفل للوصول البطاقات البالغ عددها 112 في هذه المجموعة.
فتح الحزمة
k this deck
49
Refer to the above graph.If the production possibilities curve of an economy shifts from AB to CD,it is most likely caused by:
A) a decrease in the price level.
B) allocative efficiency.
C) technological progress.
D) full employment of resources.
فتح الحزمة
افتح القفل للوصول البطاقات البالغ عددها 112 في هذه المجموعة.
فتح الحزمة
k this deck
50
Which of the following would not be expected to increase labour productivity?
A) technological advance
B) the acquisition of more education and training by the labour force
C) an increase in the size of the labour force
D) the realization of economies of scale
A) technological advance
B) the acquisition of more education and training by the labour force
C) an increase in the size of the labour force
D) the realization of economies of scale
فتح الحزمة
افتح القفل للوصول البطاقات البالغ عددها 112 في هذه المجموعة.
فتح الحزمة
k this deck
51
Labour productivity may best be defined as:
A) total output/worker-hours.
B) nominal GDP minus real GDP.
C) the ratio of real capital to worker-hours.
D) the annual increase in nominal GDP per worker.
A) total output/worker-hours.
B) nominal GDP minus real GDP.
C) the ratio of real capital to worker-hours.
D) the annual increase in nominal GDP per worker.
فتح الحزمة
افتح القفل للوصول البطاقات البالغ عددها 112 في هذه المجموعة.
فتح الحزمة
k this deck
52
Refer to the above diagram.Realized economic growth is best represented by a:
A) shift in the production possibilities curve from y on AB to x on CD.
B) move from x on AB to y on CD.
C) shift in the production possibilities curve from CD to AB.
D) move from x to z along AB.
فتح الحزمة
افتح القفل للوصول البطاقات البالغ عددها 112 في هذه المجموعة.
فتح الحزمة
k this deck
53
Refer to the above graph.If the production possibilities curve for an economy is at CD but the economy is operating at point X,the reasons are most likely to be:
A) technological progress and industrial change.
B) increases in the quantity and the quality of resources.
C) improvement in labour productivity and the number of worker-hours.
D) lack of full employment and inefficient allocation of resources.
فتح الحزمة
افتح القفل للوصول البطاقات البالغ عددها 112 في هذه المجموعة.
فتح الحزمة
k this deck
54
Labour productivity is measured by:
A) the ratio of capital to labour.
B) real output per worker hour.
C) real output per capital.
D) the ratio of worker hours to nominal GDP.
A) the ratio of capital to labour.
B) real output per worker hour.
C) real output per capital.
D) the ratio of worker hours to nominal GDP.
فتح الحزمة
افتح القفل للوصول البطاقات البالغ عددها 112 في هذه المجموعة.
فتح الحزمة
k this deck
55
Real GDP or total output in any year is equal to:
A) labour inputs divided by resource outputs.
B) labour productivity multiplied by real output.
C) worker-hours multiplied by labour productivity.
D) worker-hours divided by labour productivity.
A) labour inputs divided by resource outputs.
B) labour productivity multiplied by real output.
C) worker-hours multiplied by labour productivity.
D) worker-hours divided by labour productivity.
فتح الحزمة
افتح القفل للوصول البطاقات البالغ عددها 112 في هذه المجموعة.
فتح الحزمة
k this deck
56
The achievement of full employment through time will:
A) diminish labour productivity.
B) reduce the level of investment as a percentage of GDP.
C) increase the rate of growth of real GDP.
D) have no impact on the rate of growth of real GDP.
A) diminish labour productivity.
B) reduce the level of investment as a percentage of GDP.
C) increase the rate of growth of real GDP.
D) have no impact on the rate of growth of real GDP.
فتح الحزمة
افتح القفل للوصول البطاقات البالغ عددها 112 في هذه المجموعة.
فتح الحزمة
k this deck
57
Refer to the above diagram.The most likely cause of a shift from AB to CD would be a(n):
A) increase in productivity.
B) increase in the price level.
C) decrease in the size of the labour force.
D) recession.
فتح الحزمة
افتح القفل للوصول البطاقات البالغ عددها 112 في هذه المجموعة.
فتح الحزمة
k this deck
58
Economic growth can best be portrayed as a:
A) leftward shift of the production possibilities curve.
B) movement from a point inside to a point outside of the production possibilities curve.
C) movement from a point near the vertical axis to a point near the horizontal axis on the production possibilities curve.
D) rightward shift of the production possibilities curve.
فتح الحزمة
افتح القفل للوصول البطاقات البالغ عددها 112 في هذه المجموعة.
فتح الحزمة
k this deck
59
Which of the following is correct?
A) total output = labour productivity/worker-hours
B) labour productivity = worker-hours/total output
C) total output = worker-hours × labour productivity
D) worker-hours = labour productivity × total output
A) total output = labour productivity/worker-hours
B) labour productivity = worker-hours/total output
C) total output = worker-hours × labour productivity
D) worker-hours = labour productivity × total output
فتح الحزمة
افتح القفل للوصول البطاقات البالغ عددها 112 في هذه المجموعة.
فتح الحزمة
k this deck
60
Refer to the above diagram.Assume a nation's current production possibilities are represented by the curve AB.Positive economic growth would best be indicated by a:
A) shift in the curve from AB to CD.
B) shift in the curve from AB to EF.
C) movement from point 1 to point 2.
D) movement from point 3 to point 4.
فتح الحزمة
افتح القفل للوصول البطاقات البالغ عددها 112 في هذه المجموعة.
فتح الحزمة
k this deck
61
The most important contributor to increases in the productivity of Canadian labour is:
A) the reallocation of labour from agriculture to manufacturing.
B) improvements in labour quality.
C) increases in the quantity of capital.
D) technological advance.
A) the reallocation of labour from agriculture to manufacturing.
B) improvements in labour quality.
C) increases in the quantity of capital.
D) technological advance.
فتح الحزمة
افتح القفل للوصول البطاقات البالغ عددها 112 في هذه المجموعة.
فتح الحزمة
k this deck
62
Over the past half century the growth of real GDP in Canada has been caused primarily by:
A) a falling price level.
B) the reallocation of labour from manufacturing to agriculture.
C) increases in the productivity of labour.
D) the use of fewer inputs of labour.
A) a falling price level.
B) the reallocation of labour from manufacturing to agriculture.
C) increases in the productivity of labour.
D) the use of fewer inputs of labour.
فتح الحزمة
افتح القفل للوصول البطاقات البالغ عددها 112 في هذه المجموعة.
فتح الحزمة
k this deck
63
The historical reallocation of labour from agriculture to manufacturing in Canada has:
A) been inflationary.
B) had no effect upon the average productivity of labour.
C) increased the average productivity of labour.
D) reduced the average productivity of labour.
A) been inflationary.
B) had no effect upon the average productivity of labour.
C) increased the average productivity of labour.
D) reduced the average productivity of labour.
فتح الحزمة
افتح القفل للوصول البطاقات البالغ عددها 112 في هذه المجموعة.
فتح الحزمة
k this deck
64
Between 1945 - 2011,the labour force in Canada has increased by about:
A) 13.5 million workers.
B) 18 million workers.
C) 4.5 million workers.
D) 15 million workers.
A) 13.5 million workers.
B) 18 million workers.
C) 4.5 million workers.
D) 15 million workers.
فتح الحزمة
افتح القفل للوصول البطاقات البالغ عددها 112 في هذه المجموعة.
فتح الحزمة
k this deck
65
Between 1946 - 2011,the annual Canadian multifactor productivity has increased by about:
A) 4%
B) 2%
C) 5%
D) 7%
A) 4%
B) 2%
C) 5%
D) 7%
فتح الحزمة
افتح القفل للوصول البطاقات البالغ عددها 112 في هذه المجموعة.
فتح الحزمة
k this deck
66
Which of the following has made the largest contribution to the growth of labour productivity in Canada?
A) technological advance
B) education and training of labour
C) economies of scale
D) improved resource allocation
A) technological advance
B) education and training of labour
C) economies of scale
D) improved resource allocation
فتح الحزمة
افتح القفل للوصول البطاقات البالغ عددها 112 في هذه المجموعة.
فتح الحزمة
k this deck
67
The movement of workers from lower productivity jobs to higher productivity jobs would be an example of a(n):
A) technological advance.
B) network effects.
C) simultaneous consumption.
D) improved resource allocation.
A) technological advance.
B) network effects.
C) simultaneous consumption.
D) improved resource allocation.
فتح الحزمة
افتح القفل للوصول البطاقات البالغ عددها 112 في هذه المجموعة.
فتح الحزمة
k this deck
68
During the last decade,the innovations in computers and telecommunications,together with global competition,have resulted in:
A) rational expectations theory.
B) lower growth in capital stock.
C) higher growth in labour force.
D) higher productivity growth.
A) rational expectations theory.
B) lower growth in capital stock.
C) higher growth in labour force.
D) higher productivity growth.
فتح الحزمة
افتح القفل للوصول البطاقات البالغ عددها 112 في هذه المجموعة.
فتح الحزمة
k this deck
69
Which of the following would be a source of economies of scale?
A) the social environment
B) the quantity of labour
C) decreasing returns
D) more specialized inputs
A) the social environment
B) the quantity of labour
C) decreasing returns
D) more specialized inputs
فتح الحزمة
افتح القفل للوصول البطاقات البالغ عددها 112 في هذه المجموعة.
فتح الحزمة
k this deck
70
Real GDP in any year is equal to:
A) the quantity of labour divided by resource outputs.
B) labour productivity multiplied by the quality of labour.
C) worker-hours divided by labour productivity.
D) worker-hours multiplied by labour productivity.
A) the quantity of labour divided by resource outputs.
B) labour productivity multiplied by the quality of labour.
C) worker-hours divided by labour productivity.
D) worker-hours multiplied by labour productivity.
فتح الحزمة
افتح القفل للوصول البطاقات البالغ عددها 112 في هذه المجموعة.
فتح الحزمة
k this deck
71
One of the distinguishing features of the recent productivity growth is:
A) decreasing returns to scale in manufacturing.
B) the need for less specialized inputs in manufacturing.
C) technological progress from the investment in the space program.
D) technological progress from the microchip and information technology.
A) decreasing returns to scale in manufacturing.
B) the need for less specialized inputs in manufacturing.
C) technological progress from the investment in the space program.
D) technological progress from the microchip and information technology.
فتح الحزمة
افتح القفل للوصول البطاقات البالغ عددها 112 في هذه المجموعة.
فتح الحزمة
k this deck
72
Increasing returns would be a situation where a firm increases its workforce and other inputs by:
A) 10 percent and its output increases by 5 percent.
B) 5 percent and its output increase by 10 percent.
C) 8 percent and its output increases by 8 percent.
D) 12 percent and its output increases by 10 percent.
A) 10 percent and its output increases by 5 percent.
B) 5 percent and its output increase by 10 percent.
C) 8 percent and its output increases by 8 percent.
D) 12 percent and its output increases by 10 percent.
فتح الحزمة
افتح القفل للوصول البطاقات البالغ عددها 112 في هذه المجموعة.
فتح الحزمة
k this deck
73
A source of increasing returns to scale is:
A) less specialized inputs.
B) less investment in technology.
C) simultaneous consumption.
D) the labour-force participation rate.
A) less specialized inputs.
B) less investment in technology.
C) simultaneous consumption.
D) the labour-force participation rate.
فتح الحزمة
افتح القفل للوصول البطاقات البالغ عددها 112 في هذه المجموعة.
فتح الحزمة
k this deck
74
Recently,the changes in the educational attainment of the Canadian labour force indicate that the percentage of those:
A) completing high school has been rising,but the percentage of those attending university has declined.
B) attending university have increased.
C) completing college has been constant,and the percentage of those attending university has declined.
D) attending university and community colleges have decreased.
فتح الحزمة
افتح القفل للوصول البطاقات البالغ عددها 112 في هذه المجموعة.
فتح الحزمة
k this deck
75
The knowledge and skill that make for a productive worker are referred to by economists as:
A) human capital.
B) increasing returns.
C) resource allocation.
D) simultaneous consumption.
A) human capital.
B) increasing returns.
C) resource allocation.
D) simultaneous consumption.
فتح الحزمة
افتح القفل للوصول البطاقات البالغ عددها 112 في هذه المجموعة.
فتح الحزمة
k this deck
76
A nation's "infrastructure" refers to:
A) its ability to realize economies of scale.
B) its stock of technological knowledge.
C) public capital goods such as highways and utilities.
D) the productivity of its labour force.
A) its ability to realize economies of scale.
B) its stock of technological knowledge.
C) public capital goods such as highways and utilities.
D) the productivity of its labour force.
فتح الحزمة
افتح القفل للوصول البطاقات البالغ عددها 112 في هذه المجموعة.
فتح الحزمة
k this deck
77
Other things equal,in which of the following instances would the increase in labour productivity be the greatest?
A) the stock of real capital and inputs of labour increase proportionately
B) the increase in the stock of real capital exceeds the increase in inputs of labour
C) the increase in inputs of labour exceeds the increase in the stock of real capital
D) inputs of labour increase and the stock of real capital remains constant
فتح الحزمة
افتح القفل للوصول البطاقات البالغ عددها 112 في هذه المجموعة.
فتح الحزمة
k this deck
78
What economic concept would be most closely associated with a situation where an aluminum plant uses extensive computerization on the production line to reduce per-unit costs of production?
A) infrastructure
B) human capital
C) network effects
D) economies of scale
A) infrastructure
B) human capital
C) network effects
D) economies of scale
فتح الحزمة
افتح القفل للوصول البطاقات البالغ عددها 112 في هذه المجموعة.
فتح الحزمة
k this deck
79
Economies of scale indicates:
A) the idea that proprietorships are less bureaucratic and therefore more efficient than corporations.
B) public investments in highways,schools,utilities,and such.
C) the fact that large producers may be able to use more efficient technologies than smaller producers.
D) the reallocation of labour from less-productive to more-productive uses.
فتح الحزمة
افتح القفل للوصول البطاقات البالغ عددها 112 في هذه المجموعة.
فتح الحزمة
k this deck
80
Other things equal,if a full-employment economy reallocates a substantial quantity of its resources to capital goods,we would expect:
A) present consumption to rise.
B) future consumption to fall.
C) a lower rate of growth of real GDP.
D) labour productivity to rise.
A) present consumption to rise.
B) future consumption to fall.
C) a lower rate of growth of real GDP.
D) labour productivity to rise.
فتح الحزمة
افتح القفل للوصول البطاقات البالغ عددها 112 في هذه المجموعة.
فتح الحزمة
k this deck
فتح الحزمة
افتح القفل للوصول البطاقات البالغ عددها 112 في هذه المجموعة.


