Deck 13: Financial Statement Analysis
ملء الشاشة (f)
سؤال
سؤال
سؤال
سؤال
سؤال
سؤال
سؤال
سؤال
سؤال
سؤال
سؤال
سؤال
سؤال
سؤال
سؤال
سؤال
سؤال
سؤال
سؤال
سؤال
سؤال
سؤال
سؤال
سؤال
سؤال
سؤال
سؤال
سؤال
سؤال
سؤال
سؤال
سؤال
سؤال
سؤال
سؤال
سؤال
سؤال
سؤال
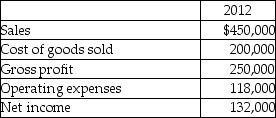
Tech Support Corporation reports the following data: 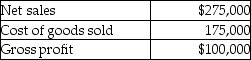 In a vertical analysis, the gross profit percentage is closest to:
A) 63%.
B) 57%.
C) 157%.
D) 36%.
In a vertical analysis, the gross profit percentage is closest to:A) 63%.
B) 57%.
C) 157%.
D) 36%.
سؤال
سؤال
سؤال
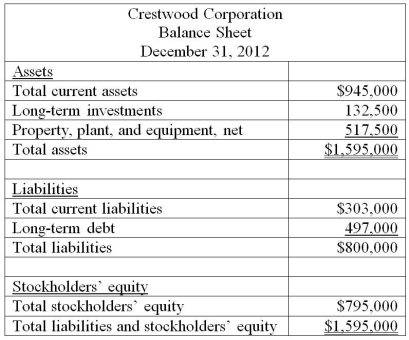
Prepare a vertical analysis for Crestwood Corporation's balance sheet to determine the component percentages of its assets, liabilities, and stockholders' equity. Round percentages to the nearest one-tenth percent.
سؤال
سؤال
سؤال
سؤال
سؤال
سؤال
سؤال
سؤال
سؤال
Given the following data: 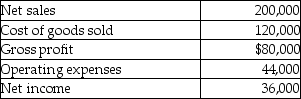 In a vertical analysis, net income would be expressed as:
A) 18%.
B) 45%.
C) 30%.
D) 82%.
In a vertical analysis, net income would be expressed as:A) 18%.
B) 45%.
C) 30%.
D) 82%.
سؤال
Given the following data: 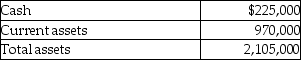 In a vertical analysis, cash would be expressed as:
A) 935%.
B) 217%.
C) 46%.
D) 11%.
In a vertical analysis, cash would be expressed as:A) 935%.
B) 217%.
C) 46%.
D) 11%.
سؤال
Prepare a vertical analysis for Winkler Corporation using the information shown below (round percentages to the nearest one-tenth percent):
سؤال
Given the following data: 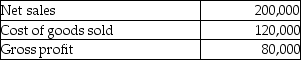 In a vertical analysis, cost of goods sold would be expressed as:
A) 166%.
B) 40%.
C) 60%.
D) 250%.
In a vertical analysis, cost of goods sold would be expressed as:A) 166%.
B) 40%.
C) 60%.
D) 250%.
سؤال
سؤال
سؤال
سؤال
Given the following data: 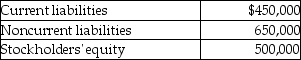 In vertical analysis, current liabilities would be expressed as:
A) 356%.
B) 90%.
C) 111%.
D) 28%.
In vertical analysis, current liabilities would be expressed as:A) 356%.
B) 90%.
C) 111%.
D) 28%.
سؤال
سؤال
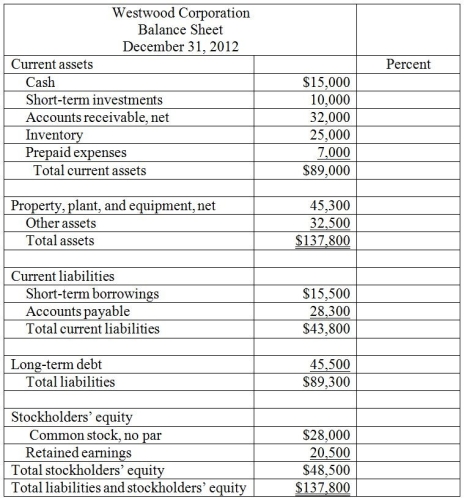
Prepare a vertical analysis for Westwood Corporation by completing the right column of the following balance sheet with the appropriate percentages. Round percentages to the nearest one-tenth percent.
سؤال
سؤال
سؤال
سؤال
سؤال
سؤال
سؤال
سؤال
سؤال
سؤال
سؤال
سؤال
سؤال
سؤال
سؤال
سؤال
سؤال
سؤال
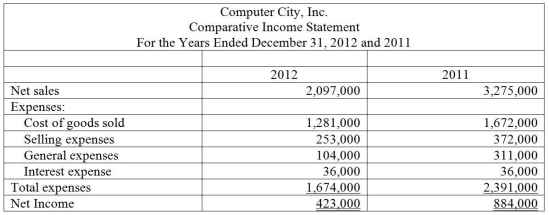
Computer City, Inc.'s comparative income statement is shown below:
 Required:
Prepare a common-size income statement for 2012 and 2011 showing the percentages for each item listed above. Round percentages to one-tenth percent.
Required:Prepare a common-size income statement for 2012 and 2011 showing the percentages for each item listed above. Round percentages to one-tenth percent.
سؤال
سؤال
سؤال

فتح الحزمة
قم بالتسجيل لفتح البطاقات في هذه المجموعة!
Unlock Deck
Unlock Deck
1/125
العب
ملء الشاشة (f)
Deck 13: Financial Statement Analysis
1
The percentage change in any individual item shown on comparative financial statements is calculated by dividing the dollar amount of the change from the base period to the current period by:
A) the amount shown for the current period.
B) the base-period amount.
C) the average of the amounts shown for the base and the current periods.
D) the amount estimated for the future period.
A) the amount shown for the current period.
B) the base-period amount.
C) the average of the amounts shown for the base and the current periods.
D) the amount estimated for the future period.
B
2
When computing trend percentages:
A) the current year is always equal to 100%.
B) the base year is always the latest year.
C) the base year is always equal to 100%.
D) the base year is equal to the current year plus the previous year divided by two.
A) the current year is always equal to 100%.
B) the base year is always the latest year.
C) the base year is always equal to 100%.
D) the base year is equal to the current year plus the previous year divided by two.
C
3
Horizontal analysis is performed on:
A) only the income statement.
B) only the balance sheet.
C) only the statement of retained earnings
D) the income statement, the balance sheet, and the statement of retained earnings.
A) only the income statement.
B) only the balance sheet.
C) only the statement of retained earnings
D) the income statement, the balance sheet, and the statement of retained earnings.
D
4
If a company has sales of $250 in 2010 and $225 in 2011, the percentage increase from 2010 to 2011 is 10%.
فتح الحزمة
افتح القفل للوصول البطاقات البالغ عددها 125 في هذه المجموعة.
فتح الحزمة
k this deck
5
Trend analysis using income statement data is widely used for predicting the future.
فتح الحزمة
افتح القفل للوصول البطاقات البالغ عددها 125 في هذه المجموعة.
فتح الحزمة
k this deck
6
A form of horizontal analysis that indicates the direction a business is taking is:
A) benchmarking.
B) economic value added analysis.
C) vertical analysis.
D) trend percentages.
A) benchmarking.
B) economic value added analysis.
C) vertical analysis.
D) trend percentages.
فتح الحزمة
افتح القفل للوصول البطاقات البالغ عددها 125 في هذه المجموعة.
فتح الحزمة
k this deck
7
The percentage change in financial statement balances is computed by dividing the dollar amount of the most recent period by the base period dollar amount.
فتح الحزمة
افتح القفل للوصول البطاقات البالغ عددها 125 في هذه المجموعة.
فتح الحزمة
k this deck
8
The primary focus of horizontal analysis is:
A) percentage changes in comparative financial statements.
B) the balance sheet only.
C) the changes in individual financial statement amounts as a percentage of some related total.
D) the change in key financial statement ratios over a certain time frame.
A) percentage changes in comparative financial statements.
B) the balance sheet only.
C) the changes in individual financial statement amounts as a percentage of some related total.
D) the change in key financial statement ratios over a certain time frame.
فتح الحزمة
افتح القفل للوصول البطاقات البالغ عددها 125 في هذه المجموعة.
فتح الحزمة
k this deck
9
Horizontal analysis and trend analysis are synonymous.
فتح الحزمة
افتح القفل للوصول البطاقات البالغ عددها 125 في هذه المجموعة.
فتح الحزمة
k this deck
10
Horizontal analysis compares financial statement items in the current period with other items in the current period.
فتح الحزمة
افتح القفل للوصول البطاقات البالغ عددها 125 في هذه المجموعة.
فتح الحزمة
k this deck
11
If a company has sales of $150 in 2010 and $225 in 2011, the percentage change from 2010 to 2011 is 50%.
فتح الحزمة
افتح القفل للوصول البطاقات البالغ عددها 125 في هذه المجموعة.
فتح الحزمة
k this deck
12
Vertical analysis highlights changes in financial statement balances from period to period.
فتح الحزمة
افتح القفل للوصول البطاقات البالغ عددها 125 في هذه المجموعة.
فتح الحزمة
k this deck
13
Trend percentages are computed only for balance sheet items.
فتح الحزمة
افتح القفل للوصول البطاقات البالغ عددها 125 في هذه المجموعة.
فتح الحزمة
k this deck
14
Period to period percentage change in comparative financial statements is often called:
A) benchmarking.
B) horizontal analysis.
C) vertical analysis.
D) common-size statements.
A) benchmarking.
B) horizontal analysis.
C) vertical analysis.
D) common-size statements.
فتح الحزمة
افتح القفل للوصول البطاقات البالغ عددها 125 في هذه المجموعة.
فتح الحزمة
k this deck
15
It is generally considered more useful to know the percentage change in financial statement amounts from year to year than to know the absolute dollar amount.
فتح الحزمة
افتح القفل للوصول البطاقات البالغ عددها 125 في هذه المجموعة.
فتح الحزمة
k this deck
16
The best way to analyze a company is by examining the financial data for several years.
فتح الحزمة
افتح القفل للوصول البطاقات البالغ عددها 125 في هذه المجموعة.
فتح الحزمة
k this deck
17
The analysis of percentage changes in comparative statements is known as:
A) economic value added analysis.
B) vertical analysis.
C) horizontal analysis.
D) benchmarking analysis.
A) economic value added analysis.
B) vertical analysis.
C) horizontal analysis.
D) benchmarking analysis.
فتح الحزمة
افتح القفل للوصول البطاقات البالغ عددها 125 في هذه المجموعة.
فتح الحزمة
k this deck
18
Horizontal analysis of financial statements is an:
A) analysis tool.
B) analysis theory
C) analysis principle.
D) analysis requirement.
A) analysis tool.
B) analysis theory
C) analysis principle.
D) analysis requirement.
فتح الحزمة
افتح القفل للوصول البطاقات البالغ عددها 125 في هذه المجموعة.
فتح الحزمة
k this deck
19
The horizontal analysis formula is the current year amount:
A) divided by the base year amount.
B) minus the base year amount divided by the base year amount.
C) minus the base year amount divided by current year amount.
D) added to the base year amount divided by the base year amount.
A) divided by the base year amount.
B) minus the base year amount divided by the base year amount.
C) minus the base year amount divided by current year amount.
D) added to the base year amount divided by the base year amount.
فتح الحزمة
افتح القفل للوصول البطاقات البالغ عددها 125 في هذه المجموعة.
فتح الحزمة
k this deck
20
Horizontal analysis is most closely related to:
A) trend analysis.
B) economic value added analysis.
C) vertical analysis.
D) benchmarking.
A) trend analysis.
B) economic value added analysis.
C) vertical analysis.
D) benchmarking.
فتح الحزمة
افتح القفل للوصول البطاقات البالغ عددها 125 في هذه المجموعة.
فتح الحزمة
k this deck
21
Vertical analysis is a less sophisticated analysis tool than horizontal analysis.
فتح الحزمة
افتح القفل للوصول البطاقات البالغ عددها 125 في هذه المجموعة.
فتح الحزمة
k this deck
22
Matrix analysis expresses each item on a financial statement in terms of a percent of a base amount.
فتح الحزمة
افتح القفل للوصول البطاقات البالغ عددها 125 في هذه المجموعة.
فتح الحزمة
k this deck
23
Which of the following is typically used as the base in a vertical analysis of a balance sheet?
A) Total liabilities
B) Cash
C) Total assets
D) Gross sales
A) Total liabilities
B) Cash
C) Total assets
D) Gross sales
فتح الحزمة
افتح القفل للوصول البطاقات البالغ عددها 125 في هذه المجموعة.
فتح الحزمة
k this deck
24
When performing a vertical analysis of the income statement, each item is stated as a percentage of net income.
فتح الحزمة
افتح القفل للوصول البطاقات البالغ عددها 125 في هذه المجموعة.
فتح الحزمة
k this deck
25
Common-size analysis is also known as:
A) Trend analysis.
B) Ratio analysis.
C) Vertical analysis.
D) Matrix analysis.
A) Trend analysis.
B) Ratio analysis.
C) Vertical analysis.
D) Matrix analysis.
فتح الحزمة
افتح القفل للوصول البطاقات البالغ عددها 125 في هذه المجموعة.
فتح الحزمة
k this deck
26
Vertical analysis compares an item on the financial statement to the same item in a prior period.
فتح الحزمة
افتح القفل للوصول البطاقات البالغ عددها 125 في هذه المجموعة.
فتح الحزمة
k this deck
27
A company's net income as a percentage of sales is 15%. Using vertical analysis, the cost of goods sold as a percentage of sales must be 85%.
فتح الحزمة
افتح القفل للوصول البطاقات البالغ عددها 125 في هذه المجموعة.
فتح الحزمة
k this deck
28
Which of the following is typically used as the base in a vertical analysis of an income statement?
A) Cash
B) Inventory
C) Net income
D) Net sales
A) Cash
B) Inventory
C) Net income
D) Net sales
فتح الحزمة
افتح القفل للوصول البطاقات البالغ عددها 125 في هذه المجموعة.
فتح الحزمة
k this deck
29
A financial statement item expressed as a percentage of a base amount is a result of:
A) horizontal analysis.
B) ratio analysis.
C) vertical analysis.
D) comparative analysis.
A) horizontal analysis.
B) ratio analysis.
C) vertical analysis.
D) comparative analysis.
فتح الحزمة
افتح القفل للوصول البطاقات البالغ عددها 125 في هذه المجموعة.
فتح الحزمة
k this deck
30
When comparing companies of different sizes, vertical analysis would be a useful tool.
فتح الحزمة
افتح القفل للوصول البطاقات البالغ عددها 125 في هذه المجموعة.
فتح الحزمة
k this deck
31
A vertical analysis is primarily concerned with:
A) the dollar amount of the change in various financial statement amounts from year to year.
B) individual financial statement items expressed as a percentage of a base (which represents 100%).
C) percentage changes in the balances shown in comparative financial statements.
D) the change in key financial statement ratios over a specified period of time.
فتح الحزمة
افتح القفل للوصول البطاقات البالغ عددها 125 في هذه المجموعة.
فتح الحزمة
k this deck
32
Expressing cash and cash equivalents as a percentage of total assets is an example of:
A) horizontal analysis.
B) economic value added.
C) ratio analysis.
D) vertical analysis.
A) horizontal analysis.
B) economic value added.
C) ratio analysis.
D) vertical analysis.
فتح الحزمة
افتح القفل للوصول البطاقات البالغ عددها 125 في هذه المجموعة.
فتح الحزمة
k this deck
33
When performing vertical analysis of an income statement, net income is usually used as the base.
فتح الحزمة
افتح القفل للوصول البطاقات البالغ عددها 125 في هذه المجموعة.
فتح الحزمة
k this deck
34
Vertical analysis is concerned with the format used to prepare financial statements.
فتح الحزمة
افتح القفل للوصول البطاقات البالغ عددها 125 في هذه المجموعة.
فتح الحزمة
k this deck
35
A thorough analysis of financial statements will include either horizontal or vertical analysis, but not both.
فتح الحزمة
افتح القفل للوصول البطاقات البالغ عددها 125 في هذه المجموعة.
فتح الحزمة
k this deck
36
In performing a vertical analysis, the base for cash is:
A) total liabilities and stockholders' equity.
B) total assets.
C) total cash and cash equivalents.
D) total current assets.
A) total liabilities and stockholders' equity.
B) total assets.
C) total cash and cash equivalents.
D) total current assets.
فتح الحزمة
افتح القفل للوصول البطاقات البالغ عددها 125 في هذه المجموعة.
فتح الحزمة
k this deck
37
In vertical analysis:
A) a base amount is optional.
B) a base amount is required.
C) comparative statements are optional.
D) comparative statements are required.
A) a base amount is optional.
B) a base amount is required.
C) comparative statements are optional.
D) comparative statements are required.
فتح الحزمة
افتح القفل للوصول البطاقات البالغ عددها 125 في هذه المجموعة.
فتح الحزمة
k this deck
38
Tech Support Corporation reports the following data: In a vertical analysis, the gross profit percentage is closest to:
A) 63%.
B) 57%.
C) 157%.
D) 36%.
In a vertical analysis, the gross profit percentage is closest to:A) 63%.
B) 57%.
C) 157%.
D) 36%.
فتح الحزمة
افتح القفل للوصول البطاقات البالغ عددها 125 في هذه المجموعة.
فتح الحزمة
k this deck
39
When performing a horizontal analysis on a statement of retained earnings, which would NOT show a percentage change value?
A) Dividends paid
B) Net income
C) Expenses
D) Beginning balance of retained earnings
A) Dividends paid
B) Net income
C) Expenses
D) Beginning balance of retained earnings
فتح الحزمة
افتح القفل للوصول البطاقات البالغ عددها 125 في هذه المجموعة.
فتح الحزمة
k this deck
40
The relationship of each individual asset as a percentage of total assets is an example of vertical analysis.
فتح الحزمة
افتح القفل للوصول البطاقات البالغ عددها 125 في هذه المجموعة.
فتح الحزمة
k this deck
41
Prepare a vertical analysis for Crestwood Corporation's balance sheet to determine the component percentages of its assets, liabilities, and stockholders' equity. Round percentages to the nearest one-tenth percent.
فتح الحزمة
افتح القفل للوصول البطاقات البالغ عددها 125 في هذه المجموعة.
فتح الحزمة
k this deck
42
Common-size financial statements report only dollar amounts.
فتح الحزمة
افتح القفل للوصول البطاقات البالغ عددها 125 في هذه المجموعة.
فتح الحزمة
k this deck
43
If a balance sheet is subjected to vertical analysis which shows that current assets (using total assets as the base) have increased from 42% to 56%, this would always mean that:
A) current assets have increased as a percentage of total assets.
B) the dollar amount of total assets has increased.
C) the dollar amount of total assets has decreased.
D) the dollar amount of current assets has increased.
A) current assets have increased as a percentage of total assets.
B) the dollar amount of total assets has increased.
C) the dollar amount of total assets has decreased.
D) the dollar amount of current assets has increased.
فتح الحزمة
افتح القفل للوصول البطاقات البالغ عددها 125 في هذه المجموعة.
فتح الحزمة
k this deck
44
In performing a vertical analysis, the base for interest expense is:
A) net sales.
B) total operating expenses.
C) net income.
D) interest income.
A) net sales.
B) total operating expenses.
C) net income.
D) interest income.
فتح الحزمة
افتح القفل للوصول البطاقات البالغ عددها 125 في هذه المجموعة.
فتح الحزمة
k this deck
45
In performing a vertical analysis, the base for cost of goods sold is:
A) net sales.
B) total revenues.
C) total expenses.
D) gross profit.
A) net sales.
B) total revenues.
C) total expenses.
D) gross profit.
فتح الحزمة
افتح القفل للوصول البطاقات البالغ عددها 125 في هذه المجموعة.
فتح الحزمة
k this deck
46
Which of the following would be most helpful in the comparison of different size companies?
A) Horizontal analysis
B) Comparison of their net incomes
C) Comparison of their working capital balances
D) Preparation of common-size financial statements
A) Horizontal analysis
B) Comparison of their net incomes
C) Comparison of their working capital balances
D) Preparation of common-size financial statements
فتح الحزمة
افتح القفل للوصول البطاقات البالغ عددها 125 في هذه المجموعة.
فتح الحزمة
k this deck
47
To perform vertical analysis, financial statements must first be converted to common-size format.
فتح الحزمة
افتح القفل للوصول البطاقات البالغ عددها 125 في هذه المجموعة.
فتح الحزمة
k this deck
48
A common-size statement is less effective than a horizontal analysis when comparing companies.
فتح الحزمة
افتح القفل للوصول البطاقات البالغ عددها 125 في هذه المجموعة.
فتح الحزمة
k this deck
49
A financial statement that shows each item as a percentage of one key item on the statement is referred to as:
A) benchmarking.
B) common-size statement.
C) horizontal analysis.
D) statement of cash flows.
A) benchmarking.
B) common-size statement.
C) horizontal analysis.
D) statement of cash flows.
فتح الحزمة
افتح القفل للوصول البطاقات البالغ عددها 125 في هذه المجموعة.
فتح الحزمة
k this deck
50
Given the following data: In a vertical analysis, net income would be expressed as:
A) 18%.
B) 45%.
C) 30%.
D) 82%.
In a vertical analysis, net income would be expressed as:A) 18%.
B) 45%.
C) 30%.
D) 82%.
فتح الحزمة
افتح القفل للوصول البطاقات البالغ عددها 125 في هذه المجموعة.
فتح الحزمة
k this deck
51
Given the following data: In a vertical analysis, cash would be expressed as:
A) 935%.
B) 217%.
C) 46%.
D) 11%.
In a vertical analysis, cash would be expressed as:A) 935%.
B) 217%.
C) 46%.
D) 11%.
فتح الحزمة
افتح القفل للوصول البطاقات البالغ عددها 125 في هذه المجموعة.
فتح الحزمة
k this deck
52
Prepare a vertical analysis for Winkler Corporation using the information shown below (round percentages to the nearest one-tenth percent):
فتح الحزمة
افتح القفل للوصول البطاقات البالغ عددها 125 في هذه المجموعة.
فتح الحزمة
k this deck
53
Given the following data: In a vertical analysis, cost of goods sold would be expressed as:
A) 166%.
B) 40%.
C) 60%.
D) 250%.
In a vertical analysis, cost of goods sold would be expressed as:A) 166%.
B) 40%.
C) 60%.
D) 250%.
فتح الحزمة
افتح القفل للوصول البطاقات البالغ عددها 125 في هذه المجموعة.
فتح الحزمة
k this deck
54
Common-size financial statements are particularly valuable for identifying areas for improvements.
فتح الحزمة
افتح القفل للوصول البطاقات البالغ عددها 125 في هذه المجموعة.
فتح الحزمة
k this deck
55
Benchmarking is the process of comparing a company to standards set by the leading company in the industry.
فتح الحزمة
افتح القفل للوصول البطاقات البالغ عددها 125 في هذه المجموعة.
فتح الحزمة
k this deck
56
If the assets shown on a balance sheet are subjected to vertical analysis (using total assets as the base), an increase in the figure for current assets from 56% to 60% would always mean that:
A) the dollar amount of noncurrent assets has increased.
B) the dollar amount of total assets has increased.
C) total current assets have increased as a percentage of total assets.
D) the dollar amount of current assets has increased.
A) the dollar amount of noncurrent assets has increased.
B) the dollar amount of total assets has increased.
C) total current assets have increased as a percentage of total assets.
D) the dollar amount of current assets has increased.
فتح الحزمة
افتح القفل للوصول البطاقات البالغ عددها 125 في هذه المجموعة.
فتح الحزمة
k this deck
57
Given the following data: In vertical analysis, current liabilities would be expressed as:
A) 356%.
B) 90%.
C) 111%.
D) 28%.
In vertical analysis, current liabilities would be expressed as:A) 356%.
B) 90%.
C) 111%.
D) 28%.
فتح الحزمة
افتح القفل للوصول البطاقات البالغ عددها 125 في هذه المجموعة.
فتح الحزمة
k this deck
58
On a common-size balance sheet each item is expressed as a percentage of:
A) current assets.
B) operating income.
C) total assets.
D) net income.
A) current assets.
B) operating income.
C) total assets.
D) net income.
فتح الحزمة
افتح القفل للوصول البطاقات البالغ عددها 125 في هذه المجموعة.
فتح الحزمة
k this deck
59
Prepare a vertical analysis for Westwood Corporation by completing the right column of the following balance sheet with the appropriate percentages. Round percentages to the nearest one-tenth percent.
فتح الحزمة
افتح القفل للوصول البطاقات البالغ عددها 125 في هذه المجموعة.
فتح الحزمة
k this deck
60
In performing a vertical analysis, the base for sales returns and allowances is:
A) sales discounts.
B) sales.
C) gross profit.
D) net sales.
A) sales discounts.
B) sales.
C) gross profit.
D) net sales.
فتح الحزمة
افتح القفل للوصول البطاقات البالغ عددها 125 في هذه المجموعة.
فتح الحزمة
k this deck
61
In the statement of cash flows, an increase in new borrowing, exceeding the payoff of long-term debt, is a sign of weakness.
فتح الحزمة
افتح القفل للوصول البطاقات البالغ عددها 125 في هذه المجموعة.
فتح الحزمة
k this deck
62
The statement of cash flows is helpful for spotting weaknesses as well as gauging success.
فتح الحزمة
افتح القفل للوصول البطاقات البالغ عددها 125 في هذه المجموعة.
فتح الحزمة
k this deck
63
On the statement of cash flows of a healthy company, net cash from operating activities generally exceeds net income because of the reduction for depreciation.
فتح الحزمة
افتح القفل للوصول البطاقات البالغ عددها 125 في هذه المجموعة.
فتح الحزمة
k this deck
64
When benchmarking financial statements of two key competitors, the gross margin of Company A is expressed as a percentage of:
A) the total gross margins of Companies A and B.
B) Company B's gross margin.
C) a common standard for both Company A and Company B.
D) Company A's sales.
A) the total gross margins of Companies A and B.
B) Company B's gross margin.
C) a common standard for both Company A and Company B.
D) Company A's sales.
فتح الحزمة
افتح القفل للوصول البطاقات البالغ عددها 125 في هذه المجموعة.
فتح الحزمة
k this deck
65
In the statement of cash flows, sales of marketable securities are considered an operating activity.
فتح الحزمة
افتح القفل للوصول البطاقات البالغ عددها 125 في هذه المجموعة.
فتح الحزمة
k this deck
66
In the statement of cash flows, depreciation and amortization are considered a use of funds.
فتح الحزمة
افتح القفل للوصول البطاقات البالغ عددها 125 في هذه المجموعة.
فتح الحزمة
k this deck
67
Analyzing the statement of cash flows may help analysts determine the financial health of a company. Which of the following signs below is a NOT indicator of a financially healthy company?
A) The company's operations are a major source (not a use) of cash.
B) The company's operations are a major use (not a source) of cash.
C) The company's investing activities include more purchases than sales of long-term assets.
D) The company's financing activities are not dominated by borrowing.
A) The company's operations are a major source (not a use) of cash.
B) The company's operations are a major use (not a source) of cash.
C) The company's investing activities include more purchases than sales of long-term assets.
D) The company's financing activities are not dominated by borrowing.
فتح الحزمة
افتح القفل للوصول البطاقات البالغ عددها 125 في هذه المجموعة.
فتح الحزمة
k this deck
68
On a statement of cash flows of a struggling company, net income would ordinarily be:
A) less than depreciation expense.
B) more than depreciation expense.
C) greater than cash provided by operating activities.
D) more than cash provided by operating activities.
A) less than depreciation expense.
B) more than depreciation expense.
C) greater than cash provided by operating activities.
D) more than cash provided by operating activities.
فتح الحزمة
افتح القفل للوصول البطاقات البالغ عددها 125 في هذه المجموعة.
فتح الحزمة
k this deck
69
As another analytical tool, analysts rely on the statement of cash flows as a predictor of eventual success for a given company.
فتح الحزمة
افتح القفل للوصول البطاقات البالغ عددها 125 في هذه المجموعة.
فتح الحزمة
k this deck
70
On a statement of cash flows, which is considered an operating activity?
A) Sale of securities
B) Purchase of fixed assets
C) Purchase of securities
D) Depreciation
A) Sale of securities
B) Purchase of fixed assets
C) Purchase of securities
D) Depreciation
فتح الحزمة
افتح القفل للوصول البطاقات البالغ عددها 125 في هذه المجموعة.
فتح الحزمة
k this deck
71
In the statement of cash flows, more purchases of long-term assets than sales of long-term assets are considered a sign of a healthy company.
فتح الحزمة
افتح القفل للوصول البطاقات البالغ عددها 125 في هذه المجموعة.
فتح الحزمة
k this deck
72
Benchmarking financial statements represents a form of:
A) horizontal analysis.
B) vertical analysis.
C) gross profit analysis.
D) trend analysis.
A) horizontal analysis.
B) vertical analysis.
C) gross profit analysis.
D) trend analysis.
فتح الحزمة
افتح القفل للوصول البطاقات البالغ عددها 125 في هذه المجموعة.
فتح الحزمة
k this deck
73
If the sale of plant assets is a company's major source of cash, it may be a sign of financial difficulty.
فتح الحزمة
افتح القفل للوصول البطاقات البالغ عددها 125 في هذه المجموعة.
فتح الحزمة
k this deck
74
In the statement of cash flows, purchases of fixed assets are considered to be investing activities.
فتح الحزمة
افتح القفل للوصول البطاقات البالغ عددها 125 في هذه المجموعة.
فتح الحزمة
k this deck
75
On a statement of cash flows, which is considered an investing activity?
A) Depreciation
B) Increase in inventory
C) Sale of securities
D) Repayment of debt
A) Depreciation
B) Increase in inventory
C) Sale of securities
D) Repayment of debt
فتح الحزمة
افتح القفل للوصول البطاقات البالغ عددها 125 في هذه المجموعة.
فتح الحزمة
k this deck
76
On the statement of cash flows of a healthy company, net cash from operating activities is generally less than net income.
فتح الحزمة
افتح القفل للوصول البطاقات البالغ عددها 125 في هذه المجموعة.
فتح الحزمة
k this deck
77
Computer City, Inc.'s comparative income statement is shown below:
Required:
Prepare a common-size income statement for 2012 and 2011 showing the percentages for each item listed above. Round percentages to one-tenth percent.
Required:Prepare a common-size income statement for 2012 and 2011 showing the percentages for each item listed above. Round percentages to one-tenth percent.
فتح الحزمة
افتح القفل للوصول البطاقات البالغ عددها 125 في هذه المجموعة.
فتح الحزمة
k this deck
78
On a common-size balance sheet, income taxes payable is expressed as a percentage of:
A) Current liabilities.
B) Stockholders' equity.
C) Total assets.
D) Total liabilities.
A) Current liabilities.
B) Stockholders' equity.
C) Total assets.
D) Total liabilities.
فتح الحزمة
افتح القفل للوصول البطاقات البالغ عددها 125 في هذه المجموعة.
فتح الحزمة
k this deck
79
When analyzing the statement of cash flows, which of the following statement are true?
A) Cash has no effect on the success of the company.
B) Cash is ignored when analyzing a company.
C) An excess of cash is the sign of a healthy company.
D) A company with a large cash balance is ensured success.
A) Cash has no effect on the success of the company.
B) Cash is ignored when analyzing a company.
C) An excess of cash is the sign of a healthy company.
D) A company with a large cash balance is ensured success.
فتح الحزمة
افتح القفل للوصول البطاقات البالغ عددها 125 في هذه المجموعة.
فتح الحزمة
k this deck
80
Walton Company's return on sales for the most recent year was 5%. The industry leader reports a return on sales of 7%. The comparison of each company's return on sales is an example of:
A) benchmarking.
B) gross margin analysis.
C) detail analysis.
D) intercompany analysis.
A) benchmarking.
B) gross margin analysis.
C) detail analysis.
D) intercompany analysis.
فتح الحزمة
افتح القفل للوصول البطاقات البالغ عددها 125 في هذه المجموعة.
فتح الحزمة
k this deck
فتح الحزمة
افتح القفل للوصول البطاقات البالغ عددها 125 في هذه المجموعة.


