Deck 2: Presenting Data in Tables and Charts
ملء الشاشة (f)
سؤال
سؤال
سؤال
سؤال
سؤال
سؤال
سؤال
سؤال
سؤال
سؤال
سؤال
سؤال
سؤال
A professor of economics at a Tasmanian university wanted to determine which students were taking his tough economics course.Shown below is a pie chart of the results.What percentage of the class took the course prior to reaching their honours year? 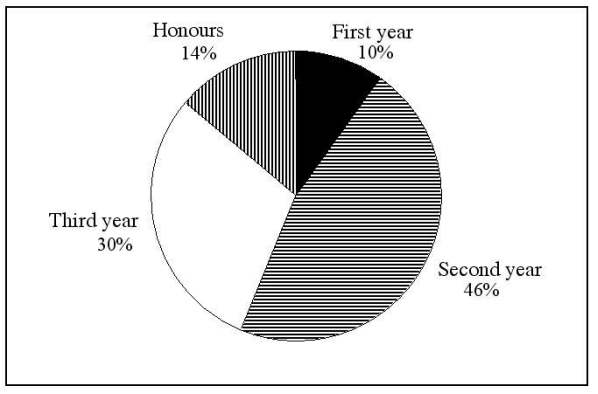
A)86%
B)14%
C)54%
D)44%
A)86%
B)14%
C)54%
D)44%
سؤال
سؤال
سؤال
سؤال
سؤال
سؤال
Instruction 2-2
At a meeting of information systems officers for regional offices of a national company,a survey was taken to determine the number of employees the officers supervise in the operation of their departments,where X is the number of employees overseen by each information systems officer.
-Retailers are always interested in determining why a customer selected their store to make a purchase.A clothing retailer conducted a customer survey to determine why its customers shopped at the store.The results are shown in the bar chart below.What proportion of the customers responded that they shopped at the store because of the merchandise or the convenience?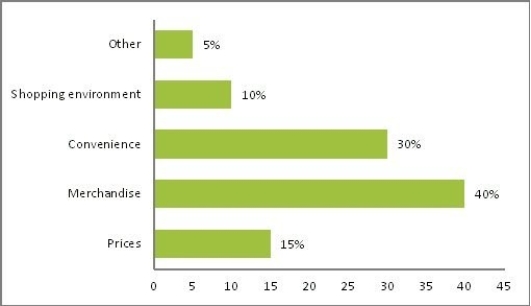
A)85%
B)70%
C)50%
D)35%
سؤال
سؤال
سؤال
Instruction 2-7
The Stem-and-Leaf display below contains data on the number of months between the date a civil suit is filed and when the case is actually adjudicated for 50 cases heard in the Supreme Court of Victoria.
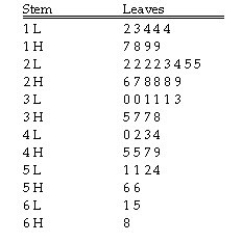 Note: 1L means the "low teens" - 10,11,12,13,or 14;1H means the "high teens" - 15,16,17,18,or 19;2L means the "low twenties" - 20,21,22,23,or 24,etc.
Referring to Instruction 2-7,the civil suit with the longest wait between when the suit was filed and when it was adjudicated had a wait of ________ months.
The Stem-and-Leaf display below contains data on the number of months between the date a civil suit is filed and when the case is actually adjudicated for 50 cases heard in the Supreme Court of Victoria.
Note: 1L means the "low teens" - 10,11,12,13,or 14;1H means the "high teens" - 15,16,17,18,or 19;2L means the "low twenties" - 20,21,22,23,or 24,etc.Referring to Instruction 2-7,the civil suit with the longest wait between when the suit was filed and when it was adjudicated had a wait of ________ months.
سؤال
Instruction 2-8
The Stem-and-Leaf display represents the number of times in a year that a random sample of 100 "lifetime" members of a health club actually visited the facility.
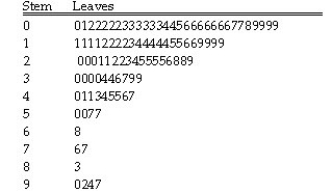
Referring to Instruction 2-8,the person who visited the health club less than anyone else in the sample visited the facility ________ times.
The Stem-and-Leaf display represents the number of times in a year that a random sample of 100 "lifetime" members of a health club actually visited the facility.
Referring to Instruction 2-8,the person who visited the health club less than anyone else in the sample visited the facility ________ times.
سؤال
سؤال
Instruction 2-8
The Stem-and-Leaf display represents the number of times in a year that a random sample of 100 "lifetime" members of a health club actually visited the facility.
Referring to Instruction 2-8,the person who has the largest leaf associated with the smallest stem visited the facility ________ times.
The Stem-and-Leaf display represents the number of times in a year that a random sample of 100 "lifetime" members of a health club actually visited the facility.
Referring to Instruction 2-8,the person who has the largest leaf associated with the smallest stem visited the facility ________ times.
سؤال
Instruction 2-7
The Stem-and-Leaf display below contains data on the number of months between the date a civil suit is filed and when the case is actually adjudicated for 50 cases heard in the Supreme Court of Victoria.
Note: 1L means the "low teens" - 10,11,12,13,or 14;1H means the "high teens" - 15,16,17,18,or 19;2L means the "low twenties" - 20,21,22,23,or 24,etc.
Referring to Instruction 2-7,locate the first leaf,i.e. ,the lowest valued leaf with the lowest valued stem.This represents a wait of ________ months.
The Stem-and-Leaf display below contains data on the number of months between the date a civil suit is filed and when the case is actually adjudicated for 50 cases heard in the Supreme Court of Victoria.
Note: 1L means the "low teens" - 10,11,12,13,or 14;1H means the "high teens" - 15,16,17,18,or 19;2L means the "low twenties" - 20,21,22,23,or 24,etc.Referring to Instruction 2-7,locate the first leaf,i.e. ,the lowest valued leaf with the lowest valued stem.This represents a wait of ________ months.
سؤال
سؤال
Instruction 2-8
The Stem-and-Leaf display represents the number of times in a year that a random sample of 100 "lifetime" members of a health club actually visited the facility.
Referring to Instruction 2-8,________ of the 100 members visited the health club at least 52 times in a year.
The Stem-and-Leaf display represents the number of times in a year that a random sample of 100 "lifetime" members of a health club actually visited the facility.
Referring to Instruction 2-8,________ of the 100 members visited the health club at least 52 times in a year.
سؤال
Instruction 2-7
The Stem-and-Leaf display below contains data on the number of months between the date a civil suit is filed and when the case is actually adjudicated for 50 cases heard in the Supreme Court of Victoria.
Note: 1L means the "low teens" - 10,11,12,13,or 14;1H means the "high teens" - 15,16,17,18,or 19;2L means the "low twenties" - 20,21,22,23,or 24,etc.
Referring to Instruction 2-7,________ percent of the cases were not adjudicated within the first 4 years.
The Stem-and-Leaf display below contains data on the number of months between the date a civil suit is filed and when the case is actually adjudicated for 50 cases heard in the Supreme Court of Victoria.
Note: 1L means the "low teens" - 10,11,12,13,or 14;1H means the "high teens" - 15,16,17,18,or 19;2L means the "low twenties" - 20,21,22,23,or 24,etc.Referring to Instruction 2-7,________ percent of the cases were not adjudicated within the first 4 years.
سؤال
Instruction 2-8
The Stem-and-Leaf display represents the number of times in a year that a random sample of 100 "lifetime" members of a health club actually visited the facility.
Referring to Instruction 2-8,the person who visited the health club more than anyone else in the sample visited the facility ________ times.
سؤال
سؤال
Instruction 2-7
The Stem-and-Leaf display below contains data on the number of months between the date a civil suit is filed and when the case is actually adjudicated for 50 cases heard in the Supreme Court of Victoria.
Note: 1L means the "low teens" - 10,11,12,13,or 14;1H means the "high teens" - 15,16,17,18,or 19;2L means the "low twenties" - 20,21,22,23,or 24,etc.
Referring to Instruction 2-7,if a frequency distribution with equal sized classes was made from this data,and the first class was "10 but less than 20",the cumulative percentage of the second class would be ________.
The Stem-and-Leaf display below contains data on the number of months between the date a civil suit is filed and when the case is actually adjudicated for 50 cases heard in the Supreme Court of Victoria.
Note: 1L means the "low teens" - 10,11,12,13,or 14;1H means the "high teens" - 15,16,17,18,or 19;2L means the "low twenties" - 20,21,22,23,or 24,etc.Referring to Instruction 2-7,if a frequency distribution with equal sized classes was made from this data,and the first class was "10 but less than 20",the cumulative percentage of the second class would be ________.
سؤال
Instruction 2-7
The Stem-and-Leaf display below contains data on the number of months between the date a civil suit is filed and when the case is actually adjudicated for 50 cases heard in the Supreme Court of Victoria.
Note: 1L means the "low teens" - 10,11,12,13,or 14;1H means the "high teens" - 15,16,17,18,or 19;2L means the "low twenties" - 20,21,22,23,or 24,etc.
Referring to Instruction 2-7,if a frequency distribution with equal sized classes was made from this data,and the first class was "10 but less than 20",the relative frequency of the third class would be ________.
The Stem-and-Leaf display below contains data on the number of months between the date a civil suit is filed and when the case is actually adjudicated for 50 cases heard in the Supreme Court of Victoria.
Note: 1L means the "low teens" - 10,11,12,13,or 14;1H means the "high teens" - 15,16,17,18,or 19;2L means the "low twenties" - 20,21,22,23,or 24,etc.Referring to Instruction 2-7,if a frequency distribution with equal sized classes was made from this data,and the first class was "10 but less than 20",the relative frequency of the third class would be ________.
سؤال
Instruction 2-7
The Stem-and-Leaf display below contains data on the number of months between the date a civil suit is filed and when the case is actually adjudicated for 50 cases heard in the Supreme Court of Victoria.
Note: 1L means the "low teens" - 10,11,12,13,or 14;1H means the "high teens" - 15,16,17,18,or 19;2L means the "low twenties" - 20,21,22,23,or 24,etc.
Referring to Instruction 2-7,the civil suit with the fourth shortest waiting time between when the suit was filed and when it was adjudicated had a wait of ________ months.
The Stem-and-Leaf display below contains data on the number of months between the date a civil suit is filed and when the case is actually adjudicated for 50 cases heard in the Supreme Court of Victoria.
Note: 1L means the "low teens" - 10,11,12,13,or 14;1H means the "high teens" - 15,16,17,18,or 19;2L means the "low twenties" - 20,21,22,23,or 24,etc.Referring to Instruction 2-7,the civil suit with the fourth shortest waiting time between when the suit was filed and when it was adjudicated had a wait of ________ months.
سؤال
سؤال
سؤال
Instruction 2-7
The Stem-and-Leaf display below contains data on the number of months between the date a civil suit is filed and when the case is actually adjudicated for 50 cases heard in the Supreme Court of Victoria.
Note: 1L means the "low teens" - 10,11,12,13,or 14;1H means the "high teens" - 15,16,17,18,or 19;2L means the "low twenties" - 20,21,22,23,or 24,etc.
Referring to Instruction 2-7,if a frequency distribution with equal sized classes was made from this data,and the first class was "10 but less than 20",the frequency of that class would be ________.
The Stem-and-Leaf display below contains data on the number of months between the date a civil suit is filed and when the case is actually adjudicated for 50 cases heard in the Supreme Court of Victoria.
Note: 1L means the "low teens" - 10,11,12,13,or 14;1H means the "high teens" - 15,16,17,18,or 19;2L means the "low twenties" - 20,21,22,23,or 24,etc.Referring to Instruction 2-7,if a frequency distribution with equal sized classes was made from this data,and the first class was "10 but less than 20",the frequency of that class would be ________.
سؤال
سؤال
Instruction 2-7
The Stem-and-Leaf display below contains data on the number of months between the date a civil suit is filed and when the case is actually adjudicated for 50 cases heard in the Supreme Court of Victoria.
Note: 1L means the "low teens" - 10,11,12,13,or 14;1H means the "high teens" - 15,16,17,18,or 19;2L means the "low twenties" - 20,21,22,23,or 24,etc.
Referring to Instruction 2-7,________ percent of the cases were adjudicated within the first 2 years.
The Stem-and-Leaf display below contains data on the number of months between the date a civil suit is filed and when the case is actually adjudicated for 50 cases heard in the Supreme Court of Victoria.
Note: 1L means the "low teens" - 10,11,12,13,or 14;1H means the "high teens" - 15,16,17,18,or 19;2L means the "low twenties" - 20,21,22,23,or 24,etc.Referring to Instruction 2-7,________ percent of the cases were adjudicated within the first 2 years.
سؤال
سؤال
سؤال
سؤال
سؤال
سؤال
سؤال
Instruction 2-8
The Stem-and-Leaf display represents the number of times in a year that a random sample of 100 "lifetime" members of a health club actually visited the facility.
Referring to Instruction 2-8,________ of the 100 members visited the health club no more than 12 times in a year.
The Stem-and-Leaf display represents the number of times in a year that a random sample of 100 "lifetime" members of a health club actually visited the facility.
Referring to Instruction 2-8,________ of the 100 members visited the health club no more than 12 times in a year.
سؤال
Instruction 2-8
The Stem-and-Leaf display represents the number of times in a year that a random sample of 100 "lifetime" members of a health club actually visited the facility.
Referring to Instruction 2-8,if a frequency distribution with equal sized classes was made from this data,and the first class was "0 but less than 10",the frequency of the fifth class would be ________.
سؤال
سؤال
سؤال
سؤال
سؤال
سؤال
Instruction 2-8
The Stem-and-Leaf display represents the number of times in a year that a random sample of 100 "lifetime" members of a health club actually visited the facility.
Referring to Instruction 2-8,if a frequency distribution with equal sized classes was made from this data,and the first class was "0 but less than 10",the cumulative percentage of the next-to-last class would be ________.
سؤال
سؤال
سؤال
سؤال
سؤال
Instruction 2-8
The Stem-and-Leaf display represents the number of times in a year that a random sample of 100 "lifetime" members of a health club actually visited the facility.
Referring to Instruction 2-8,if a frequency distribution with equal sized classes was made from this data,and the first class was "0 but less than 10",the relative frequency of the last class would be ________.
سؤال
سؤال
Instruction 2-8
The Stem-and-Leaf display represents the number of times in a year that a random sample of 100 "lifetime" members of a health club actually visited the facility.
Referring to Instruction 2-8,if a frequency distribution with equal sized classes was made from this data,and the first class was "0 but less than 10",the class midpoint of the third class would be ________.
سؤال
سؤال
سؤال
سؤال
سؤال
Instruction 2-9
The frequency distribution below represents the rents of 250 randomly selected federally subsidised apartments in Sydney.
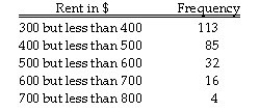
Referring to Instruction 2-9,________ apartments rented for at least $400 but less than $600.
The frequency distribution below represents the rents of 250 randomly selected federally subsidised apartments in Sydney.
Referring to Instruction 2-9,________ apartments rented for at least $400 but less than $600.
سؤال
سؤال
سؤال
سؤال
سؤال
سؤال
سؤال
سؤال
سؤال
سؤال
سؤال
سؤال
Instruction 2-9
The frequency distribution below represents the rents of 250 randomly selected federally subsidised apartments in Sydney.
Referring to Instruction 2-9,________ percent of the apartments rented for no less than $600.
The frequency distribution below represents the rents of 250 randomly selected federally subsidised apartments in Sydney.
Referring to Instruction 2-9,________ percent of the apartments rented for no less than $600.
سؤال
سؤال
سؤال

فتح الحزمة
قم بالتسجيل لفتح البطاقات في هذه المجموعة!
Unlock Deck
Unlock Deck
1/178
العب
ملء الشاشة (f)
Deck 2: Presenting Data in Tables and Charts
1
Instruction 2-5
The following are the durations in minutes of a sample of long-distance phone calls made within Australia reported by one long-distance carrier.
-Referring to Instruction 2-5,if 10 calls lasted 30 minutes or more,how many calls lasted less than 5 minutes?
A)10
B)185
C)500
D)295
The following are the durations in minutes of a sample of long-distance phone calls made within Australia reported by one long-distance carrier.
-Referring to Instruction 2-5,if 10 calls lasted 30 minutes or more,how many calls lasted less than 5 minutes?
A)10
B)185
C)500
D)295
185
2
Instruction 2-2
At a meeting of information systems officers for regional offices of a national company,a survey was taken to determine the number of employees the officers supervise in the operation of their departments,where X is the number of employees overseen by each information systems officer.
-Referring to Instruction 2-2,across all of the regional offices,how many total employees were supervised by those surveyed?
A)40
B)200
C)127
D)15
127
3
Histograms are used for numerical data while bar charts are suitable for categorical data.
True
4
Research on human perception concludes that the bar chart is preferred to the pie chart,because the human eye can more accurately judge length comparisons against a fixed scale (as in a bar chart)than angular measures (as in a pie chart).
فتح الحزمة
افتح القفل للوصول البطاقات البالغ عددها 178 في هذه المجموعة.
فتح الحزمة
k this deck
5
The length of each bar in a bar chart represents the
A)midpoint of observations in each class.
B)average number of observations in each class.
C)proportion,frequency or percentage of observations in each class.
D)variances of observations in each class.
A)midpoint of observations in each class.
B)average number of observations in each class.
C)proportion,frequency or percentage of observations in each class.
D)variances of observations in each class.
فتح الحزمة
افتح القفل للوصول البطاقات البالغ عددها 178 في هذه المجموعة.
فتح الحزمة
k this deck
6
One of the advantages of a pie chart is that it clearly shows that the total of all the categories of the pie adds to 100%.
فتح الحزمة
افتح القفل للوصول البطاقات البالغ عددها 178 في هذه المجموعة.
فتح الحزمة
k this deck
7
Instruction 2-5
The following are the durations in minutes of a sample of long-distance phone calls made within Australia reported by one long-distance carrier.
-Referring to Instruction 2-5,if 1,000 calls were randomly sampled,how many calls lasted under 10 minutes?
A)590
B)370
C)410
D)220
The following are the durations in minutes of a sample of long-distance phone calls made within Australia reported by one long-distance carrier.
-Referring to Instruction 2-5,if 1,000 calls were randomly sampled,how many calls lasted under 10 minutes?
A)590
B)370
C)410
D)220
فتح الحزمة
افتح القفل للوصول البطاقات البالغ عددها 178 في هذه المجموعة.
فتح الحزمة
k this deck
8
Apple Computer,Inc.collected information on the age of their customers.The youngest customer was 12 and the oldest was 72.To study the distribution of the age among its customers,it is best to use a pie chart.
فتح الحزمة
افتح القفل للوصول البطاقات البالغ عددها 178 في هذه المجموعة.
فتح الحزمة
k this deck
9
A histogram can have gaps between the bars,whereas bar charts cannot have gaps.
فتح الحزمة
افتح القفل للوصول البطاقات البالغ عددها 178 في هذه المجموعة.
فتح الحزمة
k this deck
10
Instruction 2-4
A survey was conducted to determine how people rated the quality of programming available on television.Respondents were asked to rate the overall quality from 0 (no quality at all)to 100 (extremely good quality).The stem-and-leaf display of the data is shown below.
-Referring to Instruction 2-4,what percentage of the respondents rated overall television quality with a rating between 50 and 75 (inclusive)?
A)40
B)44
C)11
D)56
فتح الحزمة
افتح القفل للوصول البطاقات البالغ عددها 178 في هذه المجموعة.
فتح الحزمة
k this deck
11
You have collected information on the market share of five different search engines used by Australian Internet users in June 2012.Which of the following is the best for presenting the information?
A)A stem-and-leaf display.
B)A histogram.
C)A contingency table.
D)A pie chart.
A)A stem-and-leaf display.
B)A histogram.
C)A contingency table.
D)A pie chart.
فتح الحزمة
افتح القفل للوصول البطاقات البالغ عددها 178 في هذه المجموعة.
فتح الحزمة
k this deck
12
Instruction 2-4
A survey was conducted to determine how people rated the quality of programming available on television.Respondents were asked to rate the overall quality from 0 (no quality at all)to 100 (extremely good quality).The stem-and-leaf display of the data is shown below.
-Referring to Instruction 2-4,what percentage of the respondents rated overall television quality with a rating of 80 or above?
A)96
B)100
C)0
D)4
فتح الحزمة
افتح القفل للوصول البطاقات البالغ عددها 178 في هذه المجموعة.
فتح الحزمة
k this deck
13
A professor of economics at a Tasmanian university wanted to determine which students were taking his tough economics course.Shown below is a pie chart of the results.What percentage of the class took the course prior to reaching their honours year?
A)86%
B)14%
C)54%
D)44%
A)86%
B)14%
C)54%
D)44%
فتح الحزمة
افتح القفل للوصول البطاقات البالغ عددها 178 في هذه المجموعة.
فتح الحزمة
k this deck
14
Instruction 2-1
An insurance company evaluates many numerical variables about a person before deciding on an appropriate rate for automobile insurance.A representative from a local insurance agency selected a random sample of insured drivers and recorded,X,the number of claims each made in the last 3 years,with the following results.
-Referring to Instruction 2-1,how many drivers are represented in the sample?
A)18
B)50
C)5
D)15
فتح الحزمة
افتح القفل للوصول البطاقات البالغ عددها 178 في هذه المجموعة.
فتح الحزمة
k this deck
15
Instruction 2-4
A survey was conducted to determine how people rated the quality of programming available on television.Respondents were asked to rate the overall quality from 0 (no quality at all)to 100 (extremely good quality).The stem-and-leaf display of the data is shown below.
-Referring to Instruction 2-4,what percentage of the respondents rated overall television quality with a rating of 50 or below?
A)44
B)56
C)11
D)40
فتح الحزمة
افتح القفل للوصول البطاقات البالغ عددها 178 في هذه المجموعة.
فتح الحزمة
k this deck
16
Instruction 2-5
The following are the durations in minutes of a sample of long-distance phone calls made within Australia reported by one long-distance carrier.
-Referring to Instruction 2-5,if 100 calls were randomly sampled,how many calls lasted 15 minutes or longer?
A)74
B)14
C)10
D)26
The following are the durations in minutes of a sample of long-distance phone calls made within Australia reported by one long-distance carrier.
-Referring to Instruction 2-5,if 100 calls were randomly sampled,how many calls lasted 15 minutes or longer?
A)74
B)14
C)10
D)26
فتح الحزمة
افتح القفل للوصول البطاقات البالغ عددها 178 في هذه المجموعة.
فتح الحزمة
k this deck
17
Instruction 2-5
The following are the durations in minutes of a sample of long-distance phone calls made within Australia reported by one long-distance carrier.
-Referring to Instruction 2-5,what is the width of each class?
A)5 minutes
B)100%
C)2%
D)1 minute
The following are the durations in minutes of a sample of long-distance phone calls made within Australia reported by one long-distance carrier.
-Referring to Instruction 2-5,what is the width of each class?
A)5 minutes
B)100%
C)2%
D)1 minute
فتح الحزمة
افتح القفل للوصول البطاقات البالغ عددها 178 في هذه المجموعة.
فتح الحزمة
k this deck
18
In a survey,150 executives were asked what they think is the most common mistake candidates make during job interviews.Six different mistakes were given.Which of the following is the best for presenting the information?
A)A bar chart.
B)A contingency table.
C)A stem-and-leaf display.
D)A histogram.
A)A bar chart.
B)A contingency table.
C)A stem-and-leaf display.
D)A histogram.
فتح الحزمة
افتح القفل للوصول البطاقات البالغ عددها 178 في هذه المجموعة.
فتح الحزمة
k this deck
19
Instruction 2-2
At a meeting of information systems officers for regional offices of a national company,a survey was taken to determine the number of employees the officers supervise in the operation of their departments,where X is the number of employees overseen by each information systems officer.
-Retailers are always interested in determining why a customer selected their store to make a purchase.A clothing retailer conducted a customer survey to determine why its customers shopped at the store.The results are shown in the bar chart below.What proportion of the customers responded that they shopped at the store because of the merchandise or the convenience?
A)85%
B)70%
C)50%
D)35%
فتح الحزمة
افتح القفل للوصول البطاقات البالغ عددها 178 في هذه المجموعة.
فتح الحزمة
k this deck
20
Instruction 2-2
At a meeting of information systems officers for regional offices of a national company,a survey was taken to determine the number of employees the officers supervise in the operation of their departments,where X is the number of employees overseen by each information systems officer.
-Referring to Instruction 2-2,how many regional offices are represented in the survey results?
A)11
B)40
C)15
D)5
فتح الحزمة
افتح القفل للوصول البطاقات البالغ عددها 178 في هذه المجموعة.
فتح الحزمة
k this deck
21
Instruction 2-5
The following are the durations in minutes of a sample of long-distance phone calls made within Australia reported by one long-distance carrier.
-Referring to Instruction 2-5,if 100 calls were sampled,________ of them would have lasted less than 15 minutes.
A)10
B)26
C)74
D)None of the above.
The following are the durations in minutes of a sample of long-distance phone calls made within Australia reported by one long-distance carrier.
-Referring to Instruction 2-5,if 100 calls were sampled,________ of them would have lasted less than 15 minutes.
A)10
B)26
C)74
D)None of the above.
فتح الحزمة
افتح القفل للوصول البطاقات البالغ عددها 178 في هذه المجموعة.
فتح الحزمة
k this deck
22
Instruction 2-7
The Stem-and-Leaf display below contains data on the number of months between the date a civil suit is filed and when the case is actually adjudicated for 50 cases heard in the Supreme Court of Victoria.
Note: 1L means the "low teens" - 10,11,12,13,or 14;1H means the "high teens" - 15,16,17,18,or 19;2L means the "low twenties" - 20,21,22,23,or 24,etc.
Referring to Instruction 2-7,the civil suit with the longest wait between when the suit was filed and when it was adjudicated had a wait of ________ months.
The Stem-and-Leaf display below contains data on the number of months between the date a civil suit is filed and when the case is actually adjudicated for 50 cases heard in the Supreme Court of Victoria.
Note: 1L means the "low teens" - 10,11,12,13,or 14;1H means the "high teens" - 15,16,17,18,or 19;2L means the "low twenties" - 20,21,22,23,or 24,etc.Referring to Instruction 2-7,the civil suit with the longest wait between when the suit was filed and when it was adjudicated had a wait of ________ months.
فتح الحزمة
افتح القفل للوصول البطاقات البالغ عددها 178 في هذه المجموعة.
فتح الحزمة
k this deck
23
Instruction 2-8
The Stem-and-Leaf display represents the number of times in a year that a random sample of 100 "lifetime" members of a health club actually visited the facility.
Referring to Instruction 2-8,the person who visited the health club less than anyone else in the sample visited the facility ________ times.
فتح الحزمة
افتح القفل للوصول البطاقات البالغ عددها 178 في هذه المجموعة.
فتح الحزمة
k this deck
24
Instruction 2-5
The following are the durations in minutes of a sample of long-distance phone calls made within Australia reported by one long-distance carrier.
-Referring to Instruction 2-5,if 100 calls were sampled,________ of them would have lasted 20 minutes or more.
A)26
B)74
C)16
D)None of the above.
The following are the durations in minutes of a sample of long-distance phone calls made within Australia reported by one long-distance carrier.
-Referring to Instruction 2-5,if 100 calls were sampled,________ of them would have lasted 20 minutes or more.
A)26
B)74
C)16
D)None of the above.
فتح الحزمة
افتح القفل للوصول البطاقات البالغ عددها 178 في هذه المجموعة.
فتح الحزمة
k this deck
25
Instruction 2-8
The Stem-and-Leaf display represents the number of times in a year that a random sample of 100 "lifetime" members of a health club actually visited the facility.
Referring to Instruction 2-8,the person who has the largest leaf associated with the smallest stem visited the facility ________ times.
The Stem-and-Leaf display represents the number of times in a year that a random sample of 100 "lifetime" members of a health club actually visited the facility.
Referring to Instruction 2-8,the person who has the largest leaf associated with the smallest stem visited the facility ________ times.
فتح الحزمة
افتح القفل للوصول البطاقات البالغ عددها 178 في هذه المجموعة.
فتح الحزمة
k this deck
26
Instruction 2-7
The Stem-and-Leaf display below contains data on the number of months between the date a civil suit is filed and when the case is actually adjudicated for 50 cases heard in the Supreme Court of Victoria.
Note: 1L means the "low teens" - 10,11,12,13,or 14;1H means the "high teens" - 15,16,17,18,or 19;2L means the "low twenties" - 20,21,22,23,or 24,etc.
Referring to Instruction 2-7,locate the first leaf,i.e. ,the lowest valued leaf with the lowest valued stem.This represents a wait of ________ months.
The Stem-and-Leaf display below contains data on the number of months between the date a civil suit is filed and when the case is actually adjudicated for 50 cases heard in the Supreme Court of Victoria.
Note: 1L means the "low teens" - 10,11,12,13,or 14;1H means the "high teens" - 15,16,17,18,or 19;2L means the "low twenties" - 20,21,22,23,or 24,etc.Referring to Instruction 2-7,locate the first leaf,i.e. ,the lowest valued leaf with the lowest valued stem.This represents a wait of ________ months.
فتح الحزمة
افتح القفل للوصول البطاقات البالغ عددها 178 في هذه المجموعة.
فتح الحزمة
k this deck
27
The stem-and-leaf display is often superior to the frequency distribution in that it maintains the original values for further analysis.
فتح الحزمة
افتح القفل للوصول البطاقات البالغ عددها 178 في هذه المجموعة.
فتح الحزمة
k this deck
28
Instruction 2-8
The Stem-and-Leaf display represents the number of times in a year that a random sample of 100 "lifetime" members of a health club actually visited the facility.
Referring to Instruction 2-8,________ of the 100 members visited the health club at least 52 times in a year.
The Stem-and-Leaf display represents the number of times in a year that a random sample of 100 "lifetime" members of a health club actually visited the facility.
Referring to Instruction 2-8,________ of the 100 members visited the health club at least 52 times in a year.
فتح الحزمة
افتح القفل للوصول البطاقات البالغ عددها 178 في هذه المجموعة.
فتح الحزمة
k this deck
29
Instruction 2-7
The Stem-and-Leaf display below contains data on the number of months between the date a civil suit is filed and when the case is actually adjudicated for 50 cases heard in the Supreme Court of Victoria.
Note: 1L means the "low teens" - 10,11,12,13,or 14;1H means the "high teens" - 15,16,17,18,or 19;2L means the "low twenties" - 20,21,22,23,or 24,etc.
Referring to Instruction 2-7,________ percent of the cases were not adjudicated within the first 4 years.
The Stem-and-Leaf display below contains data on the number of months between the date a civil suit is filed and when the case is actually adjudicated for 50 cases heard in the Supreme Court of Victoria.
Note: 1L means the "low teens" - 10,11,12,13,or 14;1H means the "high teens" - 15,16,17,18,or 19;2L means the "low twenties" - 20,21,22,23,or 24,etc.Referring to Instruction 2-7,________ percent of the cases were not adjudicated within the first 4 years.
فتح الحزمة
افتح القفل للوصول البطاقات البالغ عددها 178 في هذه المجموعة.
فتح الحزمة
k this deck
30
Instruction 2-8
The Stem-and-Leaf display represents the number of times in a year that a random sample of 100 "lifetime" members of a health club actually visited the facility.
Referring to Instruction 2-8,the person who visited the health club more than anyone else in the sample visited the facility ________ times.
فتح الحزمة
افتح القفل للوصول البطاقات البالغ عددها 178 في هذه المجموعة.
فتح الحزمة
k this deck
31
Instruction 2-5
The following are the durations in minutes of a sample of long-distance phone calls made within Australia reported by one long-distance carrier.
-Referring to Instruction 2-5,if 100 calls were randomly sampled,________ of them would have lasted at least 15 minutes but less than 20 minutes.
A)0.16
B)10
C)0.10
D)16
فتح الحزمة
افتح القفل للوصول البطاقات البالغ عددها 178 في هذه المجموعة.
فتح الحزمة
k this deck
32
Instruction 2-7
The Stem-and-Leaf display below contains data on the number of months between the date a civil suit is filed and when the case is actually adjudicated for 50 cases heard in the Supreme Court of Victoria.
Note: 1L means the "low teens" - 10,11,12,13,or 14;1H means the "high teens" - 15,16,17,18,or 19;2L means the "low twenties" - 20,21,22,23,or 24,etc.
Referring to Instruction 2-7,if a frequency distribution with equal sized classes was made from this data,and the first class was "10 but less than 20",the cumulative percentage of the second class would be ________.
The Stem-and-Leaf display below contains data on the number of months between the date a civil suit is filed and when the case is actually adjudicated for 50 cases heard in the Supreme Court of Victoria.
Note: 1L means the "low teens" - 10,11,12,13,or 14;1H means the "high teens" - 15,16,17,18,or 19;2L means the "low twenties" - 20,21,22,23,or 24,etc.Referring to Instruction 2-7,if a frequency distribution with equal sized classes was made from this data,and the first class was "10 but less than 20",the cumulative percentage of the second class would be ________.
فتح الحزمة
افتح القفل للوصول البطاقات البالغ عددها 178 في هذه المجموعة.
فتح الحزمة
k this deck
33
Instruction 2-7
The Stem-and-Leaf display below contains data on the number of months between the date a civil suit is filed and when the case is actually adjudicated for 50 cases heard in the Supreme Court of Victoria.
Note: 1L means the "low teens" - 10,11,12,13,or 14;1H means the "high teens" - 15,16,17,18,or 19;2L means the "low twenties" - 20,21,22,23,or 24,etc.
Referring to Instruction 2-7,if a frequency distribution with equal sized classes was made from this data,and the first class was "10 but less than 20",the relative frequency of the third class would be ________.
The Stem-and-Leaf display below contains data on the number of months between the date a civil suit is filed and when the case is actually adjudicated for 50 cases heard in the Supreme Court of Victoria.
Note: 1L means the "low teens" - 10,11,12,13,or 14;1H means the "high teens" - 15,16,17,18,or 19;2L means the "low twenties" - 20,21,22,23,or 24,etc.Referring to Instruction 2-7,if a frequency distribution with equal sized classes was made from this data,and the first class was "10 but less than 20",the relative frequency of the third class would be ________.
فتح الحزمة
افتح القفل للوصول البطاقات البالغ عددها 178 في هذه المجموعة.
فتح الحزمة
k this deck
34
Instruction 2-7
The Stem-and-Leaf display below contains data on the number of months between the date a civil suit is filed and when the case is actually adjudicated for 50 cases heard in the Supreme Court of Victoria.
Note: 1L means the "low teens" - 10,11,12,13,or 14;1H means the "high teens" - 15,16,17,18,or 19;2L means the "low twenties" - 20,21,22,23,or 24,etc.
Referring to Instruction 2-7,the civil suit with the fourth shortest waiting time between when the suit was filed and when it was adjudicated had a wait of ________ months.
The Stem-and-Leaf display below contains data on the number of months between the date a civil suit is filed and when the case is actually adjudicated for 50 cases heard in the Supreme Court of Victoria.
Note: 1L means the "low teens" - 10,11,12,13,or 14;1H means the "high teens" - 15,16,17,18,or 19;2L means the "low twenties" - 20,21,22,23,or 24,etc.Referring to Instruction 2-7,the civil suit with the fourth shortest waiting time between when the suit was filed and when it was adjudicated had a wait of ________ months.
فتح الحزمة
افتح القفل للوصول البطاقات البالغ عددها 178 في هذه المجموعة.
فتح الحزمة
k this deck
35
Instruction 2-5
The following are the durations in minutes of a sample of long-distance phone calls made within Australia reported by one long-distance carrier.
-Referring to Instruction 2-5,what is the cumulative relative frequency for the percentage of calls that lasted 10 minutes or more?
A)0.24
B)0.41
C)0.90
D)0.16
فتح الحزمة
افتح القفل للوصول البطاقات البالغ عددها 178 في هذه المجموعة.
فتح الحزمة
k this deck
36
Instruction 2-5
The following are the durations in minutes of a sample of long-distance phone calls made within Australia reported by one long-distance carrier.
-Referring to Instruction 2-5,if 100 calls were sampled,________ of them would have lasted less than 5 minutes or at least 30 minutes or more.
A)39
B)35
C)37
D)None of the above.
فتح الحزمة
افتح القفل للوصول البطاقات البالغ عددها 178 في هذه المجموعة.
فتح الحزمة
k this deck
37
Instruction 2-7
The Stem-and-Leaf display below contains data on the number of months between the date a civil suit is filed and when the case is actually adjudicated for 50 cases heard in the Supreme Court of Victoria.
Note: 1L means the "low teens" - 10,11,12,13,or 14;1H means the "high teens" - 15,16,17,18,or 19;2L means the "low twenties" - 20,21,22,23,or 24,etc.
Referring to Instruction 2-7,if a frequency distribution with equal sized classes was made from this data,and the first class was "10 but less than 20",the frequency of that class would be ________.
The Stem-and-Leaf display below contains data on the number of months between the date a civil suit is filed and when the case is actually adjudicated for 50 cases heard in the Supreme Court of Victoria.
Note: 1L means the "low teens" - 10,11,12,13,or 14;1H means the "high teens" - 15,16,17,18,or 19;2L means the "low twenties" - 20,21,22,23,or 24,etc.Referring to Instruction 2-7,if a frequency distribution with equal sized classes was made from this data,and the first class was "10 but less than 20",the frequency of that class would be ________.
فتح الحزمة
افتح القفل للوصول البطاقات البالغ عددها 178 في هذه المجموعة.
فتح الحزمة
k this deck
38
Data on the number of credit hours of 20,000 students at a public university enrolled in the first semester were collected.Which of the following is the best for presenting the information?
A)A contingency table.
B)A pie chart.
C)A stem-and-leaf display.
D)A Pareto chart.
A)A contingency table.
B)A pie chart.
C)A stem-and-leaf display.
D)A Pareto chart.
فتح الحزمة
افتح القفل للوصول البطاقات البالغ عددها 178 في هذه المجموعة.
فتح الحزمة
k this deck
39
Instruction 2-7
The Stem-and-Leaf display below contains data on the number of months between the date a civil suit is filed and when the case is actually adjudicated for 50 cases heard in the Supreme Court of Victoria.
Note: 1L means the "low teens" - 10,11,12,13,or 14;1H means the "high teens" - 15,16,17,18,or 19;2L means the "low twenties" - 20,21,22,23,or 24,etc.
Referring to Instruction 2-7,________ percent of the cases were adjudicated within the first 2 years.
The Stem-and-Leaf display below contains data on the number of months between the date a civil suit is filed and when the case is actually adjudicated for 50 cases heard in the Supreme Court of Victoria.
Note: 1L means the "low teens" - 10,11,12,13,or 14;1H means the "high teens" - 15,16,17,18,or 19;2L means the "low twenties" - 20,21,22,23,or 24,etc.Referring to Instruction 2-7,________ percent of the cases were adjudicated within the first 2 years.
فتح الحزمة
افتح القفل للوصول البطاقات البالغ عددها 178 في هذه المجموعة.
فتح الحزمة
k this deck
40
Instruction 2-5
The following are the durations in minutes of a sample of long-distance phone calls made within Australia reported by one long-distance carrier.
-Referring to Instruction 2-5,what is the cumulative relative frequency for the percentage of calls that lasted under 20 minutes?
A)0.59
B)0.10
C)0.84
D)0.76
فتح الحزمة
افتح القفل للوصول البطاقات البالغ عددها 178 في هذه المجموعة.
فتح الحزمة
k this deck
41
The sum of cumulative frequencies in a distribution always equals 1.
فتح الحزمة
افتح القفل للوصول البطاقات البالغ عددها 178 في هذه المجموعة.
فتح الحزمة
k this deck
42
When comparing two or more samples with different sample sizes,a relative frequency distribution or a percentage distribution should be used.
فتح الحزمة
افتح القفل للوصول البطاقات البالغ عددها 178 في هذه المجموعة.
فتح الحزمة
k this deck
43
In general,grouped frequency distributions should have between 5 and 15 class intervals.
فتح الحزمة
افتح القفل للوصول البطاقات البالغ عددها 178 في هذه المجموعة.
فتح الحزمة
k this deck
44
The sum of relative frequencies in a distribution always equals 1.
فتح الحزمة
افتح القفل للوصول البطاقات البالغ عددها 178 في هذه المجموعة.
فتح الحزمة
k this deck
45
If the values of the seventh and eighth class in a cumulative frequency distribution are the same,we know that there are no observations in the eighth class.
فتح الحزمة
افتح القفل للوصول البطاقات البالغ عددها 178 في هذه المجموعة.
فتح الحزمة
k this deck
46
Instruction 2-8
The Stem-and-Leaf display represents the number of times in a year that a random sample of 100 "lifetime" members of a health club actually visited the facility.
Referring to Instruction 2-8,________ of the 100 members visited the health club no more than 12 times in a year.
The Stem-and-Leaf display represents the number of times in a year that a random sample of 100 "lifetime" members of a health club actually visited the facility.
Referring to Instruction 2-8,________ of the 100 members visited the health club no more than 12 times in a year.
فتح الحزمة
افتح القفل للوصول البطاقات البالغ عددها 178 في هذه المجموعة.
فتح الحزمة
k this deck
47
Instruction 2-8
The Stem-and-Leaf display represents the number of times in a year that a random sample of 100 "lifetime" members of a health club actually visited the facility.
Referring to Instruction 2-8,if a frequency distribution with equal sized classes was made from this data,and the first class was "0 but less than 10",the frequency of the fifth class would be ________.
فتح الحزمة
افتح القفل للوصول البطاقات البالغ عددها 178 في هذه المجموعة.
فتح الحزمة
k this deck
48
A research analyst was directed to arrange raw data collected on the yield of wheat,ranging from 1 to 5 tonnes per hectare,in a frequency distribution.He should choose 2 as the class interval width.
فتح الحزمة
افتح القفل للوصول البطاقات البالغ عددها 178 في هذه المجموعة.
فتح الحزمة
k this deck
49
Apple Computer,Inc.collected information on the age of their customers.The youngest customer was 12 and the oldest was 72.To study the distribution of the age among its customers,it can use a percentage polygon.
فتح الحزمة
افتح القفل للوصول البطاقات البالغ عددها 178 في هذه المجموعة.
فتح الحزمة
k this deck
50
The relative frequency is the frequency in each class divided by the total number of observations.
فتح الحزمة
افتح القفل للوصول البطاقات البالغ عددها 178 في هذه المجموعة.
فتح الحزمة
k this deck
51
The percentage distribution cannot be constructed from the frequency distribution directly.
فتح الحزمة
افتح القفل للوصول البطاقات البالغ عددها 178 في هذه المجموعة.
فتح الحزمة
k this deck
52
The larger the number of observations in a numerical data set,the larger the number of class intervals needed for a grouped frequency distribution.
فتح الحزمة
افتح القفل للوصول البطاقات البالغ عددها 178 في هذه المجموعة.
فتح الحزمة
k this deck
53
Instruction 2-8
The Stem-and-Leaf display represents the number of times in a year that a random sample of 100 "lifetime" members of a health club actually visited the facility.
Referring to Instruction 2-8,if a frequency distribution with equal sized classes was made from this data,and the first class was "0 but less than 10",the cumulative percentage of the next-to-last class would be ________.
فتح الحزمة
افتح القفل للوصول البطاقات البالغ عددها 178 في هذه المجموعة.
فتح الحزمة
k this deck
54
The original data values cannot be assessed once they are grouped into a frequency distribution table.
فتح الحزمة
افتح القفل للوصول البطاقات البالغ عددها 178 في هذه المجموعة.
فتح الحزمة
k this deck
55
Ogives are plotted at the midpoints of the class groupings.
فتح الحزمة
افتح القفل للوصول البطاقات البالغ عددها 178 في هذه المجموعة.
فتح الحزمة
k this deck
56
When constructing a frequency distribution,classes should be selected in such a way that they are of equal width.
فتح الحزمة
افتح القفل للوصول البطاقات البالغ عددها 178 في هذه المجموعة.
فتح الحزمة
k this deck
57
Percentage polygons are plotted at the boundaries of the class groupings.
فتح الحزمة
افتح القفل للوصول البطاقات البالغ عددها 178 في هذه المجموعة.
فتح الحزمة
k this deck
58
Instruction 2-8
The Stem-and-Leaf display represents the number of times in a year that a random sample of 100 "lifetime" members of a health club actually visited the facility.
Referring to Instruction 2-8,if a frequency distribution with equal sized classes was made from this data,and the first class was "0 but less than 10",the relative frequency of the last class would be ________.
فتح الحزمة
افتح القفل للوصول البطاقات البالغ عددها 178 في هذه المجموعة.
فتح الحزمة
k this deck
59
Determining the class boundaries of a frequency distribution is highly subjective.
فتح الحزمة
افتح القفل للوصول البطاقات البالغ عددها 178 في هذه المجموعة.
فتح الحزمة
k this deck
60
Instruction 2-8
The Stem-and-Leaf display represents the number of times in a year that a random sample of 100 "lifetime" members of a health club actually visited the facility.
Referring to Instruction 2-8,if a frequency distribution with equal sized classes was made from this data,and the first class was "0 but less than 10",the class midpoint of the third class would be ________.
فتح الحزمة
افتح القفل للوصول البطاقات البالغ عددها 178 في هذه المجموعة.
فتح الحزمة
k this deck
61
In general,a frequency distribution should have at least 8 class groups but no more than 20.
فتح الحزمة
افتح القفل للوصول البطاقات البالغ عددها 178 في هذه المجموعة.
فتح الحزمة
k this deck
62
When constructing polygons or histograms,the horizontal axis must specify the true zero or "origin" point so as not to distort the character of the data.
فتح الحزمة
افتح القفل للوصول البطاقات البالغ عددها 178 في هذه المجموعة.
فتح الحزمة
k this deck
63
When constructing charts,the following is plotted at the class midpoints
A)percentage polygons.
B)cumulative relative frequency ogives.
C)frequency histograms.
D)All of the above.
A)percentage polygons.
B)cumulative relative frequency ogives.
C)frequency histograms.
D)All of the above.
فتح الحزمة
افتح القفل للوصول البطاقات البالغ عددها 178 في هذه المجموعة.
فتح الحزمة
k this deck
64
If you wish to construct a graph of a relative frequency distribution,you would most likely construct an ogive first.
فتح الحزمة
افتح القفل للوصول البطاقات البالغ عددها 178 في هذه المجموعة.
فتح الحزمة
k this deck
65
Instruction 2-9
The frequency distribution below represents the rents of 250 randomly selected federally subsidised apartments in Sydney.
Referring to Instruction 2-9,________ apartments rented for at least $400 but less than $600.
The frequency distribution below represents the rents of 250 randomly selected federally subsidised apartments in Sydney.
Referring to Instruction 2-9,________ apartments rented for at least $400 but less than $600.
فتح الحزمة
افتح القفل للوصول البطاقات البالغ عددها 178 في هذه المجموعة.
فتح الحزمة
k this deck
66
The width of each bar in a histogram corresponds to the
A)percentage of observations in each class.
B)midpoint of each class.
C)number of observations in each class.
D)differences between the boundaries of the class.
A)percentage of observations in each class.
B)midpoint of each class.
C)number of observations in each class.
D)differences between the boundaries of the class.
فتح الحزمة
افتح القفل للوصول البطاقات البالغ عددها 178 في هذه المجموعة.
فتح الحزمة
k this deck
67
Referring to the histogram from Figure 2-1,how many graduating students attended the luncheon?
A)388
B)275
C)4
D)152
A)388
B)275
C)4
D)152
فتح الحزمة
افتح القفل للوصول البطاقات البالغ عددها 178 في هذه المجموعة.
فتح الحزمة
k this deck
68
Referring to the histogram from Figure 2-1,if all the tickets purchased were used,how many guests attended the luncheon?
A)275
B)4
C)152
D)388
A)275
B)4
C)152
D)388
فتح الحزمة
افتح القفل للوصول البطاقات البالغ عددها 178 في هذه المجموعة.
فتح الحزمة
k this deck
69
A polygon can be constructed from a bar chart.
فتح الحزمة
افتح القفل للوصول البطاقات البالغ عددها 178 في هذه المجموعة.
فتح الحزمة
k this deck
70
The percentage polygon is formed by having the lower boundary of each class represent the data in that class and then connecting the sequence of lower boundaries at their respective class percentages.
فتح الحزمة
افتح القفل للوصول البطاقات البالغ عددها 178 في هذه المجموعة.
فتح الحزمة
k this deck
71
Data on 1,500 students' weight were collected at a university in Melbourne,Victoria.Which of the following is the best chart for presenting the information?
A)A pie chart.
B)A Pareto chart.
C)A histogram.
D)A side-by-side bar chart.
A)A pie chart.
B)A Pareto chart.
C)A histogram.
D)A side-by-side bar chart.
فتح الحزمة
افتح القفل للوصول البطاقات البالغ عددها 178 في هذه المجموعة.
فتح الحزمة
k this deck
72
Instruction 2-1
An insurance company evaluates many numerical variables about a person before deciding on an appropriate rate for automobile insurance.A representative from a local insurance agency selected a random sample of insured drivers and recorded,X,the number of claims each made in the last 3 years,with the following results.
-Referring to Instruction 2-1,how many total claims are represented in the sample?
A)15
B)111
C)50
D)250
فتح الحزمة
افتح القفل للوصول البطاقات البالغ عددها 178 في هذه المجموعة.
فتح الحزمة
k this deck
73
When polygons or histograms are constructed,which axis must show the true zero or "origin"?
A)The vertical axis.
B)The horizontal axis.
C)Both the horizontal and vertical axes.
D)Neither the horizontal nor the vertical axis.
A)The vertical axis.
B)The horizontal axis.
C)Both the horizontal and vertical axes.
D)Neither the horizontal nor the vertical axis.
فتح الحزمة
افتح القفل للوصول البطاقات البالغ عددها 178 في هذه المجموعة.
فتح الحزمة
k this deck
74
True of False: To determine the width of class interval,divide the number of class groups by the range of the data.
فتح الحزمة
افتح القفل للوصول البطاقات البالغ عددها 178 في هذه المجموعة.
فتح الحزمة
k this deck
75
Instruction 2-2
At a meeting of information systems officers for regional offices of a national company,a survey was taken to determine the number of employees the officers supervise in the operation of their departments,where X is the number of employees overseen by each information systems officer.
-Referring to Instruction 2-2,how many regional offices are represented in the survey results?
A)11
B)5
C)15
D)40
فتح الحزمة
افتح القفل للوصول البطاقات البالغ عددها 178 في هذه المجموعة.
فتح الحزمة
k this deck
76
An ogive is a cumulative percentage polygon.
فتح الحزمة
افتح القفل للوصول البطاقات البالغ عددها 178 في هذه المجموعة.
فتح الحزمة
k this deck
77
Instruction 2-9
The frequency distribution below represents the rents of 250 randomly selected federally subsidised apartments in Sydney.
Referring to Instruction 2-9,________ percent of the apartments rented for no less than $600.
The frequency distribution below represents the rents of 250 randomly selected federally subsidised apartments in Sydney.
Referring to Instruction 2-9,________ percent of the apartments rented for no less than $600.
فتح الحزمة
افتح القفل للوصول البطاقات البالغ عددها 178 في هذه المجموعة.
فتح الحزمة
k this deck
78
A good choice for the number of class groups to use in constructing frequency distribution is to have at least 5 but no more than 15 class groups.
فتح الحزمة
افتح القفل للوصول البطاقات البالغ عددها 178 في هذه المجموعة.
فتح الحزمة
k this deck
79
Instruction 2-2
At a meeting of information systems officers for regional offices of a national company,a survey was taken to determine the number of employees the officers supervise in the operation of their departments,where X is the number of employees overseen by each information systems officer.
-Referring to Instruction 2-2,across all of the regional offices,how many total employees were supervised by those surveyed?
A)200
B)15
C)127
D)40
فتح الحزمة
افتح القفل للوصول البطاقات البالغ عددها 178 في هذه المجموعة.
فتح الحزمة
k this deck
80
Apple Computer,Inc.collected information on the age of their customers.The youngest customer was 12 and the oldest was 72.To study the percentage of their customers who are below a certain age,it can use an ogive.
فتح الحزمة
افتح القفل للوصول البطاقات البالغ عددها 178 في هذه المجموعة.
فتح الحزمة
k this deck
فتح الحزمة
افتح القفل للوصول البطاقات البالغ عددها 178 في هذه المجموعة.


