Deck 3: Supply and Demand
ملء الشاشة (f)
سؤال
سؤال
سؤال
سؤال
Figure: Demand Curve 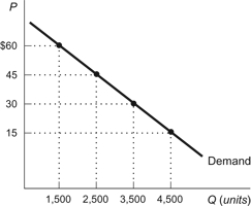 Refer to the figure.What is the maximum price per book that buyers are willing to pay for 2,500 books?
A) $60
B) $45
C) $30
D) $15
Refer to the figure.What is the maximum price per book that buyers are willing to pay for 2,500 books?A) $60
B) $45
C) $30
D) $15
سؤال
Use the following to answer questions
Figure: Good X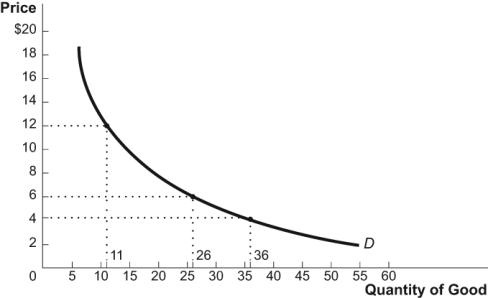
(Figure: Good X)From the figure,the maximum price that consumers are willing to pay for _____ units of Good X is _____ per unit.
A) 36;$4
B) 11;$4
C) 36;$12
D) 26;$4
Figure: Good X
(Figure: Good X)From the figure,the maximum price that consumers are willing to pay for _____ units of Good X is _____ per unit.
A) 36;$4
B) 11;$4
C) 36;$12
D) 26;$4
سؤال
سؤال
Figure: Demand Curve 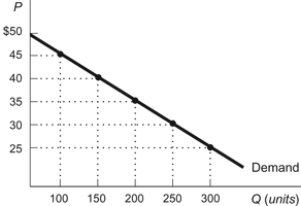 Refer to the figure.What is the maximum amount that buyers are willing and able to pay at a price of $45 per book?
A) 300 books
B) 450 books
C) 100 books
D) 0 books
Refer to the figure.What is the maximum amount that buyers are willing and able to pay at a price of $45 per book?A) 300 books
B) 450 books
C) 100 books
D) 0 books
سؤال
سؤال
Figure: Religion 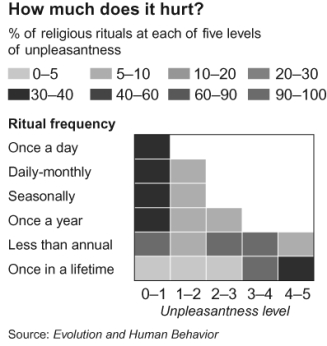 This graph illustrates the work of psychologists Harvey Whitehouse and Quentin Atkinson,as published in the April 23-29,2011 issue of The Economist.The "unpleasantness" of religious rituals (0 is low,5 is high)is along the x-axis.How often the religion requires the ritual to be performed is along the y-axis.What economic concept does this diagram represent?
A) opportunity cost
B) consumer surplus
C) a demand curve
D) an inferior good
This graph illustrates the work of psychologists Harvey Whitehouse and Quentin Atkinson,as published in the April 23-29,2011 issue of The Economist.The "unpleasantness" of religious rituals (0 is low,5 is high)is along the x-axis.How often the religion requires the ritual to be performed is along the y-axis.What economic concept does this diagram represent?A) opportunity cost
B) consumer surplus
C) a demand curve
D) an inferior good
سؤال
سؤال
سؤال
سؤال
Figure: Demand Curve 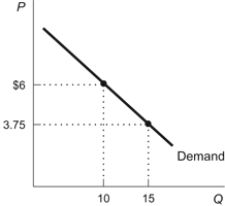 Which statement is TRUE regarding the figure?
A) At a price of $6 per unit,consumers are willing and able to buy 10 units.
B) The maximum price demanders are willing to pay for 15 units is $6 per unit.
C) The higher the price,the greater the quantity demanded.
D) At a price of $3.75 per unit,consumers are indifferent between buying 10 and 15 units.
Which statement is TRUE regarding the figure?A) At a price of $6 per unit,consumers are willing and able to buy 10 units.
B) The maximum price demanders are willing to pay for 15 units is $6 per unit.
C) The higher the price,the greater the quantity demanded.
D) At a price of $3.75 per unit,consumers are indifferent between buying 10 and 15 units.
سؤال
سؤال
سؤال
سؤال
Use the following to answer questions
Figure: Good X
(Figure: Good X)From the figure,which statement is TRUE?
A) At a price of $12 per unit,consumers are willing and able to purchase between 11 and 26 units of Good X.
B) 36 units of Good X can be purchased by spending a total of $4.
C) At a price of $6 per unit,consumers are willing and able to purchase 26 units of Good X.
D) At a price of $4 per unit,consumers are willing and able to purchase 11 units of Good X.
سؤال
سؤال
سؤال
سؤال
سؤال
سؤال
Figure: A Supply Curve 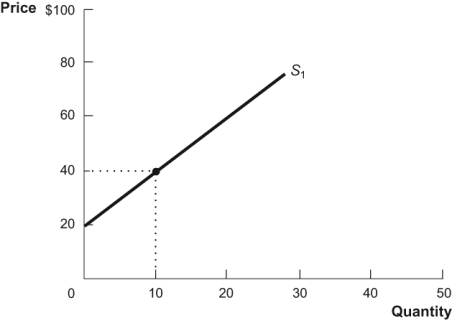 Refer to the figure.Producer surplus at a price of $40 is:
A) $200.
B) $100.
C) $400.
D) $600.
Refer to the figure.Producer surplus at a price of $40 is:A) $200.
B) $100.
C) $400.
D) $600.
سؤال
Use the following to answer questions :Figure: Producer Surplus 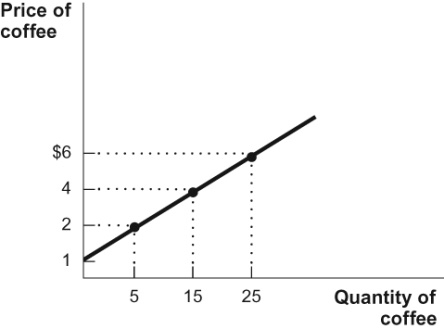
(Figure: Producer Surplus)In the diagram,if the market price of coffee is $6,how much producer surplus do suppliers earn?
A) $25
B) $125
C) $75.50
D) $62.50
(Figure: Producer Surplus)In the diagram,if the market price of coffee is $6,how much producer surplus do suppliers earn?
A) $25
B) $125
C) $75.50
D) $62.50
سؤال
Use the following to answer questions :Figure: Producer Surplus
(Figure: Producer Surplus)In the diagram,if the market price of coffee is $4,how much producer surplus do suppliers earn?
A) $15
B) $45
C) $20
D) $22.50
(Figure: Producer Surplus)In the diagram,if the market price of coffee is $4,how much producer surplus do suppliers earn?
A) $15
B) $45
C) $20
D) $22.50
سؤال
سؤال
سؤال
سؤال
سؤال
Use the following to answer questions
Figure: Potatoes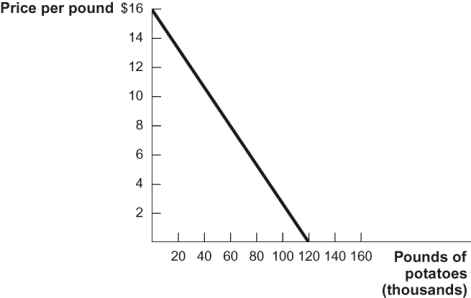
(Figure: Potatoes)Refer to the figure.If the price of potatoes is $8 a pound,what is the consumer surplus received?
A) $30,000
B) $60,000
C) $240,000
D) $360,000
Figure: Potatoes
(Figure: Potatoes)Refer to the figure.If the price of potatoes is $8 a pound,what is the consumer surplus received?
A) $30,000
B) $60,000
C) $240,000
D) $360,000
سؤال
سؤال
سؤال
سؤال
سؤال
سؤال
سؤال
سؤال
سؤال
سؤال
Use the following to answer questions
Figure: Potatoes
(Figure: Potatoes)Refer to the figure.According to the demand curve,if the price of potatoes is $8 a pound,how many pounds are demanded?
A) 5
B) 50
C) 60,000
D) 80,000
Figure: Potatoes
(Figure: Potatoes)Refer to the figure.According to the demand curve,if the price of potatoes is $8 a pound,how many pounds are demanded?
A) 5
B) 50
C) 60,000
D) 80,000
سؤال
سؤال
Figure: Supply Shift 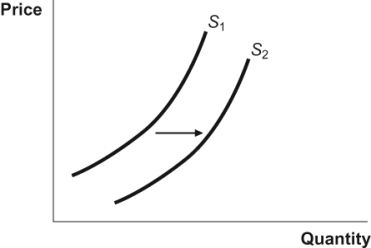 In the figure,a movement from S1 to S2 represents:
A) a decrease in supply.
B) an increase in supply.
C) a decrease in quantity supplied.
D) an increase in quantity supplied.
In the figure,a movement from S1 to S2 represents:A) a decrease in supply.
B) an increase in supply.
C) a decrease in quantity supplied.
D) an increase in quantity supplied.
سؤال
سؤال
سؤال
سؤال
سؤال
سؤال
سؤال
Use the following to answer questions
Figure: Supply Shift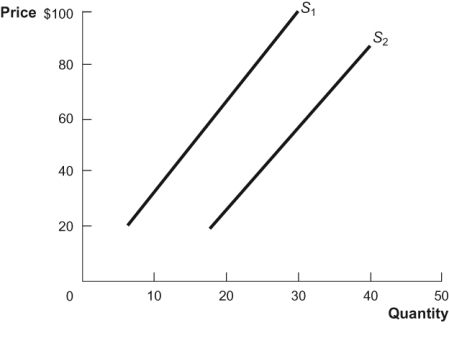
(Figure: Supply Shift)What would cause the supply curve to shift from S1 to S2 as shown in the diagram?
A) an increase in taxes on firms' output
B) an increase in the price of inputs used to produce the output
C) a decrease in the number of firms that produce the output
D) a decrease in the wages paid to union workers who produce the output
سؤال
سؤال
سؤال
سؤال
Use the following to answer questions
Figure: Supply Shift
(Figure: Supply Shift)What would cause the supply curve to shift from S2 to S1 as shown in the diagram?
A) a decrease in the opportunity costs of producing the good
B) a decrease in the costs of production
C) an increase in the prices of inputs used in production
D) an expected decrease in the future price of the good
سؤال
سؤال
سؤال
Figure: Supply Shift 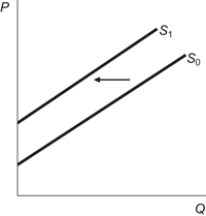 According to the figure,the:
A) costs of producing output have decreased.
B) technology for producing output has improved.
C) costs of producing output have increased.
D) price of the product has decreased.
According to the figure,the:A) costs of producing output have decreased.
B) technology for producing output has improved.
C) costs of producing output have increased.
D) price of the product has decreased.
سؤال
سؤال
سؤال
سؤال
سؤال
سؤال
Use the following to answer questions
Figure: Supply Shifts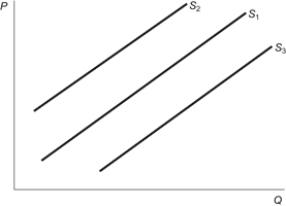
(Figure: Supply Shifts)In the figure,the initial supply curve is S1.Producers engage in market speculation with the belief that the price of the good will increase in the near future.This would be represented in the figure by shifting the:
A) supply curve to S2,resulting in a lower quantity supplied at each price.
B) supply curve to S2,resulting in a higher quantity supplied at each price.
C) supply curve to S3,resulting in a lower quantity supplied at each price.
D) supply curve to S3,resulting in a higher quantity supplied at each price.
سؤال
سؤال
سؤال
سؤال
سؤال
سؤال
سؤال
Figure: Lobster Market 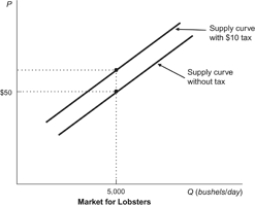 In the figure,a $10 tax is imposed on the market for lobsters.What is the market price that lobster producers would need to receive to induce them to produce 5,000 bushels of lobster per day?
A) $10
B) $40
C) $50
D) $60
In the figure,a $10 tax is imposed on the market for lobsters.What is the market price that lobster producers would need to receive to induce them to produce 5,000 bushels of lobster per day?A) $10
B) $40
C) $50
D) $60
سؤال
سؤال
سؤال
Figure A: Supply Right Shift Figure B: Supply Left Shift 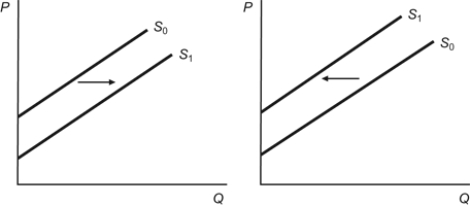 Refer to the two figures.Which statement is TRUE?
A) Figure A depicts the expectation that the future price will decrease.
B) Figure A depicts an increase in taxes.
C) Figure B depicts falling input prices.
D) Figure B depicts technological innovations.
Refer to the two figures.Which statement is TRUE?A) Figure A depicts the expectation that the future price will decrease.
B) Figure A depicts an increase in taxes.
C) Figure B depicts falling input prices.
D) Figure B depicts technological innovations.
سؤال
سؤال
سؤال
سؤال
سؤال
Use the following to answer questions
Figure: Supply Shift 2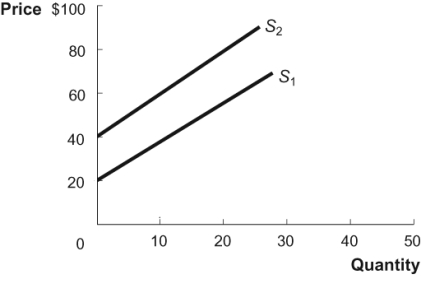
(Figure: Supply Shift 2)Refer to the figure.What would cause the supply curve to shift from S1 to S2?
A) a $20 tax on each unit of output
B) a $40 tax on each unit of output
C) a $40 subsidy on each unit of output
D) a $20 subsidy on each unit of output
Figure: Supply Shift 2
(Figure: Supply Shift 2)Refer to the figure.What would cause the supply curve to shift from S1 to S2?
A) a $20 tax on each unit of output
B) a $40 tax on each unit of output
C) a $40 subsidy on each unit of output
D) a $20 subsidy on each unit of output
سؤال
Use the following to answer questions
Figure: Supply Shift 2
(Figure: Supply Shift 2)Refer to the figure.What would cause the supply curve to shift from S1 to S2?
A) a $20 tax reduction on each unit of output
B) a $40 tax reduction on each unit of output
C) a $40 subsidy reduction on each unit of output
D) a $20 subsidy reduction on each unit of output
سؤال
Use the following to answer questions
Figure: Supply Shifts
(Figure: Supply Shifts)In the figure,the initial supply curve is S1.If producers form expectations that the price will be lower in the near future,S1 will:
A) shift to S2 now.
B) shift to S3 now.
C) not shift now.
D) only shift to S3 in the future.
Figure: Supply Shifts
(Figure: Supply Shifts)In the figure,the initial supply curve is S1.If producers form expectations that the price will be lower in the near future,S1 will:
A) shift to S2 now.
B) shift to S3 now.
C) not shift now.
D) only shift to S3 in the future.
سؤال

فتح الحزمة
قم بالتسجيل لفتح البطاقات في هذه المجموعة!
Unlock Deck
Unlock Deck
1/135
العب
ملء الشاشة (f)
Deck 3: Supply and Demand
1
The law of demand states that:
A) the lower the price,the greater the quantity demanded.
B) the higher the price,the higher the quantity demanded.
C) the demand curve is upward sloping.
D) an increase in income increases the quantity demanded.
A) the lower the price,the greater the quantity demanded.
B) the higher the price,the higher the quantity demanded.
C) the demand curve is upward sloping.
D) an increase in income increases the quantity demanded.
the lower the price,the greater the quantity demanded.
2
Which statement correctly completes the definition of a demand curve? A demand curve is a function that shows the relationship between:
A) price and the quantity sold.
B) price and the quantity supplied.
C) price and the quantity demanded.
D) quantity demanded and quantity supplied.
A) price and the quantity sold.
B) price and the quantity supplied.
C) price and the quantity demanded.
D) quantity demanded and quantity supplied.
price and the quantity demanded.
3
The demand curve shows the relationship between:
A) demand and supply.
B) quantity demanded and quantity supplied.
C) price and quantity supplied.
D) price and quantity demanded.
A) demand and supply.
B) quantity demanded and quantity supplied.
C) price and quantity supplied.
D) price and quantity demanded.
price and quantity demanded.
4
Figure: Demand Curve Refer to the figure.What is the maximum price per book that buyers are willing to pay for 2,500 books?
A) $60
B) $45
C) $30
D) $15
Refer to the figure.What is the maximum price per book that buyers are willing to pay for 2,500 books?A) $60
B) $45
C) $30
D) $15
فتح الحزمة
افتح القفل للوصول البطاقات البالغ عددها 135 في هذه المجموعة.
فتح الحزمة
k this deck
5
Use the following to answer questions
Figure: Good X
(Figure: Good X)From the figure,the maximum price that consumers are willing to pay for _____ units of Good X is _____ per unit.
A) 36;$4
B) 11;$4
C) 36;$12
D) 26;$4
Figure: Good X
(Figure: Good X)From the figure,the maximum price that consumers are willing to pay for _____ units of Good X is _____ per unit.
A) 36;$4
B) 11;$4
C) 36;$12
D) 26;$4
فتح الحزمة
افتح القفل للوصول البطاقات البالغ عددها 135 في هذه المجموعة.
فتح الحزمة
k this deck
6
The demand curve:
A) shows how much buyers are willing and able to buy at different prices.
B) is the amount that buyers are willing and able to buy at a particular price.
C) shows how much sellers are willing and able to sell at different prices.
D) is the amount that sellers are willing and able to sell at a particular price.
فتح الحزمة
افتح القفل للوصول البطاقات البالغ عددها 135 في هذه المجموعة.
فتح الحزمة
k this deck
7
Figure: Demand Curve Refer to the figure.What is the maximum amount that buyers are willing and able to pay at a price of $45 per book?
A) 300 books
B) 450 books
C) 100 books
D) 0 books
Refer to the figure.What is the maximum amount that buyers are willing and able to pay at a price of $45 per book?A) 300 books
B) 450 books
C) 100 books
D) 0 books
فتح الحزمة
افتح القفل للوصول البطاقات البالغ عددها 135 في هذه المجموعة.
فتح الحزمة
k this deck
8
The demand curve for oil shows:
A) the quantity demanded of oil at different income levels.
B) the quantity demanded of oil at different oil prices.
C) the demand for oil at different prices of other goods.
D) the demand for oil when there is a surplus or shortage.
A) the quantity demanded of oil at different income levels.
B) the quantity demanded of oil at different oil prices.
C) the demand for oil at different prices of other goods.
D) the demand for oil when there is a surplus or shortage.
فتح الحزمة
افتح القفل للوصول البطاقات البالغ عددها 135 في هذه المجموعة.
فتح الحزمة
k this deck
9
Figure: Religion This graph illustrates the work of psychologists Harvey Whitehouse and Quentin Atkinson,as published in the April 23-29,2011 issue of The Economist.The "unpleasantness" of religious rituals (0 is low,5 is high)is along the x-axis.How often the religion requires the ritual to be performed is along the y-axis.What economic concept does this diagram represent?
A) opportunity cost
B) consumer surplus
C) a demand curve
D) an inferior good
This graph illustrates the work of psychologists Harvey Whitehouse and Quentin Atkinson,as published in the April 23-29,2011 issue of The Economist.The "unpleasantness" of religious rituals (0 is low,5 is high)is along the x-axis.How often the religion requires the ritual to be performed is along the y-axis.What economic concept does this diagram represent?A) opportunity cost
B) consumer surplus
C) a demand curve
D) an inferior good
فتح الحزمة
افتح القفل للوصول البطاقات البالغ عددها 135 في هذه المجموعة.
فتح الحزمة
k this deck
10
The quantity demanded is the quantity that buyers are:
A) willing to buy but they cannot afford to pay.
B) able to buy at a given income level but not willing to pay.
C) willing to buy at a given income level.
D) willing and able to buy at a given price.
A) willing to buy but they cannot afford to pay.
B) able to buy at a given income level but not willing to pay.
C) willing to buy at a given income level.
D) willing and able to buy at a given price.
فتح الحزمة
افتح القفل للوصول البطاقات البالغ عددها 135 في هذه المجموعة.
فتح الحزمة
k this deck
11
Which of the following is TRUE about demand curves?
A) Demand curves are negatively sloped.
B) Demand curves are U-shaped.
C) Demand curves are positively sloped.
D) Demand curves are vertical.
A) Demand curves are negatively sloped.
B) Demand curves are U-shaped.
C) Demand curves are positively sloped.
D) Demand curves are vertical.
فتح الحزمة
افتح القفل للوصول البطاقات البالغ عددها 135 في هذه المجموعة.
فتح الحزمة
k this deck
12
Quantity demanded:
A) shows how much buyers are willing and able to buy at different prices.
B) is the amount that buyers are willing and able to buy at a particular price.
C) shows how much sellers are willing and able to sell at different prices.
D) is the amount that sellers are willing and able to sell at a particular price.
فتح الحزمة
افتح القفل للوصول البطاقات البالغ عددها 135 في هذه المجموعة.
فتح الحزمة
k this deck
13
Figure: Demand Curve Which statement is TRUE regarding the figure?
A) At a price of $6 per unit,consumers are willing and able to buy 10 units.
B) The maximum price demanders are willing to pay for 15 units is $6 per unit.
C) The higher the price,the greater the quantity demanded.
D) At a price of $3.75 per unit,consumers are indifferent between buying 10 and 15 units.
Which statement is TRUE regarding the figure?A) At a price of $6 per unit,consumers are willing and able to buy 10 units.
B) The maximum price demanders are willing to pay for 15 units is $6 per unit.
C) The higher the price,the greater the quantity demanded.
D) At a price of $3.75 per unit,consumers are indifferent between buying 10 and 15 units.
فتح الحزمة
افتح القفل للوصول البطاقات البالغ عددها 135 في هذه المجموعة.
فتح الحزمة
k this deck
14
What does the law of demand state?
A) As incomes increase,people consume more of all goods.
B) The demand for a good increases with the number of consumers in the market.
C) As the price of a good increases,consumers purchase less of that good.
D) The supply of a good increases in proportion to the demand for it.
A) As incomes increase,people consume more of all goods.
B) The demand for a good increases with the number of consumers in the market.
C) As the price of a good increases,consumers purchase less of that good.
D) The supply of a good increases in proportion to the demand for it.
فتح الحزمة
افتح القفل للوصول البطاقات البالغ عددها 135 في هذه المجموعة.
فتح الحزمة
k this deck
15
Which statement expresses the law of demand?
A) There is a positive relationship between price and consumer surplus.
B) There is a positive relationship between price and quantity that buyers are willing and able to purchase.
C) There is an inverse relationship between the willingness to pay and the ability to pay.
D) There is a negative relationship between price and quantity demanded.
فتح الحزمة
افتح القفل للوصول البطاقات البالغ عددها 135 في هذه المجموعة.
فتح الحزمة
k this deck
16
The quantity demanded of a good or service is the amount that:
A) consumers are willing and able to buy at a given price.
B) firms are willing to sell during a given time period at a given price.
C) a consumer would like to buy but might not be able to afford.
D) a consumer needs to consume during a given time period.
A) consumers are willing and able to buy at a given price.
B) firms are willing to sell during a given time period at a given price.
C) a consumer would like to buy but might not be able to afford.
D) a consumer needs to consume during a given time period.
فتح الحزمة
افتح القفل للوصول البطاقات البالغ عددها 135 في هذه المجموعة.
فتح الحزمة
k this deck
17
Use the following to answer questions
Figure: Good X
(Figure: Good X)From the figure,which statement is TRUE?
A) At a price of $12 per unit,consumers are willing and able to purchase between 11 and 26 units of Good X.
B) 36 units of Good X can be purchased by spending a total of $4.
C) At a price of $6 per unit,consumers are willing and able to purchase 26 units of Good X.
D) At a price of $4 per unit,consumers are willing and able to purchase 11 units of Good X.
فتح الحزمة
افتح القفل للوصول البطاقات البالغ عددها 135 في هذه المجموعة.
فتح الحزمة
k this deck
18
The most important concepts in economics,according to the textbook,are supply,demand,and the:
A) idea of equilibrium.
B) opportunity to barter.
C) quantity of sales.
D) the level of prices.
A) idea of equilibrium.
B) opportunity to barter.
C) quantity of sales.
D) the level of prices.
فتح الحزمة
افتح القفل للوصول البطاقات البالغ عددها 135 في هذه المجموعة.
فتح الحزمة
k this deck
19
A supply and/or demand graph typically shows:
A) the price of the good on the horizontal axis and the quantity of the good on the vertical axis.
B) the quantity of the good on the horizontal axis and the price of the good on the vertical axis.
C) supply or demand of the good on the horizontal axis and price of the good on the vertical axis.
D) price of the good on the horizontal axis and supply or demand of the good on the vertical axis.
فتح الحزمة
افتح القفل للوصول البطاقات البالغ عددها 135 في هذه المجموعة.
فتح الحزمة
k this deck
20
Recall the discussion about the demand for oil in your textbook.Which of the following correctly explains why the demand curve for oil is negatively sloped? As the price of oil rises:
A) consumers use oil for more and varied purposes.
B) consumers increasingly use oil only for those purposes without good substitutes.
C) consumers have an incentive to use oil more freely.
D) more producers are more willing and able to produce oil.
A) consumers use oil for more and varied purposes.
B) consumers increasingly use oil only for those purposes without good substitutes.
C) consumers have an incentive to use oil more freely.
D) more producers are more willing and able to produce oil.
فتح الحزمة
افتح القفل للوصول البطاقات البالغ عددها 135 في هذه المجموعة.
فتح الحزمة
k this deck
21
A demand curve indicates that:
A) the quantity demanded of a good is higher when its price is higher.
B) the quantity demanded of a good is higher when its price is lower.
C) the demand for a good is higher when its price is lower.
D) the demand for a good is higher when its price is higher.
A) the quantity demanded of a good is higher when its price is higher.
B) the quantity demanded of a good is higher when its price is lower.
C) the demand for a good is higher when its price is lower.
D) the demand for a good is higher when its price is higher.
فتح الحزمة
افتح القفل للوصول البطاقات البالغ عددها 135 في هذه المجموعة.
فتح الحزمة
k this deck
22
Producer surplus is:
A) the difference between the market price and the minimum price at which producers are willing to sell a good.
B) the amount at which producers are willing to sell a good.
C) the amount at which producers sell a good.
D) the amount at which producers are willing to sell a good plus the amount at which they sell it.
فتح الحزمة
افتح القفل للوصول البطاقات البالغ عددها 135 في هذه المجموعة.
فتح الحزمة
k this deck
23
Figure: A Supply Curve Refer to the figure.Producer surplus at a price of $40 is:
A) $200.
B) $100.
C) $400.
D) $600.
Refer to the figure.Producer surplus at a price of $40 is:A) $200.
B) $100.
C) $400.
D) $600.
فتح الحزمة
افتح القفل للوصول البطاقات البالغ عددها 135 في هذه المجموعة.
فتح الحزمة
k this deck
24
Use the following to answer questions :Figure: Producer Surplus
(Figure: Producer Surplus)In the diagram,if the market price of coffee is $6,how much producer surplus do suppliers earn?
A) $25
B) $125
C) $75.50
D) $62.50
(Figure: Producer Surplus)In the diagram,if the market price of coffee is $6,how much producer surplus do suppliers earn?
A) $25
B) $125
C) $75.50
D) $62.50
فتح الحزمة
افتح القفل للوصول البطاقات البالغ عددها 135 في هذه المجموعة.
فتح الحزمة
k this deck
25
Use the following to answer questions :Figure: Producer Surplus
(Figure: Producer Surplus)In the diagram,if the market price of coffee is $4,how much producer surplus do suppliers earn?
A) $15
B) $45
C) $20
D) $22.50
(Figure: Producer Surplus)In the diagram,if the market price of coffee is $4,how much producer surplus do suppliers earn?
A) $15
B) $45
C) $20
D) $22.50
فتح الحزمة
افتح القفل للوصول البطاقات البالغ عددها 135 في هذه المجموعة.
فتح الحزمة
k this deck
26
Total producer surplus equals:
A) the supply curve.
B) the area above the supply curve and beneath the market price.
C) the area beneath the supply curve and above the demand curve.
D) the market price.
A) the supply curve.
B) the area above the supply curve and beneath the market price.
C) the area beneath the supply curve and above the demand curve.
D) the market price.
فتح الحزمة
افتح القفل للوصول البطاقات البالغ عددها 135 في هذه المجموعة.
فتح الحزمة
k this deck
27
Demand slopes down because:
A) supply slopes up,and supply and demand must intersect.
B) consumers focus too much on the price of goods when they choose the quantity to demand.
C) goods usually only have a single use.
D) consumers will choose to use goods only in their most valuable uses when prices are high.
A) supply slopes up,and supply and demand must intersect.
B) consumers focus too much on the price of goods when they choose the quantity to demand.
C) goods usually only have a single use.
D) consumers will choose to use goods only in their most valuable uses when prices are high.
فتح الحزمة
افتح القفل للوصول البطاقات البالغ عددها 135 في هذه المجموعة.
فتح الحزمة
k this deck
28
Which of the following explains why the demand for oil has a negative slope?
A) Oil is equally valuable in all of its uses.
B) Oil is not equally valuable in all of its uses.
C) Oil has many uses.
D) Oil has few substitutes.
A) Oil is equally valuable in all of its uses.
B) Oil is not equally valuable in all of its uses.
C) Oil has many uses.
D) Oil has few substitutes.
فتح الحزمة
افتح القفل للوصول البطاقات البالغ عددها 135 في هذه المجموعة.
فتح الحزمة
k this deck
29
The demand curve for oil has a _____ slope because a _____ price of oil signals consumers to use oil in _____ valuable uses.
A) negative;higher;less
B) negative;lower;more
C) positive;higher;more
D) negative;lower;less
A) negative;higher;less
B) negative;lower;more
C) positive;higher;more
D) negative;lower;less
فتح الحزمة
افتح القفل للوصول البطاقات البالغ عددها 135 في هذه المجموعة.
فتح الحزمة
k this deck
30
Use the following to answer questions
Figure: Potatoes
(Figure: Potatoes)Refer to the figure.If the price of potatoes is $8 a pound,what is the consumer surplus received?
A) $30,000
B) $60,000
C) $240,000
D) $360,000
Figure: Potatoes
(Figure: Potatoes)Refer to the figure.If the price of potatoes is $8 a pound,what is the consumer surplus received?
A) $30,000
B) $60,000
C) $240,000
D) $360,000
فتح الحزمة
افتح القفل للوصول البطاقات البالغ عددها 135 في هذه المجموعة.
فتح الحزمة
k this deck
31
The demand curve for oil slopes downward because:
A) oil will only be used in its higher-valued uses when the price of oil is lower.
B) oil will only be used in its higher-valued uses when the price of oil is higher.
C) oil has many substitutes so that no buyer is willing to pay when the price of oil rises.
D) oil has no substitutes so that buyers do not react to any change in the price of oil.
فتح الحزمة
افتح القفل للوصول البطاقات البالغ عددها 135 في هذه المجموعة.
فتح الحزمة
k this deck
32
Which of the following statements is TRUE?
A) Consumer surplus is the difference between the maximum price a consumer is willing to pay for a good or service and its market price.
B) Bill is willing to pay $10 for a pound of clay.If he buys a pound of clay at a market price per pound of $5,his consumer surplus is $2.
C) Total consumer surplus is represented graphically by the area beneath the demand curve.
D) Total consumer surplus is represented graphically by the area above the demand curve.
فتح الحزمة
افتح القفل للوصول البطاقات البالغ عددها 135 في هذه المجموعة.
فتح الحزمة
k this deck
33
When the price of wood is high:
A) consumers will be more likely to use wood in its least valuable uses.
B) consumers will be more likely to use wood in its most valuable uses.
C) the quantity demanded of wood will also rise.
D) the quantity demanded of wood will be unaffected.
A) consumers will be more likely to use wood in its least valuable uses.
B) consumers will be more likely to use wood in its most valuable uses.
C) the quantity demanded of wood will also rise.
D) the quantity demanded of wood will be unaffected.
فتح الحزمة
افتح القفل للوصول البطاقات البالغ عددها 135 في هذه المجموعة.
فتح الحزمة
k this deck
34
If the price of oil were sufficiently high,it would be used only in:
A) making plastics.
B) generating heat.
C) powering cars and jets.
D) making kerosene.
A) making plastics.
B) generating heat.
C) powering cars and jets.
D) making kerosene.
فتح الحزمة
افتح القفل للوصول البطاقات البالغ عددها 135 في هذه المجموعة.
فتح الحزمة
k this deck
35
The difference between the market price and the minimum price at which a seller is willing to sell a certain quantity of a good is:
A) producer shortage.
B) consumer shortage.
C) producer surplus.
D) consumer surplus.
A) producer shortage.
B) consumer shortage.
C) producer surplus.
D) consumer surplus.
فتح الحزمة
افتح القفل للوصول البطاقات البالغ عددها 135 في هذه المجموعة.
فتح الحزمة
k this deck
36
Which of the following statements is TRUE?
A) When the price of oil is high,consumers will use oil for both valuable and less valuable uses.
B) When the price of oil is low,consumers will use oil only for its most valuable uses.
C) When the price of oil rises,consumers tend to use oil for uses in which there are few substitutes for it.
D) When the price of oil falls,consumers start to conserve oil and only use it when there are no other options.
فتح الحزمة
افتح القفل للوصول البطاقات البالغ عددها 135 في هذه المجموعة.
فتح الحزمة
k this deck
37
Suppose that Saudi Arabia can produce oil at $4 per barrel,Iran at $10 per barrel,and Canada at $25 per barrel.If the price of oil is $90 per barrel,what is total producer surplus per barrel for world suppliers?
A) $270
B) $129
C) $231
D) $51
A) $270
B) $129
C) $231
D) $51
فتح الحزمة
افتح القفل للوصول البطاقات البالغ عددها 135 في هذه المجموعة.
فتح الحزمة
k this deck
38
The law of demand suggests a _____ relationship between price and _____.
A) positive;quantity demanded
B) positive;quantity supplied
C) negative;quantity demanded
D) negative;,quantity supplied
A) positive;quantity demanded
B) positive;quantity supplied
C) negative;quantity demanded
D) negative;,quantity supplied
فتح الحزمة
افتح القفل للوصول البطاقات البالغ عددها 135 في هذه المجموعة.
فتح الحزمة
k this deck
39
If prices rise,what happens to producer surplus (all other things being equal)?
A) It falls,because fewer people buy goods.
B) It falls,because it encourages competition,which reduces profits.
C) It rises,because each producer is getting more surplus per good sold.
D) It stays the same,because the forces increasing the surplus counteract the forces reducing it.
A) It falls,because fewer people buy goods.
B) It falls,because it encourages competition,which reduces profits.
C) It rises,because each producer is getting more surplus per good sold.
D) It stays the same,because the forces increasing the surplus counteract the forces reducing it.
فتح الحزمة
افتح القفل للوصول البطاقات البالغ عددها 135 في هذه المجموعة.
فتح الحزمة
k this deck
40
Use the following to answer questions
Figure: Potatoes
(Figure: Potatoes)Refer to the figure.According to the demand curve,if the price of potatoes is $8 a pound,how many pounds are demanded?
A) 5
B) 50
C) 60,000
D) 80,000
Figure: Potatoes
(Figure: Potatoes)Refer to the figure.According to the demand curve,if the price of potatoes is $8 a pound,how many pounds are demanded?
A) 5
B) 50
C) 60,000
D) 80,000
فتح الحزمة
افتح القفل للوصول البطاقات البالغ عددها 135 في هذه المجموعة.
فتح الحزمة
k this deck
41
When the price of inputs increase:
A) the supply curve shifts down and to the right.
B) the supply curve shifts up and to the left.
C) there is an upward movement along the supply curve.
D) there is a downward movement along the supply curve.
A) the supply curve shifts down and to the right.
B) the supply curve shifts up and to the left.
C) there is an upward movement along the supply curve.
D) there is a downward movement along the supply curve.
فتح الحزمة
افتح القفل للوصول البطاقات البالغ عددها 135 في هذه المجموعة.
فتح الحزمة
k this deck
42
Figure: Supply Shift In the figure,a movement from S1 to S2 represents:
A) a decrease in supply.
B) an increase in supply.
C) a decrease in quantity supplied.
D) an increase in quantity supplied.
In the figure,a movement from S1 to S2 represents:A) a decrease in supply.
B) an increase in supply.
C) a decrease in quantity supplied.
D) an increase in quantity supplied.
فتح الحزمة
افتح القفل للوصول البطاقات البالغ عددها 135 في هذه المجموعة.
فتح الحزمة
k this deck
43
A subsidy is a:
A) reverse tax.
B) means of shifting the supply curve left.
C) form of tax increase.
D) movement along the supply curve.
A) reverse tax.
B) means of shifting the supply curve left.
C) form of tax increase.
D) movement along the supply curve.
فتح الحزمة
افتح القفل للوصول البطاقات البالغ عددها 135 في هذه المجموعة.
فتح الحزمة
k this deck
44
In the market for fertilizer,an:
A) increase in the wage rate will increase the demand for fertilizer.
B) advance in technology will increase the supply of fertilizer.
C) increase in the wage rate will increase the supply of fertilizer.
D) increase in the cost of equipment will increase the supply of fertilizer.
A) increase in the wage rate will increase the demand for fertilizer.
B) advance in technology will increase the supply of fertilizer.
C) increase in the wage rate will increase the supply of fertilizer.
D) increase in the cost of equipment will increase the supply of fertilizer.
فتح الحزمة
افتح القفل للوصول البطاقات البالغ عددها 135 في هذه المجموعة.
فتح الحزمة
k this deck
45
A change in which factor would shift the supply curve?
A) the price of the good being sold
B) the demand for the product
C) production technology
D) the willingness of consumers to pay
A) the price of the good being sold
B) the demand for the product
C) production technology
D) the willingness of consumers to pay
فتح الحزمة
افتح القفل للوصول البطاقات البالغ عددها 135 في هذه المجموعة.
فتح الحزمة
k this deck
46
An increase in production costs at any given quantity _______ supply.
A) increases
B) decreases
C) does not change
D) changes in an indeterminate direction
A) increases
B) decreases
C) does not change
D) changes in an indeterminate direction
فتح الحزمة
افتح القفل للوصول البطاقات البالغ عددها 135 في هذه المجموعة.
فتح الحزمة
k this deck
47
As the price of lead falls (a key input in the production of automobile batteries),the costs of producing batteries decreases,shifting the supply curve of batteries:
A) down and to the left.
B) up and to the right.
C) down and to the right.
D) up and to the left.
A) down and to the left.
B) up and to the right.
C) down and to the right.
D) up and to the left.
فتح الحزمة
افتح القفل للوصول البطاقات البالغ عددها 135 في هذه المجموعة.
فتح الحزمة
k this deck
48
Firms are willing and able to sell 100 guitars per day at a price of $250 per guitar.What price will firms require to sell 100 guitars per day if there is a tax of $15 per guitar?
A) $235
B) $250
C) between $235 and $250
D) $265
A) $235
B) $250
C) between $235 and $250
D) $265
فتح الحزمة
افتح القفل للوصول البطاقات البالغ عددها 135 في هذه المجموعة.
فتح الحزمة
k this deck
49
Use the following to answer questions
Figure: Supply Shift
(Figure: Supply Shift)What would cause the supply curve to shift from S1 to S2 as shown in the diagram?
A) an increase in taxes on firms' output
B) an increase in the price of inputs used to produce the output
C) a decrease in the number of firms that produce the output
D) a decrease in the wages paid to union workers who produce the output
فتح الحزمة
افتح القفل للوصول البطاقات البالغ عددها 135 في هذه المجموعة.
فتح الحزمة
k this deck
50
In the oil market,an increase in the wage of oil workers will shift the:
A) supply curve of oil to the right.
B) supply curve of oil to the left.
C) demand curve for oil to the left.
D) demand curve for oil to the right.
A) supply curve of oil to the right.
B) supply curve of oil to the left.
C) demand curve for oil to the left.
D) demand curve for oil to the right.
فتح الحزمة
افتح القفل للوصول البطاقات البالغ عددها 135 في هذه المجموعة.
فتح الحزمة
k this deck
51
Which of the following factors causes a decrease in supply?
A) a decrease in demand
B) a decrease in the price of the product
C) an increase in the price of the product
D) new taxes on output
A) a decrease in demand
B) a decrease in the price of the product
C) an increase in the price of the product
D) new taxes on output
فتح الحزمة
افتح القفل للوصول البطاقات البالغ عددها 135 في هذه المجموعة.
فتح الحزمة
k this deck
52
A decrease in production costs at any given quantity ______ supply.
A) increases
B) decreases
C) does not change
D) may increase or decrease
A) increases
B) decreases
C) does not change
D) may increase or decrease
فتح الحزمة
افتح القفل للوصول البطاقات البالغ عددها 135 في هذه المجموعة.
فتح الحزمة
k this deck
53
Use the following to answer questions
Figure: Supply Shift
(Figure: Supply Shift)What would cause the supply curve to shift from S2 to S1 as shown in the diagram?
A) a decrease in the opportunity costs of producing the good
B) a decrease in the costs of production
C) an increase in the prices of inputs used in production
D) an expected decrease in the future price of the good
فتح الحزمة
افتح القفل للوصول البطاقات البالغ عددها 135 في هذه المجموعة.
فتح الحزمة
k this deck
54
New production technology in the manufacture of plasma television screens has reduced the number of defective screens.What effect will this have in the market for plasma televisions?
A) The demand curve will increase.
B) The supply curve will increase.
C) The demand and supply curve both increase.
D) The demand curve will decrease.
A) The demand curve will increase.
B) The supply curve will increase.
C) The demand and supply curve both increase.
D) The demand curve will decrease.
فتح الحزمة
افتح القفل للوصول البطاقات البالغ عددها 135 في هذه المجموعة.
فتح الحزمة
k this deck
55
An increase in supply refers to:
A) a rightward shift of the supply curve.
B) a leftward shift of the supply curve.
C) an upward movement along the supply curve.
D) a downward movement along the supply curve.
A) a rightward shift of the supply curve.
B) a leftward shift of the supply curve.
C) an upward movement along the supply curve.
D) a downward movement along the supply curve.
فتح الحزمة
افتح القفل للوصول البطاقات البالغ عددها 135 في هذه المجموعة.
فتح الحزمة
k this deck
56
Figure: Supply Shift According to the figure,the:
A) costs of producing output have decreased.
B) technology for producing output has improved.
C) costs of producing output have increased.
D) price of the product has decreased.
According to the figure,the:A) costs of producing output have decreased.
B) technology for producing output has improved.
C) costs of producing output have increased.
D) price of the product has decreased.
فتح الحزمة
افتح القفل للوصول البطاقات البالغ عددها 135 في هذه المجموعة.
فتح الحزمة
k this deck
57
Anonymity on the Internet has lowered the cost of rudely confronting people.What has happened to the supply of rude confrontations?
A) The supply has increased,shifting up and to the left.
B) The supply has increased,shifting down and to the right.
C) The supply has decreased,shifting up and to the left.
D) The supply has decreased,shifting down and to the right.
A) The supply has increased,shifting up and to the left.
B) The supply has increased,shifting down and to the right.
C) The supply has decreased,shifting up and to the left.
D) The supply has decreased,shifting down and to the right.
فتح الحزمة
افتح القفل للوصول البطاقات البالغ عددها 135 في هذه المجموعة.
فتح الحزمة
k this deck
58
A government subsidy to producers causes the:
A) supply of the product to increase.
B) supply of the product to decrease.
C) supply curve to change slope.
D) supply curve to shift up and to the left.
A) supply of the product to increase.
B) supply of the product to decrease.
C) supply curve to change slope.
D) supply curve to shift up and to the left.
فتح الحزمة
افتح القفل للوصول البطاقات البالغ عددها 135 في هذه المجموعة.
فتح الحزمة
k this deck
59
Which of the following choices contains only factors that cause the supply curve to shift to the right?
A) a fall in production costs,a rise in technology,an increase in taxes on output
B) a fall in tastes and preferences for the product,economic growth,and a rise in technology
C) a decrease in taxes on production,a fall in subsidies on production,a rise in costs of production
D) a rise in technology,a fall in the costs of production,a fall in taxes on output
فتح الحزمة
افتح القفل للوصول البطاقات البالغ عددها 135 في هذه المجموعة.
فتح الحزمة
k this deck
60
An increase in supply shifts the supply curve:
A) down and to the right.
B) down and to the left.
C) up and to the right.
D) up and to the left.
A) down and to the right.
B) down and to the left.
C) up and to the right.
D) up and to the left.
فتح الحزمة
افتح القفل للوصول البطاقات البالغ عددها 135 في هذه المجموعة.
فتح الحزمة
k this deck
61
An increase in a per unit production tax ______ supply.
A) increases
B) decreases
C) does not change
D) changes in an indeterminate direction
A) increases
B) decreases
C) does not change
D) changes in an indeterminate direction
فتح الحزمة
افتح القفل للوصول البطاقات البالغ عددها 135 في هذه المجموعة.
فتح الحزمة
k this deck
62
Use the following to answer questions
Figure: Supply Shifts
(Figure: Supply Shifts)In the figure,the initial supply curve is S1.Producers engage in market speculation with the belief that the price of the good will increase in the near future.This would be represented in the figure by shifting the:
A) supply curve to S2,resulting in a lower quantity supplied at each price.
B) supply curve to S2,resulting in a higher quantity supplied at each price.
C) supply curve to S3,resulting in a lower quantity supplied at each price.
D) supply curve to S3,resulting in a higher quantity supplied at each price.
فتح الحزمة
افتح القفل للوصول البطاقات البالغ عددها 135 في هذه المجموعة.
فتح الحزمة
k this deck
63
If producers form expectations that copper prices will be higher in the future,then this will shift the:
A) demand curve for copper to the left.
B) supply curve of copper to the right.
C) demand curve for copper to the right.
D) supply curve of copper to the left.
A) demand curve for copper to the left.
B) supply curve of copper to the right.
C) demand curve for copper to the right.
D) supply curve of copper to the left.
فتح الحزمة
افتح القفل للوصول البطاقات البالغ عددها 135 في هذه المجموعة.
فتح الحزمة
k this deck
64
Suppose a new study predicts that the price of hybrid cars is expected to decrease in the near future.As a result,we would expect:
A) consumers to increase demand for hybrid cars today.
B) producers to increase supply of hybrid cars today.
C) no change in either demand or supply of hybrid cars today.
D) producers to decrease supply of hybrid cars today.
A) consumers to increase demand for hybrid cars today.
B) producers to increase supply of hybrid cars today.
C) no change in either demand or supply of hybrid cars today.
D) producers to decrease supply of hybrid cars today.
فتح الحزمة
افتح القفل للوصول البطاقات البالغ عددها 135 في هذه المجموعة.
فتح الحزمة
k this deck
65
In 2011,revolutions and uprisings spread across North Africa and the Middle East,where a lot of oil is pumped.How did this affect the oil market?
A) the supply curve for oil shifted to the left
B) the minimum price producers were willing to sell oil for decreased
C) the quantity of oil firms were willing and able to produce increased
D) the supply curve for oil shifted to the right
A) the supply curve for oil shifted to the left
B) the minimum price producers were willing to sell oil for decreased
C) the quantity of oil firms were willing and able to produce increased
D) the supply curve for oil shifted to the right
فتح الحزمة
افتح القفل للوصول البطاقات البالغ عددها 135 في هذه المجموعة.
فتح الحزمة
k this deck
66
In the early 1980s,movie rentals averaged $5 a night;by the early 1990s that average was $1 per night.This is an example of a supply curve shifter based on:
A) a change in tastes and preferences.
B) a decrease in the wages of workers in the video rental stores.
C) an increase in the number of VCRs owned by consumers.
D) the entry of new suppliers into the market.
A) a change in tastes and preferences.
B) a decrease in the wages of workers in the video rental stores.
C) an increase in the number of VCRs owned by consumers.
D) the entry of new suppliers into the market.
فتح الحزمة
افتح القفل للوصول البطاقات البالغ عددها 135 في هذه المجموعة.
فتح الحزمة
k this deck
67
If the government decided to heavily regulate small farmers who grow organic and free-range food,the supply of that food:
A) would increase because the regulations would improve the quality of that food.
B) would decrease because the regulations are like a tax on the food;they make it more expensive to produce.
C) would have no effect,because none of the shifters of supply are affected.
D) would increase because of changing expectations.
فتح الحزمة
افتح القفل للوصول البطاقات البالغ عددها 135 في هذه المجموعة.
فتح الحزمة
k this deck
68
An increase in a per unit production subsidy ______ supply.
A) increases
B) decreases
C) does not change
D) changes in an indeterminate direction
A) increases
B) decreases
C) does not change
D) changes in an indeterminate direction
فتح الحزمة
افتح القفل للوصول البطاقات البالغ عددها 135 في هذه المجموعة.
فتح الحزمة
k this deck
69
Figure: Lobster Market In the figure,a $10 tax is imposed on the market for lobsters.What is the market price that lobster producers would need to receive to induce them to produce 5,000 bushels of lobster per day?
A) $10
B) $40
C) $50
D) $60
In the figure,a $10 tax is imposed on the market for lobsters.What is the market price that lobster producers would need to receive to induce them to produce 5,000 bushels of lobster per day?A) $10
B) $40
C) $50
D) $60
فتح الحزمة
افتح القفل للوصول البطاقات البالغ عددها 135 في هذه المجموعة.
فتح الحزمة
k this deck
70
NAFTA made it ______ for Canadian lumber producers to sell lumber in the United States,shifting the supply curve of lumber to the ______.
A) easier;right
B) difficult;left
C) difficult;right
D) easier;left
A) easier;right
B) difficult;left
C) difficult;right
D) easier;left
فتح الحزمة
افتح القفل للوصول البطاقات البالغ عددها 135 في هذه المجموعة.
فتح الحزمة
k this deck
71
In 2011,the United States Senate voted to end ethanol subsidies.What will be the effect of this bill in the market for ethanol?
A) Demand will increase
B) Demand will decrease
C) Supply will decrease
D) Supply will increase
A) Demand will increase
B) Demand will decrease
C) Supply will decrease
D) Supply will increase
فتح الحزمة
افتح القفل للوصول البطاقات البالغ عددها 135 في هذه المجموعة.
فتح الحزمة
k this deck
72
Figure A: Supply Right Shift Figure B: Supply Left Shift Refer to the two figures.Which statement is TRUE?
A) Figure A depicts the expectation that the future price will decrease.
B) Figure A depicts an increase in taxes.
C) Figure B depicts falling input prices.
D) Figure B depicts technological innovations.
Refer to the two figures.Which statement is TRUE?A) Figure A depicts the expectation that the future price will decrease.
B) Figure A depicts an increase in taxes.
C) Figure B depicts falling input prices.
D) Figure B depicts technological innovations.
فتح الحزمة
افتح القفل للوصول البطاقات البالغ عددها 135 في هذه المجموعة.
فتح الحزمة
k this deck
73
What will happen to the supply of workers 18 to 21 years after a baby boom?
A) It will decrease,since workers will cost more to hire.
B) It will increase because of the influx of new adults into the labor market.
C) It will increase because workers will be needed to care for retirees.
D) It will decrease because producer surplus will be lower.
A) It will decrease,since workers will cost more to hire.
B) It will increase because of the influx of new adults into the labor market.
C) It will increase because workers will be needed to care for retirees.
D) It will decrease because producer surplus will be lower.
فتح الحزمة
افتح القفل للوصول البطاقات البالغ عددها 135 في هذه المجموعة.
فتح الحزمة
k this deck
74
If producers expect the price of a good to fall in the future,they might:
A) raise the price of the good today.
B) hoard goods to save them for when the price is lower.
C) increase their supply of goods out of storage today.
D) increase the demand for their goods today.
A) raise the price of the good today.
B) hoard goods to save them for when the price is lower.
C) increase their supply of goods out of storage today.
D) increase the demand for their goods today.
فتح الحزمة
افتح القفل للوصول البطاقات البالغ عددها 135 في هذه المجموعة.
فتح الحزمة
k this deck
75
Recall your reading about NAFTA in the textbook.Why did the NAFTA agreement result in an increase in lumber supply in the United States?
A) NAFTA decreed that the United States should produce more lumber.
B) NAFTA stands for North American Furniture Trade Agreement.
C) NAFTA reduced barriers to trade,allowing Canadian lumber to enter the United States.
D) The United States sold more lumber to Canada.
A) NAFTA decreed that the United States should produce more lumber.
B) NAFTA stands for North American Furniture Trade Agreement.
C) NAFTA reduced barriers to trade,allowing Canadian lumber to enter the United States.
D) The United States sold more lumber to Canada.
فتح الحزمة
افتح القفل للوصول البطاقات البالغ عددها 135 في هذه المجموعة.
فتح الحزمة
k this deck
76
An increase in the future expected price of a storable good ________ supply.
A) increases
B) decreases
C) does not change
D) changes in an indeterminate direction
A) increases
B) decreases
C) does not change
D) changes in an indeterminate direction
فتح الحزمة
افتح القفل للوصول البطاقات البالغ عددها 135 في هذه المجموعة.
فتح الحزمة
k this deck
77
Use the following to answer questions
Figure: Supply Shift 2
(Figure: Supply Shift 2)Refer to the figure.What would cause the supply curve to shift from S1 to S2?
A) a $20 tax on each unit of output
B) a $40 tax on each unit of output
C) a $40 subsidy on each unit of output
D) a $20 subsidy on each unit of output
Figure: Supply Shift 2
(Figure: Supply Shift 2)Refer to the figure.What would cause the supply curve to shift from S1 to S2?
A) a $20 tax on each unit of output
B) a $40 tax on each unit of output
C) a $40 subsidy on each unit of output
D) a $20 subsidy on each unit of output
فتح الحزمة
افتح القفل للوصول البطاقات البالغ عددها 135 في هذه المجموعة.
فتح الحزمة
k this deck
78
Use the following to answer questions
Figure: Supply Shift 2
(Figure: Supply Shift 2)Refer to the figure.What would cause the supply curve to shift from S1 to S2?
A) a $20 tax reduction on each unit of output
B) a $40 tax reduction on each unit of output
C) a $40 subsidy reduction on each unit of output
D) a $20 subsidy reduction on each unit of output
فتح الحزمة
افتح القفل للوصول البطاقات البالغ عددها 135 في هذه المجموعة.
فتح الحزمة
k this deck
79
Use the following to answer questions
Figure: Supply Shifts
(Figure: Supply Shifts)In the figure,the initial supply curve is S1.If producers form expectations that the price will be lower in the near future,S1 will:
A) shift to S2 now.
B) shift to S3 now.
C) not shift now.
D) only shift to S3 in the future.
Figure: Supply Shifts
(Figure: Supply Shifts)In the figure,the initial supply curve is S1.If producers form expectations that the price will be lower in the near future,S1 will:
A) shift to S2 now.
B) shift to S3 now.
C) not shift now.
D) only shift to S3 in the future.
فتح الحزمة
افتح القفل للوصول البطاقات البالغ عددها 135 في هذه المجموعة.
فتح الحزمة
k this deck
80
One result of the North American Free Trade Agreement was that the number of Canadian lumber companies selling in United States markets _____,causing a(n)_____ in the total market supply of lumber in the United States.
A) increased;decrease
B) increased;increase
C) decreased;decrease
D) decreased;increase
A) increased;decrease
B) increased;increase
C) decreased;decrease
D) decreased;increase
فتح الحزمة
افتح القفل للوصول البطاقات البالغ عددها 135 في هذه المجموعة.
فتح الحزمة
k this deck
فتح الحزمة
افتح القفل للوصول البطاقات البالغ عددها 135 في هذه المجموعة.


