Deck 2: The Production Possibility Model, trade, and Globalization
ملء الشاشة (f)
سؤال
سؤال
سؤال
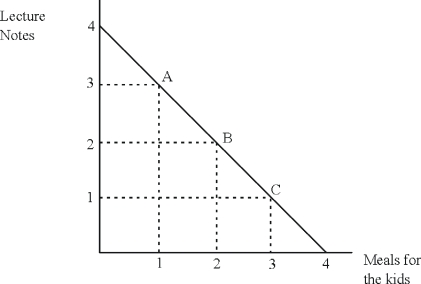
Below is a picture of a production possibilities curve that shows two products Professor Colander (your textbook author)might produce during any given day.
 Does this PPC illustrate the principle of increasing marginal opportunity cost? Explain.
Does this PPC illustrate the principle of increasing marginal opportunity cost? Explain. سؤال
سؤال
سؤال
سؤال
سؤال
سؤال
سؤال
سؤال
The table below is a production possibility table for the fictional country of Myopia.Use it to construct the corresponding production possibility curve in the quadrant below.(Label the axes.)
 (a)Explain the meaning of a production possibilities curve.
(b)What is assumed to be constant when we draw that curve?
(c)How is a point on the curve different from (1)a point below the curve or (2)a point above the curve?
(d)How does this curve illustrate the concept of opportunity cost?
(e)How does it illustrate the principle of increasing marginal opportunity cost?
(a)Explain the meaning of a production possibilities curve.(b)What is assumed to be constant when we draw that curve?
(c)How is a point on the curve different from (1)a point below the curve or (2)a point above the curve?
(d)How does this curve illustrate the concept of opportunity cost?
(e)How does it illustrate the principle of increasing marginal opportunity cost?
سؤال
سؤال
سؤال
سؤال
سؤال
سؤال
سؤال
سؤال
سؤال
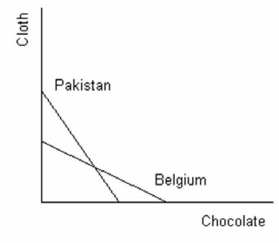
Assume that Belgium and Pakistan have linear production possibilities curves as shown in the graph below.Explain how they can both consume a combination of textiles and chocolate that lies outside their individual production possibility curves.Illustrate your answer graphically.
سؤال
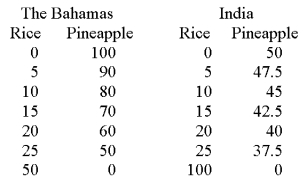
The Bahamas and India produce both pineapple and rice (both measured in tons).The table below illustrates their production possibilities.
 (a)In the Bahamas,what is the opportunity cost of a ton of pineapples,and of a ton of rice?
(b)In India,what is the opportunity cost of a ton of pineapple,and of a ton of rice?
(c)Which country has a comparative advantage in the production of pineapple?
(d)Construct a table showing both countries' combined effort with specialization.
(e)Draw two production possibilities curves; one showing the combined effort without specialization,and the other showing the combined effort with specialization.
(a)In the Bahamas,what is the opportunity cost of a ton of pineapples,and of a ton of rice?(b)In India,what is the opportunity cost of a ton of pineapple,and of a ton of rice?
(c)Which country has a comparative advantage in the production of pineapple?
(d)Construct a table showing both countries' combined effort with specialization.
(e)Draw two production possibilities curves; one showing the combined effort without specialization,and the other showing the combined effort with specialization.
سؤال

فتح الحزمة
قم بالتسجيل لفتح البطاقات في هذه المجموعة!
Unlock Deck
Unlock Deck
1/22
العب
ملء الشاشة (f)
Deck 2: The Production Possibility Model, trade, and Globalization
1
What is the argument for laissez faire policy in the context of benefits from trade?
When the market coordinates the actions of individuals,all parties benefit from trade.Individuals use their comparative advantage and produce the goods that they bring to the market for trading.Market competition ensures that individuals get the best bargain available in the market and,thus,everybody benefits.
2
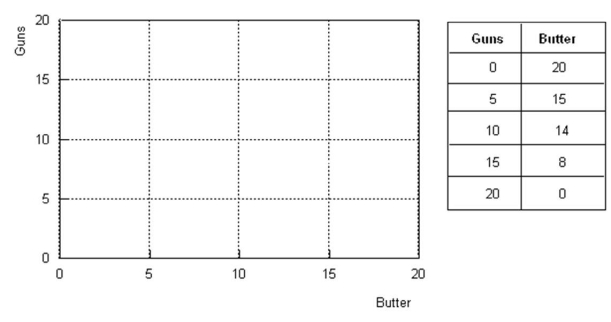
What is productive efficiency? Illustrate it with a production possibilities curve.
Productive efficiency means achieving as much output as possible from a given amount of inputs or resources.This can be illustrated using a production possibilities curve by comparing points under the curve with points on the curve.Consider the diagram below that shows the PPC trade-off between guns and butter. 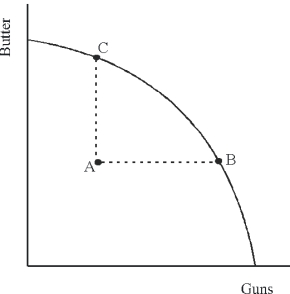 Compare points B and C with point A.Point A is an inefficient combination since the same resources can be used to get more guns without giving up any butter (point B)or more butter without giving up any guns (point C).Points B and C represent efficient production points.
Compare points B and C with point A.Point A is an inefficient combination since the same resources can be used to get more guns without giving up any butter (point B)or more butter without giving up any guns (point C).Points B and C represent efficient production points. 3
Below is a picture of a production possibilities curve that shows two products Professor Colander (your textbook author)might produce during any given day.
Does this PPC illustrate the principle of increasing marginal opportunity cost? Explain.
Does this PPC illustrate the principle of increasing marginal opportunity cost? Explain.This PPC does not illustrate the principle of increasing marginal opportunity cost.To see why not,think about moving along the PPC from points A to B and then from points B to C.For a movement from A to B,the opportunity cost of notes is 1 lecture.For a movement from B to C,the opportunity cost of notes is also 1 lecture.Thus this PPC illustrates a constant opportunity cost.This example demonstrates that the nature (or type)of opportunity cost is directly related to the shape of the PPC.
4
Under what assumption(s)is the production possibilities curve a representation of efficiency points?
فتح الحزمة
افتح القفل للوصول البطاقات البالغ عددها 22 في هذه المجموعة.
فتح الحزمة
k this deck
5
What does "outsourcing" mean,as the term is commonly used today? What is the "law of one price"? Explain how outsourcing is part of a global process guided by the law of one price.
فتح الحزمة
افتح القفل للوصول البطاقات البالغ عددها 22 في هذه المجموعة.
فتح الحزمة
k this deck
6
Most advanced nations have both agricultural sectors and armaments industries.They do not completely specialize in one industry or the other; but generally produce some of both commodities.(a)State the principle of increasing marginal opportunity cost (b)Is this incomplete specialization consistent with the principle of increasing opportunity costs? Explain your answer in the context of the tradeoff between guns and butter.
فتح الحزمة
افتح القفل للوصول البطاقات البالغ عددها 22 في هذه المجموعة.
فتح الحزمة
k this deck
7
Can a country gain comparative advantage in some product? Can a country lose that advantage?
فتح الحزمة
افتح القفل للوصول البطاقات البالغ عددها 22 في هذه المجموعة.
فتح الحزمة
k this deck
8
Does the production possibilities curve tell us if goods are distributed efficiently in a society? Explain.
فتح الحزمة
افتح القفل للوصول البطاقات البالغ عددها 22 في هذه المجموعة.
فتح الحزمة
k this deck
9
Below is the production possibilities table for the country of Lavaland.
(a)Use the information in the table to draw the production possibilities curve (PPC)for Lavaland.Put tanks on the horizontal axis.
(b)What is the cost to Lavaland of moving from point A to point B on its PPC? and of moving from point E to point F?
(c)What general economic principle is being illustrated by your answers to part (b)above? Explain.
فتح الحزمة
افتح القفل للوصول البطاقات البالغ عددها 22 في هذه المجموعة.
فتح الحزمة
k this deck
10
What is the principle of increasing marginal opportunity cost?
فتح الحزمة
افتح القفل للوصول البطاقات البالغ عددها 22 في هذه المجموعة.
فتح الحزمة
k this deck
11
The table below is a production possibility table for the fictional country of Myopia.Use it to construct the corresponding production possibility curve in the quadrant below.(Label the axes.)
(a)Explain the meaning of a production possibilities curve.
(b)What is assumed to be constant when we draw that curve?
(c)How is a point on the curve different from (1)a point below the curve or (2)a point above the curve?
(d)How does this curve illustrate the concept of opportunity cost?
(e)How does it illustrate the principle of increasing marginal opportunity cost?
(a)Explain the meaning of a production possibilities curve.(b)What is assumed to be constant when we draw that curve?
(c)How is a point on the curve different from (1)a point below the curve or (2)a point above the curve?
(d)How does this curve illustrate the concept of opportunity cost?
(e)How does it illustrate the principle of increasing marginal opportunity cost?
فتح الحزمة
افتح القفل للوصول البطاقات البالغ عددها 22 في هذه المجموعة.
فتح الحزمة
k this deck
12
What is a production possibilities curve?
فتح الحزمة
افتح القفل للوصول البطاقات البالغ عددها 22 في هذه المجموعة.
فتح الحزمة
k this deck
13
In what way does the notion of comparative advantage help to explain that production possibility curves are bowed outward (the principle of increasing opportunity cost)? Explain your answer in the context of the tradeoff between guns and butter.
فتح الحزمة
افتح القفل للوصول البطاقات البالغ عددها 22 في هذه المجموعة.
فتح الحزمة
k this deck
14
Draw a production possibilities curve that indicates how you might divide up 10 hours of study time between your economics and accounting midterm exams.Put expected grade in economics on the horizontal axis and expected grade in accounting on the vertical axis.If you don't study at all,you expect to make a 70 on both exams.For every one additional hour of studying economics,your exam grade rises by 3 points.The same is true for accounting.
a.What is the opportunity cost of studying one extra hour for your economics exam?
b.What is the opportunity cost of studying one extra hour for your accounting exam?
c.Can the production possibility curve shift? Explain.
a.What is the opportunity cost of studying one extra hour for your economics exam?
b.What is the opportunity cost of studying one extra hour for your accounting exam?
c.Can the production possibility curve shift? Explain.
فتح الحزمة
افتح القفل للوصول البطاقات البالغ عددها 22 في هذه المجموعة.
فتح الحزمة
k this deck
15
Consider a farmer's production possibilities curve,with corn measured on the vertical axis,and soybeans on the horizontal axis.Describe the impact of each of the following on the curve:
(a)The farmer buys or rents more land.
(b)A higher yielding variety of corn seed is developed.
(c)A hailstorm wipes out half of whatever crops the farmer has planted
(d)The government raises price supports for soybeans.
(a)The farmer buys or rents more land.
(b)A higher yielding variety of corn seed is developed.
(c)A hailstorm wipes out half of whatever crops the farmer has planted
(d)The government raises price supports for soybeans.
فتح الحزمة
افتح القفل للوصول البطاقات البالغ عددها 22 في هذه المجموعة.
فتح الحزمة
k this deck
16
What does it mean when we say that a country has comparative advantage in a specific good?
فتح الحزمة
افتح القفل للوصول البطاقات البالغ عددها 22 في هذه المجموعة.
فتح الحزمة
k this deck
17
Why do marginal opportunity costs increase as you produce more of a specific good?
فتح الحزمة
افتح القفل للوصول البطاقات البالغ عددها 22 في هذه المجموعة.
فتح الحزمة
k this deck
18
What two lessons can you learn from a production possibilities curve?
فتح الحزمة
افتح القفل للوصول البطاقات البالغ عددها 22 في هذه المجموعة.
فتح الحزمة
k this deck
19
What does a production possibilities table demonstrate?
فتح الحزمة
افتح القفل للوصول البطاقات البالغ عددها 22 في هذه المجموعة.
فتح الحزمة
k this deck
20
Assume that Belgium and Pakistan have linear production possibilities curves as shown in the graph below.Explain how they can both consume a combination of textiles and chocolate that lies outside their individual production possibility curves.Illustrate your answer graphically.
فتح الحزمة
افتح القفل للوصول البطاقات البالغ عددها 22 في هذه المجموعة.
فتح الحزمة
k this deck
21
The Bahamas and India produce both pineapple and rice (both measured in tons).The table below illustrates their production possibilities.
(a)In the Bahamas,what is the opportunity cost of a ton of pineapples,and of a ton of rice?
(b)In India,what is the opportunity cost of a ton of pineapple,and of a ton of rice?
(c)Which country has a comparative advantage in the production of pineapple?
(d)Construct a table showing both countries' combined effort with specialization.
(e)Draw two production possibilities curves; one showing the combined effort without specialization,and the other showing the combined effort with specialization.
(a)In the Bahamas,what is the opportunity cost of a ton of pineapples,and of a ton of rice?(b)In India,what is the opportunity cost of a ton of pineapple,and of a ton of rice?
(c)Which country has a comparative advantage in the production of pineapple?
(d)Construct a table showing both countries' combined effort with specialization.
(e)Draw two production possibilities curves; one showing the combined effort without specialization,and the other showing the combined effort with specialization.
فتح الحزمة
افتح القفل للوصول البطاقات البالغ عددها 22 في هذه المجموعة.
فتح الحزمة
k this deck
22
Using production possibilities curves,demonstrate increasing marginal opportunity cost and constant marginal opportunity cost.
فتح الحزمة
افتح القفل للوصول البطاقات البالغ عددها 22 في هذه المجموعة.
فتح الحزمة
k this deck
فتح الحزمة
افتح القفل للوصول البطاقات البالغ عددها 22 في هذه المجموعة.


