Deck 18: Extending the Analysis of Aggregate Supply
ملء الشاشة (f)
سؤال
In the graphs below, QP refers to the economy's potential output level.  Refer to the graphs above. In Graph A, an increase in the price level from P1 to P2 will cause:
A) The nation's unemployment rate to be greater than the natural rate of unemployment
B) The nation's unemployment rate to be less than the natural rate of unemployment
C) Product prices to decrease
D) Profits to decrease
Refer to the graphs above. In Graph A, an increase in the price level from P1 to P2 will cause:A) The nation's unemployment rate to be greater than the natural rate of unemployment
B) The nation's unemployment rate to be less than the natural rate of unemployment
C) Product prices to decrease
D) Profits to decrease
سؤال
سؤال
سؤال
In the graphs below, QP refers to the economy's potential output level.  Refer to the graphs above. Graph A is constructed on the basic assumption that:
A) The price level is not flexible
B) Nominal wages are unresponsive to price-level changes
C) Real output is unresponsive to price-level changes
D) Unemployment is unresponsive to price-level changes
Refer to the graphs above. Graph A is constructed on the basic assumption that:A) The price level is not flexible
B) Nominal wages are unresponsive to price-level changes
C) Real output is unresponsive to price-level changes
D) Unemployment is unresponsive to price-level changes
سؤال
In the graphs below, QP refers to the economy's potential output level.  Refer to the graphs above. In Graph A, a decrease in the price level from P1 to P3 will lead to:
A) A decrease in profits, an increase in real output, and a decrease in the unemployment rate
B) A decrease in profits, a decrease in real output, and a decrease in the unemployment rate
C) A decrease in profits, a decrease in real output, and an increase in the unemployment rate
D) An increase in profits, an increase in real output, and a decrease in the unemployment rate
Refer to the graphs above. In Graph A, a decrease in the price level from P1 to P3 will lead to:A) A decrease in profits, an increase in real output, and a decrease in the unemployment rate
B) A decrease in profits, a decrease in real output, and a decrease in the unemployment rate
C) A decrease in profits, a decrease in real output, and an increase in the unemployment rate
D) An increase in profits, an increase in real output, and a decrease in the unemployment rate
سؤال
سؤال
سؤال
سؤال
In the graphs below, QP refers to the economy's potential output level. 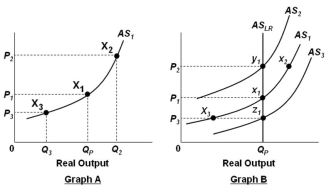 Refer to the graphs above. In Graph B, assume that the economy is initially in equilibrium at point x1 but then there is an increase in the price level from P1 to P2. In the long run, this change will lead to:
A) Lower nominal wages and a shift in the short-run aggregate supply curve from AS1 to AS2
B) Higher nominal wages and a shift in the short-run aggregate supply curve from AS1 to AS2
C) Lower nominal wages and a movement from equilibrium point x1 to equilibrium point x2
D) Higher nominal wages and a movement from equilibrium point x1 to equilibrium point x2
Refer to the graphs above. In Graph B, assume that the economy is initially in equilibrium at point x1 but then there is an increase in the price level from P1 to P2. In the long run, this change will lead to:A) Lower nominal wages and a shift in the short-run aggregate supply curve from AS1 to AS2
B) Higher nominal wages and a shift in the short-run aggregate supply curve from AS1 to AS2
C) Lower nominal wages and a movement from equilibrium point x1 to equilibrium point x2
D) Higher nominal wages and a movement from equilibrium point x1 to equilibrium point x2
سؤال
In the graphs below, QP refers to the economy's potential output level.  Refer to the graphs above. In Graph B, assume that the economy is initially in equilibrium at point x1 but then there is an increase in the price level from P1 to P2. This change will lead to:
A) A movement from x1 to x2 in the short run, and the unemployment rate decreases, followed by a shift from x2 to y1 as nominal wages rise in the long run
B) A movement from x1 to x3 in the short run, and the unemployment rate decreases, followed by a shift from x3 to x1 as output rises in the long run
C) A movement from x1 to y1 in the short run, and back to x1 in the long run
D) No change in the short run, but a shift from x1 to y1 in the long run
Refer to the graphs above. In Graph B, assume that the economy is initially in equilibrium at point x1 but then there is an increase in the price level from P1 to P2. This change will lead to:A) A movement from x1 to x2 in the short run, and the unemployment rate decreases, followed by a shift from x2 to y1 as nominal wages rise in the long run
B) A movement from x1 to x3 in the short run, and the unemployment rate decreases, followed by a shift from x3 to x1 as output rises in the long run
C) A movement from x1 to y1 in the short run, and back to x1 in the long run
D) No change in the short run, but a shift from x1 to y1 in the long run
سؤال
سؤال
سؤال
سؤال
سؤال
سؤال
سؤال
سؤال
سؤال
سؤال
سؤال
 Refer to the graph above. Ongoing inflation would occur if the Fed:
A) Increases the money supply causing AD to shift faster than technological progress shifts AS
B) Increases the money supply causing AD to shift slower than technological progress shifts AS
C) Increases the money supply causing AD to shift as fast as technological progress shifts AS
D) Does not increase the money supply while technological progress is shifting AS
سؤال
سؤال
سؤال
سؤال
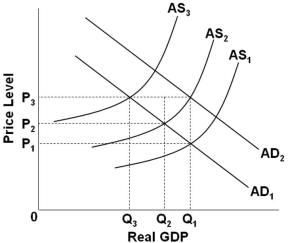 Refer to the graph above. Suppose that the economy is at an initial equilibrium where the AD1 and AS1 curves intersect. Demand-pull inflation in the long run can best be illustrated as a shift of:
A) AS1 to AS2, and back again to AS1
B) AD1 to AD2, and back again to AD1
C) AS1 to AS2, consequently making AD1 shift to AD2
D) AD1 to AD2, consequently making AS1 shift to AS2
سؤال
سؤال
سؤال
سؤال
 Refer to the graph above. Suppose that the economy is at an initial equilibrium where the AD1 and AS1 curves intersect. If cost-push inflation occurs and the government subsequently implements expansionary policy, then the effect of such policy is to shift:
A) AD1 to AD2, which increases the price level from P1 to P2, and increases real domestic output from Q3 to Q2
B) AS1 to AS2, which increases the price level from P1 to P2, and decreases real output from Q1 to Q2
C) AD1 to AD2, which increases the price level from P2 to P3, and increases real output from Q2 to Q1
D) AS2 to AS3 which increases the price level from P2 to P3, and decreases real output from Q2 to Q3
سؤال
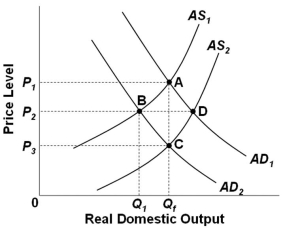 Refer to the graph above. Assume that the economy is initially at equilibrium at point C, and that the government has adopted a "hands-off" policy approach. If demand-pull inflation occurs, then the final long-run equilibrium point will be point __; while if cost-push inflation occurs (starting at point C), then the final long-run equilibrium point will be point __.
A) A; C
B) D; B
C) A; A
D) D; A
سؤال
 Refer to the graph above. Economic growth driven by productivity and technology would be illustrated as a shift of:
A) AD1 to AD2
B) P1 to P2
C) AS2 to AS1
D) ASLR1 to ASLR2
سؤال
 Refer to the graph above. Suppose that the economy is at an initial equilibrium where the AD1 and AS1 curves intersect. Demand-pull inflation in the short run can best be represented as a shift of:
A) AS1 to the right
B) AD1 to the right
C) AS1 to the left
D) AD1 to the left
سؤال
سؤال
 Refer to the graph above. Stagflation in the short run is best represented as resulting from a shift of:
A) AD1 to AD2 given a stable AS1 curve
B) AD2 to AD1 given a stable AS1 curve
C) AS1 to AS2 given a stable AD1 curve
D) AS2 to AS1 given a stable AD1 curve
سؤال
سؤال
 Refer to the graph above. Suppose that the economy is at an initial equilibrium where the AD1 and AS1 curves intersect. If cost-push inflation occurs and the government adopts a "hands-off" policy approach, then in the long run the price level will be at:
A) P1, and output will be at Q1
B) P3, and output will be at Q1
C) P2, and output will be at Q2
D) P3, and output will be at Q3
سؤال
سؤال
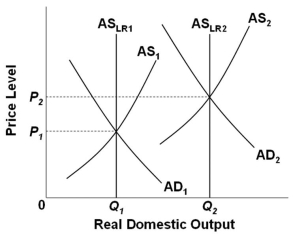
 Refer to the graph above. If Qf is potential GDP, wages and prices are flexible, then the long-run aggregate supply curve will be:
A) AS2
B) AS1
C) A vertical line at Qf
D) A vertical line at Q1
سؤال
 Refer to the graph above. An expansion of the economy's production possibilities can, by itself:
A) Never cause inflation
B) Never cause price level to fall
C) Cause a decrease in real output
D) Cause a decrease in employment level
سؤال
سؤال
 Refer to the graph above. Assume the economy is at the initial position of B2. It is possible for the government to reduce the unemployment rate and move the economy to C2 if:
A) Expected inflation remains at 4%
B) Expected inflation becomes 8%
C) Actual inflation remains at 4%
D) Actual inflation is at 12%
سؤال
سؤال
سؤال
سؤال
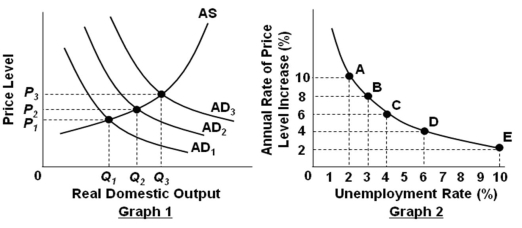 Refer to the graphs above. Assume that the economy is initially at equilibrium where AD2 and AS intersect in Graph 1, and also assume that the economy is initially at point C in Graph 2. A movement from point C to point B in graph 2 would most likely be associated, in graph 1, with a shift of:
A) AD to the right
B) AD to the left
C) AS to the right
D) AS to the left
سؤال
سؤال
سؤال
سؤال
 Refer to the graphs above. Assume that the economy is initially at equilibrium where AD2 and AS intersect in Graph 1, and also assume that the economy is initially at point C in Graph 2. If the government implements contractionary or restrictive policy, it would make the economy in graph 2 to:
A) Move from point C to point B
B) Move from point C to point A
C) Move from point C to point D
D) Remain at point C
سؤال
سؤال
 Refer to the graph above. The economy is at point B2, and then aggregate demand increases. In the short run, the economy will:
A) Stay at point B2 and remain there in the long run
B) Move to point C2 and in the long run move on to B3.
C) Move to point B3 and in the long run move on to C2.
D) Move to point B1 and in the long run move back to B2.
سؤال
 Refer to the graph above. Assume the economy is at the initial position of B2. An increase in aggregate demand with no corresponding change in inflation expectations and wage rates will tend to:
A) Temporarily move the economy to point B3
B) Temporarily move the economy to point C2
C) Temporarily move the economy to point C1
D) Have no effect in shifting the economy from point B2
سؤال
سؤال
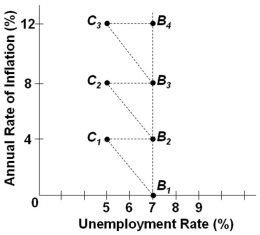 Refer to the graph above. Assume the economy is at the initial position of B2. An increase in aggregate demand with a corresponding adjustment in inflation expectations and wages will tend to:
A) Move the economy to point B3
B) Move the economy to point C2
C) Move the economy to point C1
D) Have no effect in shifting the economy from point B2
سؤال
 Refer to the graph above. What events would tend to temporarily move the economy from point B2 to C2?
A) A tight monetary policy
B) A contractionary fiscal policy
C) An easy money policy
D) An increase in aggregate supply
سؤال
سؤال
سؤال
سؤال
سؤال
سؤال
سؤال
سؤال
سؤال
سؤال
سؤال
سؤال
سؤال
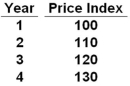 Refer to the table above. Calculating the annual inflation rates would indicate that this economy is experiencing:
A) Stagflation
B) Deflation
C) Disinflation
D) Constant inflation
سؤال
سؤال
 Refer to the table above. What would be the annual inflation rates in Years 2, 3, and 4, respectively?
A) 10, 9.1, and 8.3 percent
B) 10, 8.3, and 7.7 percent
C) 10, 10, and 10 percent
سؤال
سؤال
سؤال
سؤال
سؤال
سؤال
سؤال
سؤال
سؤال
سؤال

فتح الحزمة
قم بالتسجيل لفتح البطاقات في هذه المجموعة!
Unlock Deck
Unlock Deck
1/135
العب
ملء الشاشة (f)
Deck 18: Extending the Analysis of Aggregate Supply
1
In the graphs below, QP refers to the economy's potential output level. Refer to the graphs above. In Graph A, an increase in the price level from P1 to P2 will cause:
A) The nation's unemployment rate to be greater than the natural rate of unemployment
B) The nation's unemployment rate to be less than the natural rate of unemployment
C) Product prices to decrease
D) Profits to decrease
Refer to the graphs above. In Graph A, an increase in the price level from P1 to P2 will cause:A) The nation's unemployment rate to be greater than the natural rate of unemployment
B) The nation's unemployment rate to be less than the natural rate of unemployment
C) Product prices to decrease
D) Profits to decrease
The nation's unemployment rate to be less than the natural rate of unemployment
2
In the short run, if the price level increases, then nominal wages:
A) Stay fixed, therefore firms' revenues and profits will increase
B) Stay fixed, and the firms' revenues and profits also stay the same
C) Increase, causing firms' revenues and profits to fall
D) Decrease, causing firms' revenues and profits to rise
A) Stay fixed, therefore firms' revenues and profits will increase
B) Stay fixed, and the firms' revenues and profits also stay the same
C) Increase, causing firms' revenues and profits to fall
D) Decrease, causing firms' revenues and profits to rise
Stay fixed, therefore firms' revenues and profits will increase
3
In the short run, the price level is assumed to be:
A) Fixed, along with input prices
B) Flexible, but input prices are not
C) Flexible, along with input prices
D) Fixed, but input prices are flexible
A) Fixed, along with input prices
B) Flexible, but input prices are not
C) Flexible, along with input prices
D) Fixed, but input prices are flexible
Flexible, but input prices are not
4
In the graphs below, QP refers to the economy's potential output level. Refer to the graphs above. Graph A is constructed on the basic assumption that:
A) The price level is not flexible
B) Nominal wages are unresponsive to price-level changes
C) Real output is unresponsive to price-level changes
D) Unemployment is unresponsive to price-level changes
Refer to the graphs above. Graph A is constructed on the basic assumption that:A) The price level is not flexible
B) Nominal wages are unresponsive to price-level changes
C) Real output is unresponsive to price-level changes
D) Unemployment is unresponsive to price-level changes
فتح الحزمة
افتح القفل للوصول البطاقات البالغ عددها 135 في هذه المجموعة.
فتح الحزمة
k this deck
5
In the graphs below, QP refers to the economy's potential output level. Refer to the graphs above. In Graph A, a decrease in the price level from P1 to P3 will lead to:
A) A decrease in profits, an increase in real output, and a decrease in the unemployment rate
B) A decrease in profits, a decrease in real output, and a decrease in the unemployment rate
C) A decrease in profits, a decrease in real output, and an increase in the unemployment rate
D) An increase in profits, an increase in real output, and a decrease in the unemployment rate
Refer to the graphs above. In Graph A, a decrease in the price level from P1 to P3 will lead to:A) A decrease in profits, an increase in real output, and a decrease in the unemployment rate
B) A decrease in profits, a decrease in real output, and a decrease in the unemployment rate
C) A decrease in profits, a decrease in real output, and an increase in the unemployment rate
D) An increase in profits, an increase in real output, and a decrease in the unemployment rate
فتح الحزمة
افتح القفل للوصول البطاقات البالغ عددها 135 في هذه المجموعة.
فتح الحزمة
k this deck
6
In the short run, nominal wages and other input prices are assumed to be:
A) Unresponsive to product price-level changes, but in the long run they are assumed to be responsive
B) Unresponsive to product price-level changes, and in the long run they are assumed to be unresponsive also
C) Responsive to product price-level changes, but in the long run they are assumed to be unresponsive
D) Responsive to product price-level changes, and in the long run they are assumed to be responsive also
فتح الحزمة
افتح القفل للوصول البطاقات البالغ عددها 135 في هذه المجموعة.
فتح الحزمة
k this deck
7
Assume that initially your nominal wage was $16 an hour and the price index was 100. If the price level increases to 105, then your:
A) Real wage has increased to $21
B) Real wage has decreased to $15.24
C) Nominal wage has increased to $21
D) Nominal wage has decreased to $15.24
A) Real wage has increased to $21
B) Real wage has decreased to $15.24
C) Nominal wage has increased to $21
D) Nominal wage has decreased to $15.24
فتح الحزمة
افتح القفل للوصول البطاقات البالغ عددها 135 في هذه المجموعة.
فتح الحزمة
k this deck
8
In the long run, if the price level decreases, then the economy's output level will:
A) Increase initially, but then fall back again
B) Increase
C) Decrease
D) Stay the same
A) Increase initially, but then fall back again
B) Increase
C) Decrease
D) Stay the same
فتح الحزمة
افتح القفل للوصول البطاقات البالغ عددها 135 في هذه المجموعة.
فتح الحزمة
k this deck
9
In the graphs below, QP refers to the economy's potential output level. Refer to the graphs above. In Graph B, assume that the economy is initially in equilibrium at point x1 but then there is an increase in the price level from P1 to P2. In the long run, this change will lead to:
A) Lower nominal wages and a shift in the short-run aggregate supply curve from AS1 to AS2
B) Higher nominal wages and a shift in the short-run aggregate supply curve from AS1 to AS2
C) Lower nominal wages and a movement from equilibrium point x1 to equilibrium point x2
D) Higher nominal wages and a movement from equilibrium point x1 to equilibrium point x2
Refer to the graphs above. In Graph B, assume that the economy is initially in equilibrium at point x1 but then there is an increase in the price level from P1 to P2. In the long run, this change will lead to:A) Lower nominal wages and a shift in the short-run aggregate supply curve from AS1 to AS2
B) Higher nominal wages and a shift in the short-run aggregate supply curve from AS1 to AS2
C) Lower nominal wages and a movement from equilibrium point x1 to equilibrium point x2
D) Higher nominal wages and a movement from equilibrium point x1 to equilibrium point x2
فتح الحزمة
افتح القفل للوصول البطاقات البالغ عددها 135 في هذه المجموعة.
فتح الحزمة
k this deck
10
In the graphs below, QP refers to the economy's potential output level. Refer to the graphs above. In Graph B, assume that the economy is initially in equilibrium at point x1 but then there is an increase in the price level from P1 to P2. This change will lead to:
A) A movement from x1 to x2 in the short run, and the unemployment rate decreases, followed by a shift from x2 to y1 as nominal wages rise in the long run
B) A movement from x1 to x3 in the short run, and the unemployment rate decreases, followed by a shift from x3 to x1 as output rises in the long run
C) A movement from x1 to y1 in the short run, and back to x1 in the long run
D) No change in the short run, but a shift from x1 to y1 in the long run
Refer to the graphs above. In Graph B, assume that the economy is initially in equilibrium at point x1 but then there is an increase in the price level from P1 to P2. This change will lead to:A) A movement from x1 to x2 in the short run, and the unemployment rate decreases, followed by a shift from x2 to y1 as nominal wages rise in the long run
B) A movement from x1 to x3 in the short run, and the unemployment rate decreases, followed by a shift from x3 to x1 as output rises in the long run
C) A movement from x1 to y1 in the short run, and back to x1 in the long run
D) No change in the short run, but a shift from x1 to y1 in the long run
فتح الحزمة
افتح القفل للوصول البطاقات البالغ عددها 135 في هذه المجموعة.
فتح الحزمة
k this deck
11
The short-run aggregate supply curve illustrates the idea that if the price level falls, firms will experience:
A) Falling input costs, so they will increase their output level
B) No change in input costs, so they will not change their output level
C) Falling inputs costs, so they will reduce their output level
D) No change in input costs, so they will reduce their output level
A) Falling input costs, so they will increase their output level
B) No change in input costs, so they will not change their output level
C) Falling inputs costs, so they will reduce their output level
D) No change in input costs, so they will reduce their output level
فتح الحزمة
افتح القفل للوصول البطاقات البالغ عددها 135 في هذه المجموعة.
فتح الحزمة
k this deck
12
In the long run, demand-pull inflation leads to:
A) Higher unemployment and higher price level
B) Lower real wages and higher unemployment
C) Lower real output and no change in unemployment
D) Higher price level and no change in real output
A) Higher unemployment and higher price level
B) Lower real wages and higher unemployment
C) Lower real output and no change in unemployment
D) Higher price level and no change in real output
فتح الحزمة
افتح القفل للوصول البطاقات البالغ عددها 135 في هذه المجموعة.
فتح الحزمة
k this deck
13
Demand-pull inflation in the short-run raises the price level and:
A) Real wages
B) Real output
C) The unemployment rate
D) Nominal wages
A) Real wages
B) Real output
C) The unemployment rate
D) Nominal wages
فتح الحزمة
افتح القفل للوصول البطاقات البالغ عددها 135 في هذه المجموعة.
فتح الحزمة
k this deck
14
The short-run aggregate supply curve:
A) Is vertical and the long-run aggregate supply curve is vertical
B) Slopes upward and the long-run aggregate supply curve also slopes upward
C) Slopes upward, but the long-run aggregate supply curve is horizontal
D) Slopes upward, but the long-run aggregate supply curve is vertical
A) Is vertical and the long-run aggregate supply curve is vertical
B) Slopes upward and the long-run aggregate supply curve also slopes upward
C) Slopes upward, but the long-run aggregate supply curve is horizontal
D) Slopes upward, but the long-run aggregate supply curve is vertical
فتح الحزمة
افتح القفل للوصول البطاقات البالغ عددها 135 في هذه المجموعة.
فتح الحزمة
k this deck
15
Inflation in the short run is most likely to result from a(n):
A) Increase in aggregate demand or aggregate supply
B) Decrease in aggregate demand or aggregate supply
C) Increase in aggregate demand or a decrease in aggregate supply
D) Decrease in aggregate demand or an increase in aggregate supply
A) Increase in aggregate demand or aggregate supply
B) Decrease in aggregate demand or aggregate supply
C) Increase in aggregate demand or a decrease in aggregate supply
D) Decrease in aggregate demand or an increase in aggregate supply
فتح الحزمة
افتح القفل للوصول البطاقات البالغ عددها 135 في هذه المجموعة.
فتح الحزمة
k this deck
16
The short-run aggregate supply curve intersects the long-run aggregate supply curve at:
A) A constant price level
B) The potential level of real output
C) The equilibrium level of aggregate demand
D) The point where real GDP equals nominal GDP
A) A constant price level
B) The potential level of real output
C) The equilibrium level of aggregate demand
D) The point where real GDP equals nominal GDP
فتح الحزمة
افتح القفل للوصول البطاقات البالغ عددها 135 في هذه المجموعة.
فتح الحزمة
k this deck
17
In the long run, demand-pull inflation:
A) Starts out with a shift in the AS curve, but no shift of the AD curve
B) Starts out with a rightward shift in the AD curve, followed by a resulting leftward shift of the short-run AS curve
C) Starts out with a leftward shift in the AD curve, followed by a resulting rightward shift of the short-run AS curve
D) Involves a shift of the AD curve only, with no shift of the AS curve
فتح الحزمة
افتح القفل للوصول البطاقات البالغ عددها 135 في هذه المجموعة.
فتح الحزمة
k this deck
18
The economy enters the long-run once:
A) Nominal wages become equal to real wages
B) Real wages become equal to nominal wages
C) Sufficient time has elapsed for wage contracts to expire and nominal wages to adjust to output-price changes
D) Sufficient time has elapsed for real GDP to increase and unemployment to decrease as a consequence
فتح الحزمة
افتح القفل للوصول البطاقات البالغ عددها 135 في هذه المجموعة.
فتح الحزمة
k this deck
19
In the long run, if the price level increases, then nominal wages and other input prices:
A) Also rise, so firms will reduce their output level
B) Also rise, so firms will not change their output level
C) Not change, so firms will not change their output level
D) Decrease, so firms will increase their output level
A) Also rise, so firms will reduce their output level
B) Also rise, so firms will not change their output level
C) Not change, so firms will not change their output level
D) Decrease, so firms will increase their output level
فتح الحزمة
افتح القفل للوصول البطاقات البالغ عددها 135 في هذه المجموعة.
فتح الحزمة
k this deck
20
Equilibrium in the long run occurs when:
A) AD intersects the short-run AS, regardless of output level
B) AD intersects the short-run AS, regardless of price level
C) AD intersects the short-run and the long-run AS curves at the same point
D) The short-run AS curve intersects the long-run AS curve
A) AD intersects the short-run AS, regardless of output level
B) AD intersects the short-run AS, regardless of price level
C) AD intersects the short-run and the long-run AS curves at the same point
D) The short-run AS curve intersects the long-run AS curve
فتح الحزمة
افتح القفل للوصول البطاقات البالغ عددها 135 في هذه المجموعة.
فتح الحزمة
k this deck
21
Refer to the graph above. Ongoing inflation would occur if the Fed:A) Increases the money supply causing AD to shift faster than technological progress shifts AS
B) Increases the money supply causing AD to shift slower than technological progress shifts AS
C) Increases the money supply causing AD to shift as fast as technological progress shifts AS
D) Does not increase the money supply while technological progress is shifting AS
فتح الحزمة
افتح القفل للوصول البطاقات البالغ عددها 135 في هذه المجموعة.
فتح الحزمة
k this deck
22
In the cost-push model of inflation, increases in nominal-wage rates that exceed increases in the productivity of labor:
A) Increase aggregate supply and the price level in the economy
B) Increase aggregate supply and decrease the price level in the economy
C) Decrease aggregate supply and the price level in the economy
D) Decrease aggregate supply and increase the price level in the economy
A) Increase aggregate supply and the price level in the economy
B) Increase aggregate supply and decrease the price level in the economy
C) Decrease aggregate supply and the price level in the economy
D) Decrease aggregate supply and increase the price level in the economy
فتح الحزمة
افتح القفل للوصول البطاقات البالغ عددها 135 في هذه المجموعة.
فتح الحزمة
k this deck
23
The traditional Phillips Curve showing a tradeoff between inflation and unemployment is based on having a stable:
A) Aggregate demand and a shifting short-run aggregate supply
B) Short-run aggregate supply and a shifting aggregate demand
C) Long-run aggregate supply and a shifting aggregate demand
D) Aggregate demand and a shifting long-run aggregate supply
A) Aggregate demand and a shifting short-run aggregate supply
B) Short-run aggregate supply and a shifting aggregate demand
C) Long-run aggregate supply and a shifting aggregate demand
D) Aggregate demand and a shifting long-run aggregate supply
فتح الحزمة
افتح القفل للوصول البطاقات البالغ عددها 135 في هذه المجموعة.
فتح الحزمة
k this deck
24
In the short-run, demand-pull inflation increases:
A) Real wages, but in the long run only nominal wages
B) Nominal wages, but in the long run only real wages
C) Real output and the price level, but in the long-run only real output
D) Real output and the price level, but in the long-run only the price level
A) Real wages, but in the long run only nominal wages
B) Nominal wages, but in the long run only real wages
C) Real output and the price level, but in the long-run only real output
D) Real output and the price level, but in the long-run only the price level
فتح الحزمة
افتح القفل للوصول البطاقات البالغ عددها 135 في هذه المجموعة.
فتح الحزمة
k this deck
25
Refer to the graph above. Suppose that the economy is at an initial equilibrium where the AD1 and AS1 curves intersect. Demand-pull inflation in the long run can best be illustrated as a shift of:A) AS1 to AS2, and back again to AS1
B) AD1 to AD2, and back again to AD1
C) AS1 to AS2, consequently making AD1 shift to AD2
D) AD1 to AD2, consequently making AS1 shift to AS2
فتح الحزمة
افتح القفل للوصول البطاقات البالغ عددها 135 في هذه المجموعة.
فتح الحزمة
k this deck
26
What will occur in the short run if there is cost-push inflation and the government adopts a hands-off approach to it?
A) An increase in real output
B) An inflationary spiral
C) Low unemployment and a loss of real output
D) High unemployment and a loss of real output
A) An increase in real output
B) An inflationary spiral
C) Low unemployment and a loss of real output
D) High unemployment and a loss of real output
فتح الحزمة
افتح القفل للوصول البطاقات البالغ عددها 135 في هذه المجموعة.
فتح الحزمة
k this deck
27
If cost-push inflation occurs and the government adopts a "hands-off" policy approach, then according to the simple extended AD-AS model, in the long run the economy will:
A) Get back to where it started from
B) Get stuck with high unemployment
C) Experience an inflationary spiral
D) Have a higher price level
A) Get back to where it started from
B) Get stuck with high unemployment
C) Experience an inflationary spiral
D) Have a higher price level
فتح الحزمة
افتح القفل للوصول البطاقات البالغ عددها 135 في هذه المجموعة.
فتح الحزمة
k this deck
28
If the government uses expansionary monetary or fiscal policies to counter the output-effects of cost-push inflation, then the economy is likely to experience:
A) A decline in nominal wages
B) An inflationary spiral
C) A recession
D) Disinflation
A) A decline in nominal wages
B) An inflationary spiral
C) A recession
D) Disinflation
فتح الحزمة
افتح القفل للوصول البطاقات البالغ عددها 135 في هذه المجموعة.
فتح الحزمة
k this deck
29
Refer to the graph above. Suppose that the economy is at an initial equilibrium where the AD1 and AS1 curves intersect. If cost-push inflation occurs and the government subsequently implements expansionary policy, then the effect of such policy is to shift:A) AD1 to AD2, which increases the price level from P1 to P2, and increases real domestic output from Q3 to Q2
B) AS1 to AS2, which increases the price level from P1 to P2, and decreases real output from Q1 to Q2
C) AD1 to AD2, which increases the price level from P2 to P3, and increases real output from Q2 to Q1
D) AS2 to AS3 which increases the price level from P2 to P3, and decreases real output from Q2 to Q3
فتح الحزمة
افتح القفل للوصول البطاقات البالغ عددها 135 في هذه المجموعة.
فتح الحزمة
k this deck
30
Refer to the graph above. Assume that the economy is initially at equilibrium at point C, and that the government has adopted a "hands-off" policy approach. If demand-pull inflation occurs, then the final long-run equilibrium point will be point __; while if cost-push inflation occurs (starting at point C), then the final long-run equilibrium point will be point __.A) A; C
B) D; B
C) A; A
D) D; A
فتح الحزمة
افتح القفل للوصول البطاقات البالغ عددها 135 في هذه المجموعة.
فتح الحزمة
k this deck
31
Refer to the graph above. Economic growth driven by productivity and technology would be illustrated as a shift of:A) AD1 to AD2
B) P1 to P2
C) AS2 to AS1
D) ASLR1 to ASLR2
فتح الحزمة
افتح القفل للوصول البطاقات البالغ عددها 135 في هذه المجموعة.
فتح الحزمة
k this deck
32
Refer to the graph above. Suppose that the economy is at an initial equilibrium where the AD1 and AS1 curves intersect. Demand-pull inflation in the short run can best be represented as a shift of:A) AS1 to the right
B) AD1 to the right
C) AS1 to the left
D) AD1 to the left
فتح الحزمة
افتح القفل للوصول البطاقات البالغ عددها 135 في هذه المجموعة.
فتح الحزمة
k this deck
33
The traditional Phillips Curve shows the:
A) Direct correlation between the rate of inflation and the unemployment rate
B) Inverse correlation between the rate of inflation and the rate of unemployment
C) Direct correlation between the short-run and long-run aggregate supply
D) Inverse correlation between the short-run and long-run aggregate supply
فتح الحزمة
افتح القفل للوصول البطاقات البالغ عددها 135 في هذه المجموعة.
فتح الحزمة
k this deck
34
Refer to the graph above. Stagflation in the short run is best represented as resulting from a shift of:A) AD1 to AD2 given a stable AS1 curve
B) AD2 to AD1 given a stable AS1 curve
C) AS1 to AS2 given a stable AD1 curve
D) AS2 to AS1 given a stable AD1 curve
فتح الحزمة
افتح القفل للوصول البطاقات البالغ عددها 135 في هذه المجموعة.
فتح الحزمة
k this deck
35
If the government adopts a "hands off" approach to cost-push inflation in the economy, then in the short run there is likely to be:
A) A rise in real output
B) A fall in unemployment
C) An inflationary spiral
D) A recession
A) A rise in real output
B) A fall in unemployment
C) An inflationary spiral
D) A recession
فتح الحزمة
افتح القفل للوصول البطاقات البالغ عددها 135 في هذه المجموعة.
فتح الحزمة
k this deck
36
Refer to the graph above. Suppose that the economy is at an initial equilibrium where the AD1 and AS1 curves intersect. If cost-push inflation occurs and the government adopts a "hands-off" policy approach, then in the long run the price level will be at:A) P1, and output will be at Q1
B) P3, and output will be at Q1
C) P2, and output will be at Q2
D) P3, and output will be at Q3
فتح الحزمة
افتح القفل للوصول البطاقات البالغ عددها 135 في هذه المجموعة.
فتح الحزمة
k this deck
37
If prices and wages are flexible, a decrease in aggregate demand will in the long run cause only a(n):
A) Decrease in the price level
B) Increase in the price level
C) Increase in the unemployment rate
D) Decrease in real output
A) Decrease in the price level
B) Increase in the price level
C) Increase in the unemployment rate
D) Decrease in real output
فتح الحزمة
افتح القفل للوصول البطاقات البالغ عددها 135 في هذه المجموعة.
فتح الحزمة
k this deck
38
Refer to the graph above. If Qf is potential GDP, wages and prices are flexible, then the long-run aggregate supply curve will be:A) AS2
B) AS1
C) A vertical line at Qf
D) A vertical line at Q1
فتح الحزمة
افتح القفل للوصول البطاقات البالغ عددها 135 في هذه المجموعة.
فتح الحزمة
k this deck
39
Refer to the graph above. An expansion of the economy's production possibilities can, by itself:A) Never cause inflation
B) Never cause price level to fall
C) Cause a decrease in real output
D) Cause a decrease in employment level
فتح الحزمة
افتح القفل للوصول البطاقات البالغ عددها 135 في هذه المجموعة.
فتح الحزمة
k this deck
40
With demand-pull inflation in the extended AD-AS model, there is:
A) A decrease in aggregate demand and a decrease in unemployment that eventually increases nominal wages
B) An increase in aggregate demand and a decrease in unemployment that eventually decreases nominal wages
C) An increase in aggregate demand and an increase in unemployment that eventually decreases nominal wages
D) An increase in aggregate demand and a decrease in unemployment that eventually increases nominal wages
فتح الحزمة
افتح القفل للوصول البطاقات البالغ عددها 135 في هذه المجموعة.
فتح الحزمة
k this deck
41
Refer to the graph above. Assume the economy is at the initial position of B2. It is possible for the government to reduce the unemployment rate and move the economy to C2 if:A) Expected inflation remains at 4%
B) Expected inflation becomes 8%
C) Actual inflation remains at 4%
D) Actual inflation is at 12%
فتح الحزمة
افتح القفل للوصول البطاقات البالغ عددها 135 في هذه المجموعة.
فتح الحزمة
k this deck
42
Adverse aggregate-supply shocks or stagflation would cause a:
A) Movement up along a stable Phillips Curve
B) Movement down along a stable Phillips Curve
C) Shift of the Phillips Curve to the left
D) Shift of the Phillips Curve to the right
A) Movement up along a stable Phillips Curve
B) Movement down along a stable Phillips Curve
C) Shift of the Phillips Curve to the left
D) Shift of the Phillips Curve to the right
فتح الحزمة
افتح القفل للوصول البطاقات البالغ عددها 135 في هذه المجموعة.
فتح الحزمة
k this deck
43
Which factor contributed to the demise of stagflation during the 1982-1989 period?
A) A lessening of foreign competition
B) The decline of the monopoly power of OPEC
C) An increase in the per-unit cost of production
D) An increase in regulation of airline and trucking industries
A) A lessening of foreign competition
B) The decline of the monopoly power of OPEC
C) An increase in the per-unit cost of production
D) An increase in regulation of airline and trucking industries
فتح الحزمة
افتح القفل للوصول البطاقات البالغ عددها 135 في هذه المجموعة.
فتح الحزمة
k this deck
44
A rightward shift of the Phillips Curve suggests that:
A) A higher rate of unemployment is associated with each level of inflation rate
B) A lower rate of inflation is associated with each level of unemployment rate
C) The aggregate supply curve has shifted to the right
D) The aggregate demand curve has shifted to the left
A) A higher rate of unemployment is associated with each level of inflation rate
B) A lower rate of inflation is associated with each level of unemployment rate
C) The aggregate supply curve has shifted to the right
D) The aggregate demand curve has shifted to the left
فتح الحزمة
افتح القفل للوصول البطاقات البالغ عددها 135 في هذه المجموعة.
فتح الحزمة
k this deck
45
Refer to the graphs above. Assume that the economy is initially at equilibrium where AD2 and AS intersect in Graph 1, and also assume that the economy is initially at point C in Graph 2. A movement from point C to point B in graph 2 would most likely be associated, in graph 1, with a shift of:A) AD to the right
B) AD to the left
C) AS to the right
D) AS to the left
فتح الحزمة
افتح القفل للوصول البطاقات البالغ عددها 135 في هذه المجموعة.
فتح الحزمة
k this deck
46
Given a Phillips Curve with stable and predictable inflation and unemployment rate tradeoffs, it appears that:
A) An expansionary fiscal policy can shift the curve to the left
B) A tight money policy can shift the curve to the right
C) Manipulating aggregate demand through fiscal and monetary policies has the effect of causing a movement along the curve
D) Manipulating aggregate demand through fiscal and monetary policies has the effect of shifting the curve
فتح الحزمة
افتح القفل للوصول البطاقات البالغ عددها 135 في هذه المجموعة.
فتح الحزمة
k this deck
47
Stagflation's demise during the 1980s resulted in a:
A) Movement along the Phillips Curve toward less unemployment
B) Movement along the Phillips Curve toward more inflation
C) Shift in the Phillips Curve to the left
D) Shift in the Phillips Curve to the right
A) Movement along the Phillips Curve toward less unemployment
B) Movement along the Phillips Curve toward more inflation
C) Shift in the Phillips Curve to the left
D) Shift in the Phillips Curve to the right
فتح الحزمة
افتح القفل للوصول البطاقات البالغ عددها 135 في هذه المجموعة.
فتح الحزمة
k this deck
48
A potential cause of stagflation is:
A) Agricultural surpluses
B) Declining productivity
C) Improving labor productivity
D) A rise in the value of the dollar
A) Agricultural surpluses
B) Declining productivity
C) Improving labor productivity
D) A rise in the value of the dollar
فتح الحزمة
افتح القفل للوصول البطاقات البالغ عددها 135 في هذه المجموعة.
فتح الحزمة
k this deck
49
Refer to the graphs above. Assume that the economy is initially at equilibrium where AD2 and AS intersect in Graph 1, and also assume that the economy is initially at point C in Graph 2. If the government implements contractionary or restrictive policy, it would make the economy in graph 2 to:A) Move from point C to point B
B) Move from point C to point A
C) Move from point C to point D
D) Remain at point C
فتح الحزمة
افتح القفل للوصول البطاقات البالغ عددها 135 في هذه المجموعة.
فتح الحزمة
k this deck
50
Adverse aggregate supply shocks would result in:
A) A lower rate of inflation and a higher rate of unemployment
B) A higher rate of inflation and a lower rate of unemployment
C) A lower rate of inflation and a lower rate of unemployment
D) A higher rate of inflation and a higher rate of unemployment
A) A lower rate of inflation and a higher rate of unemployment
B) A higher rate of inflation and a lower rate of unemployment
C) A lower rate of inflation and a lower rate of unemployment
D) A higher rate of inflation and a higher rate of unemployment
فتح الحزمة
افتح القفل للوصول البطاقات البالغ عددها 135 في هذه المجموعة.
فتح الحزمة
k this deck
51
Refer to the graph above. The economy is at point B2, and then aggregate demand increases. In the short run, the economy will:A) Stay at point B2 and remain there in the long run
B) Move to point C2 and in the long run move on to B3.
C) Move to point B3 and in the long run move on to C2.
D) Move to point B1 and in the long run move back to B2.
فتح الحزمة
افتح القفل للوصول البطاقات البالغ عددها 135 في هذه المجموعة.
فتح الحزمة
k this deck
52
Refer to the graph above. Assume the economy is at the initial position of B2. An increase in aggregate demand with no corresponding change in inflation expectations and wage rates will tend to:A) Temporarily move the economy to point B3
B) Temporarily move the economy to point C2
C) Temporarily move the economy to point C1
D) Have no effect in shifting the economy from point B2
فتح الحزمة
افتح القفل للوصول البطاقات البالغ عددها 135 في هذه المجموعة.
فتح الحزمة
k this deck
53
The inflation and unemployment data for the 1970s suggest that the aggregate-supply shocks of that period caused the:
A) Relationship between the unemployment rate and the rate of inflation to remain stable, predictable, and exhibited a clear tradeoff
B) Relationship between the unemployment rate and the rate of inflation to be similar to that found during the 1960 and 1969 period
C) Phillips Curve to shift to the right
D) Phillips Curve to shift to the left
فتح الحزمة
افتح القفل للوصول البطاقات البالغ عددها 135 في هذه المجموعة.
فتح الحزمة
k this deck
54
Refer to the graph above. Assume the economy is at the initial position of B2. An increase in aggregate demand with a corresponding adjustment in inflation expectations and wages will tend to:A) Move the economy to point B3
B) Move the economy to point C2
C) Move the economy to point C1
D) Have no effect in shifting the economy from point B2
فتح الحزمة
افتح القفل للوصول البطاقات البالغ عددها 135 في هذه المجموعة.
فتح الحزمة
k this deck
55
Refer to the graph above. What events would tend to temporarily move the economy from point B2 to C2?A) A tight monetary policy
B) A contractionary fiscal policy
C) An easy money policy
D) An increase in aggregate supply
فتح الحزمة
افتح القفل للوصول البطاقات البالغ عددها 135 في هذه المجموعة.
فتح الحزمة
k this deck
56
If the economy is operating in the intermediate range of the aggregate supply curve, then the greater the rate of growth of aggregate demand the:
A) Greater the resulting increase in the price level, the greater the rate of growth of output, and the greater the unemployment rate
B) Greater the resulting increase in the price level, the lower the rate of growth of output, and the greater the unemployment rate
C) Less the resulting increase in the price level, the lower the rate of growth of output, and the greater the unemployment rate
D) Greater the resulting increase in the price level, the greater the rate of growth of output, and the lower the unemployment rate
فتح الحزمة
افتح القفل للوصول البطاقات البالغ عددها 135 في هذه المجموعة.
فتح الحزمة
k this deck
57
The misery index is a measure of national economic discomfort that adds together a nation's:
A) Saving and investment
B) Budget deficit and public debt
C) Unemployment rate and inflation rate
D) Level of taxation with the amount of government spending
A) Saving and investment
B) Budget deficit and public debt
C) Unemployment rate and inflation rate
D) Level of taxation with the amount of government spending
فتح الحزمة
افتح القفل للوصول البطاقات البالغ عددها 135 في هذه المجموعة.
فتح الحزمة
k this deck
58
Stagflation can be described as a:
A) Shift right in the aggregate supply curve
B) Shift left in the aggregate supply curve
C) Period of stable prices and high unemployment
D) Period of rising prices and low unemployment
A) Shift right in the aggregate supply curve
B) Shift left in the aggregate supply curve
C) Period of stable prices and high unemployment
D) Period of rising prices and low unemployment
فتح الحزمة
افتح القفل للوصول البطاقات البالغ عددها 135 في هذه المجموعة.
فتح الحزمة
k this deck
59
Consider the following national data: tax revenues as a percent of GDP: 25 percent; government spending as a percent of GDP: 31 percent; unemployment rate: 9 percent; inflation rate: 6 percent. What is the misery index for this nation?
A) 15 percent
B) 31 percent
C) 34 percent
D) 53 percent
A) 15 percent
B) 31 percent
C) 34 percent
D) 53 percent
فتح الحزمة
افتح القفل للوصول البطاقات البالغ عددها 135 في هذه المجموعة.
فتح الحزمة
k this deck
60
Which event probably contributed to the stagflation of the 1970s?
A) Worldwide agricultural surpluses
B) An improvement in productivity of resources
C) An appreciation in the dollar
D) A sharp rise the price of oil
A) Worldwide agricultural surpluses
B) An improvement in productivity of resources
C) An appreciation in the dollar
D) A sharp rise the price of oil
فتح الحزمة
افتح القفل للوصول البطاقات البالغ عددها 135 في هذه المجموعة.
فتح الحزمة
k this deck
61
A Congressional representative who calls for a decrease in tax rates in order to increase saving, work effort, and economic growth would most likely be advocating:
A) An easy money policy
B) A tight money policy
C) A supply-side fiscal policy
D) A contractionary fiscal policy
A) An easy money policy
B) A tight money policy
C) A supply-side fiscal policy
D) A contractionary fiscal policy
فتح الحزمة
افتح القفل للوصول البطاقات البالغ عددها 135 في هذه المجموعة.
فتح الحزمة
k this deck
62
Supply-side economists contend that the system of taxation in the United States:
A) Creates incentives to save and invest
B) Creates dis-incentives to work
C) Generates maximum tax revenue
D) Reduces the effects of cost-push inflation
A) Creates incentives to save and invest
B) Creates dis-incentives to work
C) Generates maximum tax revenue
D) Reduces the effects of cost-push inflation
فتح الحزمة
افتح القفل للوصول البطاقات البالغ عددها 135 في هذه المجموعة.
فتح الحزمة
k this deck
63
Based on the Phillips Curve, when the actual rate of inflation is greater than the expected rate, the unemployment rate will:
A) Rise temporarily, but decreases in nominal wages will bring the expected and actual rates of inflation into balance
B) Rise temporarily, but increases in nominal wages will bring the expected and actual rates of inflation into balance
C) Fall temporarily, but increases in nominal wages will bring the expected and actual rates of inflation into balance
D) Fall temporarily, but decreases in nominal wages will bring the actual and expected rates of inflation into balance
فتح الحزمة
افتح القفل للوصول البطاقات البالغ عددها 135 في هذه المجموعة.
فتح الحزمة
k this deck
64
If the expected rate of inflation rises, then the short-run Phillips Curve would:
A) Shift to the right
B) Shift to the left
C) Become vertical
D) Become flat
A) Shift to the right
B) Shift to the left
C) Become vertical
D) Become flat
فتح الحزمة
افتح القفل للوصول البطاقات البالغ عددها 135 في هذه المجموعة.
فتح الحزمة
k this deck
65
The short-run Phillips Curve intersects the long-run Phillips Curve at the:
A) Nominal rate of interest
B) Current rate of inflation
C) Real interest rate
D) Natural rate of unemployment
A) Nominal rate of interest
B) Current rate of inflation
C) Real interest rate
D) Natural rate of unemployment
فتح الحزمة
افتح القفل للوصول البطاقات البالغ عددها 135 في هذه المجموعة.
فتح الحزمة
k this deck
66
When the rate of inflation is decreasing, this economic condition is called:
A) Disinflation
B) Depreciation
C) Stagflation
D) Deflation
A) Disinflation
B) Depreciation
C) Stagflation
D) Deflation
فتح الحزمة
افتح القفل للوصول البطاقات البالغ عددها 135 في هذه المجموعة.
فتح الحزمة
k this deck
67
In an aggregate demand-aggregate supply framework, fiscal policy that emphasizes cutting taxes as a means of improving incentives to work, save, and invest would be characterized primarily as a:
A) Rightward shift of the aggregate demand curve
B) Leftward shift of the aggregate demand curve
C) Rightward shift of the long-run aggregate supply curve
D) Leftward shift of the long-run aggregate supply curve
A) Rightward shift of the aggregate demand curve
B) Leftward shift of the aggregate demand curve
C) Rightward shift of the long-run aggregate supply curve
D) Leftward shift of the long-run aggregate supply curve
فتح الحزمة
افتح القفل للوصول البطاقات البالغ عددها 135 في هذه المجموعة.
فتح الحزمة
k this deck
68
Refer to the table above. Calculating the annual inflation rates would indicate that this economy is experiencing:A) Stagflation
B) Deflation
C) Disinflation
D) Constant inflation
فتح الحزمة
افتح القفل للوصول البطاقات البالغ عددها 135 في هذه المجموعة.
فتح الحزمة
k this deck
69
Supply-side policies can be described in terms of the aggregate demand and aggregate supply model as an attempt to shift:
A) The aggregate demand curve to the right
B) The aggregate supply curve to the right
C) Both the aggregate supply curve and the aggregate demand curve to the right
D) The aggregate supply curve to the right and the aggregate demand curve to the left
A) The aggregate demand curve to the right
B) The aggregate supply curve to the right
C) Both the aggregate supply curve and the aggregate demand curve to the right
D) The aggregate supply curve to the right and the aggregate demand curve to the left
فتح الحزمة
افتح القفل للوصول البطاقات البالغ عددها 135 في هذه المجموعة.
فتح الحزمة
k this deck
70
Refer to the table above. What would be the annual inflation rates in Years 2, 3, and 4, respectively?A) 10, 9.1, and 8.3 percent
B) 10, 8.3, and 7.7 percent
C) 10, 10, and 10 percent
فتح الحزمة
افتح القفل للوصول البطاقات البالغ عددها 135 في هذه المجموعة.
فتح الحزمة
k this deck
71
The long-run Phillips Curve is vertical at:
A) Price level of 100
B) The natural rate of unemployment
C) The natural rate of inflation
D) Potential GDP
A) Price level of 100
B) The natural rate of unemployment
C) The natural rate of inflation
D) Potential GDP
فتح الحزمة
افتح القفل للوصول البطاقات البالغ عددها 135 في هذه المجموعة.
فتح الحزمة
k this deck
72
Disinflation can be explained by the Phillips Curve analysis as resulting from a situation where the actual rate of inflation is initially less than the expected rate, causing the unemployment rate to:
A) Rise temporarily, but consequent decreases in nominal wages will eventually bring the actual and expected rates of inflation into balance
B) Rise temporarily, but consequent increases in nominal wages will eventually bring the actual and expected rates of inflation into balance
C) Fall temporarily, but consequent increases in nominal wages will eventually bring the actual and expected rates of inflation into balance
D) Fall temporarily, but consequent decreases in nominal wages will eventually bring the actual and expected rates of inflation into balance
فتح الحزمة
افتح القفل للوصول البطاقات البالغ عددها 135 في هذه المجموعة.
فتح الحزمة
k this deck
73
Which action will tend to decrease aggregate supply according to supply-side economists?
A) A decrease in government spending
B) An increase in the stock of capital
C) A decrease in the money supply
D) An increase in marginal tax rates
A) A decrease in government spending
B) An increase in the stock of capital
C) A decrease in the money supply
D) An increase in marginal tax rates
فتح الحزمة
افتح القفل للوصول البطاقات البالغ عددها 135 في هذه المجموعة.
فتح الحزمة
k this deck
74
The automatic adjustment mechanism that makes the economy move towards the long-run Phillips Curve is:
A) Expansionary fiscal or monetary policy
B) Inflation expectations and wage adjustments
C) Contractionary fiscal or monetary policy
D) Increases in productivity over time
A) Expansionary fiscal or monetary policy
B) Inflation expectations and wage adjustments
C) Contractionary fiscal or monetary policy
D) Increases in productivity over time
فتح الحزمة
افتح القفل للوصول البطاقات البالغ عددها 135 في هذه المجموعة.
فتح الحزمة
k this deck
75
Assume contracts between workers and employers that call for an increase in the wage rate of 5 percent are based on an expected inflation rate of 3 percent. Should inflation actually be 6 percent, then:
A) Nominal wages fall by 5 percent
B) Real wages fall by 6 percent
C) Nominal wages fall by 1 percent
D) Real wages fall by 1 percent
A) Nominal wages fall by 5 percent
B) Real wages fall by 6 percent
C) Nominal wages fall by 1 percent
D) Real wages fall by 1 percent
فتح الحزمة
افتح القفل للوصول البطاقات البالغ عددها 135 في هذه المجموعة.
فتح الحزمة
k this deck
76
Which is a basic proposition of supply-side economics?
A) The Federal Reserve should target the Federal funds rate rather than the money supply
B) Tax-hikes on business reduce productivity and output and reduce aggregate supply
C) Low marginal tax rates reduce incentives to work, saving, and investment
D) Transfer payments increase incentives to work
A) The Federal Reserve should target the Federal funds rate rather than the money supply
B) Tax-hikes on business reduce productivity and output and reduce aggregate supply
C) Low marginal tax rates reduce incentives to work, saving, and investment
D) Transfer payments increase incentives to work
فتح الحزمة
افتح القفل للوصول البطاقات البالغ عددها 135 في هذه المجموعة.
فتح الحزمة
k this deck
77
The analysis of the short-run and long-run Phillips Curve suggests that an increase in aggregate demand:
A) Influences real output and employment in the long run, but not in the short run
B) Influences real output and employment in the short run, but not in the long run
C) Does not influence the price level in the short run or the long run but only real output and employment
D) Does not influence real output and employment in the short run or the long run but only the price level
فتح الحزمة
افتح القفل للوصول البطاقات البالغ عددها 135 في هذه المجموعة.
فتح الحزمة
k this deck
78
The short-run Phillips Curve assumes an unchanging:
A) Actual rate of inflation
B) Expected rate of inflation
C) Unemployment rate
D) Fiscal or monetary policy
A) Actual rate of inflation
B) Expected rate of inflation
C) Unemployment rate
D) Fiscal or monetary policy
فتح الحزمة
افتح القفل للوصول البطاقات البالغ عددها 135 في هذه المجموعة.
فتح الحزمة
k this deck
79
Assume that a person saves $50,000 and earns 7 percent annual interest. If the marginal tax rate is 36 percent, then the after-tax interest earning will be:
A) $2000
B) $2240
C) $2760
D) $3500
A) $2000
B) $2240
C) $2760
D) $3500
فتح الحزمة
افتح القفل للوصول البطاقات البالغ عددها 135 في هذه المجموعة.
فتح الحزمة
k this deck
80
In the short run, if the actual rate of inflation is lower than the expected rate, then:
A) Nominal wages will rise, profits will fall, and unemployment will rise
B) Nominal wages will fall, profits will rise, and unemployment will fall
C) Nominal wages will rise, profits will rise, and unemployment will fall
D) Nominal wages will fall, profits will fall, and unemployment will rise
A) Nominal wages will rise, profits will fall, and unemployment will rise
B) Nominal wages will fall, profits will rise, and unemployment will fall
C) Nominal wages will rise, profits will rise, and unemployment will fall
D) Nominal wages will fall, profits will fall, and unemployment will rise
فتح الحزمة
افتح القفل للوصول البطاقات البالغ عددها 135 في هذه المجموعة.
فتح الحزمة
k this deck
فتح الحزمة
افتح القفل للوصول البطاقات البالغ عددها 135 في هذه المجموعة.


