Deck 12: Experimental Design and Analysis of Variance
ملء الشاشة (f)
سؤال
سؤال
سؤال
سؤال
سؤال
سؤال
سؤال
سؤال
سؤال
سؤال
سؤال
سؤال
سؤال
سؤال
سؤال
سؤال
سؤال
سؤال
سؤال
سؤال
سؤال
سؤال
سؤال
سؤال
سؤال
سؤال
سؤال
سؤال
سؤال
سؤال
سؤال
سؤال
سؤال
سؤال
سؤال
سؤال
سؤال
سؤال
سؤال
سؤال
سؤال
A manufacturing company produces part QV2Y for the aerospace industry.This particular part can be manufactured using 3 different production processes.The management wants to know if the quality of the units of part QV2Y is the same for all three processes.The production supervisor obtained the following data: Process 1 had 29 defective units in 240 items,Process 2 produced 12 defective units in 180 items,and Process 3 manufactured 9 defective units in 150 items.Chi-Square Contingency Table Test for Independence 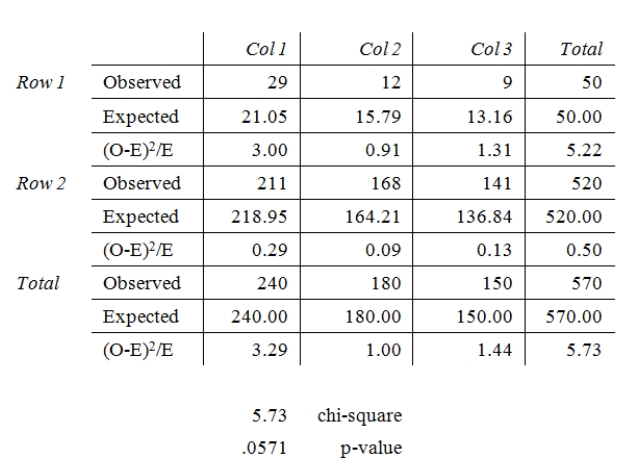 At a significance level of .10,the management wants to perform a hypothesis test to determine if the quality of the items produced appears to be independent of the production process used.Based on the results summarized in the MegaStat/Excel output provided in the table above,we
A) do not reject H0 and conclude that the quality of the product is not the same for all processes.
B) reject H0 and conclude that the quality of the product is dependent on the manufacturing process.
C) do not reject H0,and conclude that the quality of the product does not significantly differ among the three processes.
D) reject H0 and conclude that the quality of the product is independent of the production process utilized.
At a significance level of .10,the management wants to perform a hypothesis test to determine if the quality of the items produced appears to be independent of the production process used.Based on the results summarized in the MegaStat/Excel output provided in the table above,weA) do not reject H0 and conclude that the quality of the product is not the same for all processes.
B) reject H0 and conclude that the quality of the product is dependent on the manufacturing process.
C) do not reject H0,and conclude that the quality of the product does not significantly differ among the three processes.
D) reject H0 and conclude that the quality of the product is independent of the production process utilized.
سؤال
A study of car accidents and drivers who use cell phones collects the following sample data. 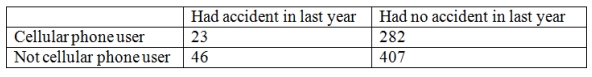 Determine the expected frequencies of those who had accidents in the last year to use for the chi-square test of independence.
Determine the expected frequencies of those who had accidents in the last year to use for the chi-square test of independence. سؤال
A paper presented at a recent meeting of higher education researchers compared the type of college freshmen attend and the numbers who drop out.A random sample of freshmen shows the following results. 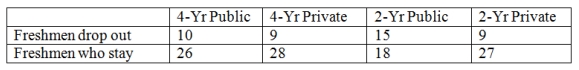 Calculate the chi-square statistic for this test of independence.
Calculate the chi-square statistic for this test of independence. سؤال
سؤال
A study of car accidents and drivers who use cell phones collects the following sample data. 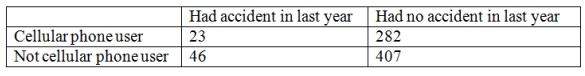 At a significance level of 0.05,determine the appropriate degrees of freedom and the rejection point condition for the test.
At a significance level of 0.05,determine the appropriate degrees of freedom and the rejection point condition for the test. سؤال
A real estate company is analyzing the selling prices of residential homes in a given community.140 homes that have been sold in the past month are randomly selected and their selling prices are recorded.The statistician working on the project has stated that in order to perform various statistical tests,the data must be distributed according to a normal distribution.In order to determine whether the selling prices of homes included in the random sample are normally distributed,the statistician divides the data into 6 classes of equal size and records the number of observations in each class.She then performs a chi-square goodness-of-fit test for normal distribution.The results are summarized in the following table. 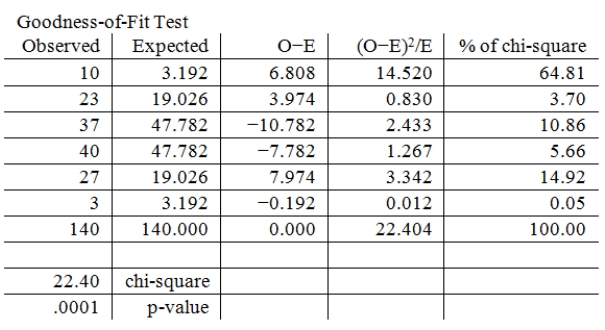 At a significance level of .05,we
A) reject H0;conclude that the residential home selling prices are not distributed according to a normal distribution.
B) do not reject H0;conclude that the residential home selling prices are not distributed according to a normal distribution.
C) reject H0;conclude that the residential home selling prices are distributed according to a normal distribution.
D) do not reject H0;conclude that the residential home selling prices are distributed according to a normal distribution.
At a significance level of .05,weA) reject H0;conclude that the residential home selling prices are not distributed according to a normal distribution.
B) do not reject H0;conclude that the residential home selling prices are not distributed according to a normal distribution.
C) reject H0;conclude that the residential home selling prices are distributed according to a normal distribution.
D) do not reject H0;conclude that the residential home selling prices are distributed according to a normal distribution.
سؤال
A study of car accidents and drivers who use cell phones collects the following sample data. 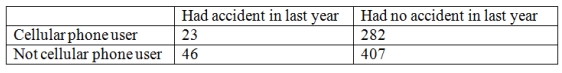 Determine the expected frequencies of those who had accidents in the last year to use for the chi-square test of independence.
Determine the expected frequencies of those who had accidents in the last year to use for the chi-square test of independence. سؤال
A real estate company is analyzing the selling prices of residential homes in a given community.140 homes that have been sold in the past month are randomly selected and their selling prices are recorded.The statistician working on the project has stated that in order to perform various statistical tests,the data must be distributed according to a normal distribution.In order to determine whether the selling prices of homes included in the random sample are normally distributed,the statistician divides the data into 6 classes of equal size and records the number of observations in each class.She then performs a chi-square goodness-of-fit test for normal distribution.The results are summarized in the following table.  What is the appropriate null hypothesis?
A) H0: The residential home selling prices are distributed according to a normal distribution.
B) H0: The residential home selling prices are not distributed according to a normal distribution.
C) H0: The distribution of residential home selling prices is either right or left skewed.
D) H0: The distribution of the residential home selling prices is symmetric.
E) None of the other answers is correct.
What is the appropriate null hypothesis?A) H0: The residential home selling prices are distributed according to a normal distribution.
B) H0: The residential home selling prices are not distributed according to a normal distribution.
C) H0: The distribution of residential home selling prices is either right or left skewed.
D) H0: The distribution of the residential home selling prices is symmetric.
E) None of the other answers is correct.
سؤال
A study of car accidents and drivers who use cell phones collects the following sample data. 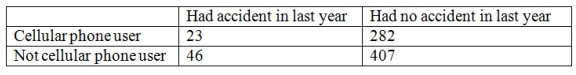 Calculate the chi-square statistic for this test of independence.
Calculate the chi-square statistic for this test of independence. سؤال
A real estate company is analyzing the selling prices of residential homes in a given community.140 homes that have been sold in the past month are randomly selected and their selling prices are recorded.The statistician working on the project has stated that in order to perform various statistical tests,the data must be distributed according to a normal distribution.In order to determine whether the selling prices of homes included in the random sample are normally distributed,the statistician divides the data into 6 classes of equal size and records the number of observations in each class.She then performs a chi-square goodness-of-fit test for normal distribution.The results are summarized in the following table.  At a significance level of .05,what is the appropriate rejection point condition?
A) Reject H0 if χ2 > 12.5916
B) Reject H0 if χ2 > 11.0705
C) Reject H0 if χ2 > 9.3484
D) Reject H0 if χ2 > 7.81473
E) Reject H0 if χ2 > 9.48773
At a significance level of .05,what is the appropriate rejection point condition?A) Reject H0 if χ2 > 12.5916
B) Reject H0 if χ2 > 11.0705
C) Reject H0 if χ2 > 9.3484
D) Reject H0 if χ2 > 7.81473
E) Reject H0 if χ2 > 9.48773
سؤال
Consider the 3 × 2 contingency table below.  Compute the expected frequencies in row 1.
Compute the expected frequencies in row 1. سؤال
A real estate company is analyzing the selling prices of residential homes in a given community.140 homes that have been sold in the past month are randomly selected and their selling prices are recorded.The statistician working on the project has stated that in order to perform various statistical tests,the data must be distributed according to a normal distribution.In order to determine whether the selling prices of homes included in the random sample are normally distributed,the statistician divides the data into 6 classes of equal size and records the number of observations in each class.She then performs a chi-square goodness-of-fit test for normal distribution.The results are summarized in the following table  What are the degrees of freedom for the chi-square test?
A) 2
B) 3
C) 4
D) 5
E) 6
What are the degrees of freedom for the chi-square test?A) 2
B) 3
C) 4
D) 5
E) 6
سؤال
Consider the 3 × 2 contingency table below.  Compute the expected frequencies in row 3.
Compute the expected frequencies in row 3. سؤال
Consider the 3 × 2 contingency table below.  Compute the expected frequencies in row 2.
Compute the expected frequencies in row 2. سؤال
A paper presented at a recent meeting of higher education researchers compared the type of college that freshmen attend and the numbers who drop out.A random sample of freshmen shows the following results. 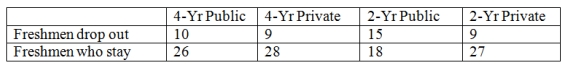 Determine the expected frequencies for the freshmen who drop out of 2-year institutions that will be used in the chi-square test of independence.
Determine the expected frequencies for the freshmen who drop out of 2-year institutions that will be used in the chi-square test of independence. سؤال
A paper presented at a recent meeting of higher education researchers compared the type of college that freshmen attend and the numbers who drop out.A random sample of freshmen shows the following results. 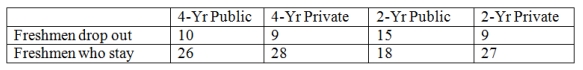 At a significance level of .05,determine the appropriate degrees of freedom and the rejection point condition for this test.
At a significance level of .05,determine the appropriate degrees of freedom and the rejection point condition for this test. سؤال
A paper presented at a recent meeting of higher education researchers compared the type of college that freshmen attend and the numbers who drop out.A random sample of freshmen shows the following results. 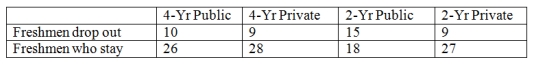 Determine the expected frequencies for the two cells of 4-year public institutions that will be used in the chi-square test of independence.
Determine the expected frequencies for the two cells of 4-year public institutions that will be used in the chi-square test of independence. سؤال
A manufacturing company produces part QV2Y for the aerospace industry.This particular part can be manufactured using 3 different production processes.The management wants to know if the quality of the units of part QV2Y is the same for all three processes.The production supervisor obtained the following data: Process 1 had 29 defective units in 240 items,Process 2 produced 12 defective units in 180 items,and Process 3 manufactured 9 defective units in 150 items.Chi-Square Contingency Table Test for Independence  At a significance level of .05,the management wants to perform a hypothesis test to determine if the quality of the items produced appears to be independent of the production process used.Based on the results summarized in the MegaStat/Excel output provided in the table above,we
A) reject H0 and conclude that the quality of the product is not the same for all processes.
B) reject H0 and conclude that the quality of the product is dependent on the manufacturing process.
C) do not reject H0,and conclude that the quality of the product does not significantly differ among the three processes.
D) do not reject H0,and conclude that the quality of the product is not the same for all processes.
E) reject H0 and conclude that the quality of the product is independent of the manufacturing process used.
At a significance level of .05,the management wants to perform a hypothesis test to determine if the quality of the items produced appears to be independent of the production process used.Based on the results summarized in the MegaStat/Excel output provided in the table above,weA) reject H0 and conclude that the quality of the product is not the same for all processes.
B) reject H0 and conclude that the quality of the product is dependent on the manufacturing process.
C) do not reject H0,and conclude that the quality of the product does not significantly differ among the three processes.
D) do not reject H0,and conclude that the quality of the product is not the same for all processes.
E) reject H0 and conclude that the quality of the product is independent of the manufacturing process used.
سؤال
A paper presented at a recent meeting of higher education researchers compared the type of college freshmen attend and the numbers who drop out.A random sample of freshmen shows the following results. 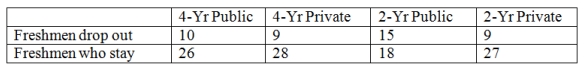 Use a significance level of .05 and determine if the type of school and the drop rate are independent.(Null hypothesis is that dropout rate is independent of type of school. )
Use a significance level of .05 and determine if the type of school and the drop rate are independent.(Null hypothesis is that dropout rate is independent of type of school. ) سؤال
Consider the 3 × 2 contingency table below. 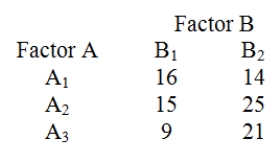 How many degrees of freedom are associated with the chi-square test?
How many degrees of freedom are associated with the chi-square test? سؤال
The AAA Co.is interested in the level of satisfaction of their employees in the benefit package that they offer compared to their major competitors.A consultant hired to conduct the satisfaction survey told AAA Co.that the distribution of level of satisfaction at other companies is displayed below.Very Satisfied
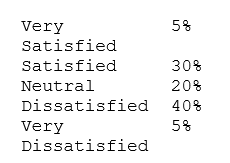
A survey was conducted of 125 AAA employees with the following results.
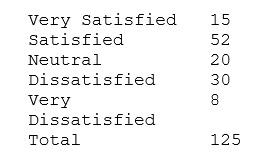
Using the critical value for α = .05,test the null hypothesis that the distribution of AAA employees at each satisfaction level is similar to the distribution of the employees of their major competitors.
A survey was conducted of 125 AAA employees with the following results.
Using the critical value for α = .05,test the null hypothesis that the distribution of AAA employees at each satisfaction level is similar to the distribution of the employees of their major competitors.
سؤال
A survey was conducted on the age and gender of the purchasers of a specific automotive model.The results are below.
Test the null hypothesis that age is independent of gender at α = .05.
Test the null hypothesis that age is independent of gender at α = .05.
سؤال
سؤال
The AAA Co.is interested in the level of satisfaction of their employees with the benefit package that they offer compared to their major competitors.A consultant hired to conduct the satisfaction survey told AAA Co.that the distribution of level of satisfaction at other companies is displayed below.Very Satisfied
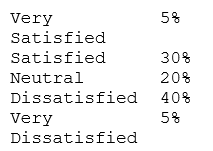
A survey of 125 AAA employees gave the following results.
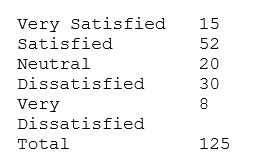
What are the degrees of freedom for testing the goodness of fit at α = .05?
A survey of 125 AAA employees gave the following results.
What are the degrees of freedom for testing the goodness of fit at α = .05?
سؤال
The HR manager of a major office supply chain is interested in determining whether employee educational level affects knowledge of their job.An exam was given to 120 employees.The results are below. 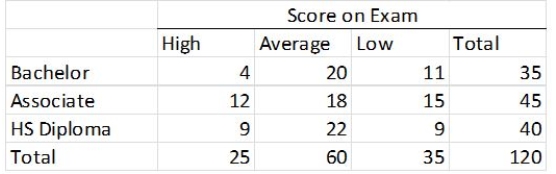 For each cell,calculate the corresponding cell,row,and column percentage.
For each cell,calculate the corresponding cell,row,and column percentage. سؤال
The distance (in thousands of miles)traveled by buses before their first major motor failure is distributed below,with an estimated mean and standard deviation of 95.7 and 38.1.Also shown are the expected frequencies of these intervals if the original population was a normal distribution. 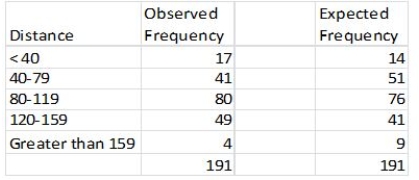 What is the df for testing the hypothesis that the original population is a normal distribution?
What is the df for testing the hypothesis that the original population is a normal distribution? سؤال
The HR manager of a major office supply chain is interested in determining whether employee educational level affects knowledge of their job.An exam was given to 120 employees.The results are below. 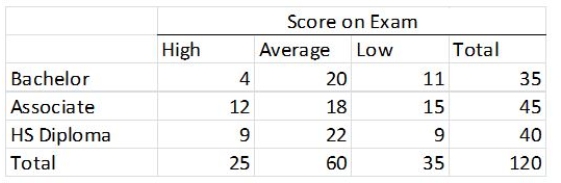 For each row total,calculate the corresponding percentage.
For each row total,calculate the corresponding percentage. سؤال
The following frequency table summarizes the ages of 60 shoppers at the local farmer's market. 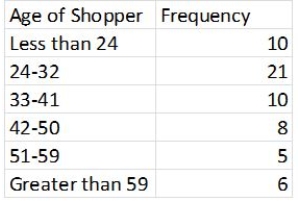 The estimated mean is 36.25,and the estimated standard deviation is 13.57.Calculate the expected frequencies for each interval,assuming a normal distribution.
The estimated mean is 36.25,and the estimated standard deviation is 13.57.Calculate the expected frequencies for each interval,assuming a normal distribution. سؤال
سؤال
The following frequency table summarizes the ages of 60 shoppers at the local farmer's market. 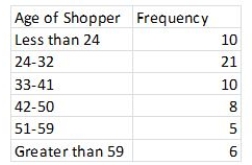 The estimated mean is 36.25,and the estimated standard deviation is 13.57.Calculate the value of the chi-square test statistic to determine whether these measurements came from a normal population.
 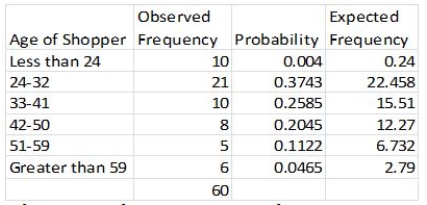 χ2 = (10 − .24)2/.24 + (21 − 22.458)2/22.458 + (10 − 15.51)2/15.51 + (8 − 12.27)2/12.27
+ (5 − 6.732)2/6.732 + (6 − 2.79)2/2.79 = 404.58
The estimated mean is 36.25,and the estimated standard deviation is 13.57.Calculate the value of the chi-square test statistic to determine whether these measurements came from a normal population. χ2 = (10 − .24)2/.24 + (21 − 22.458)2/22.458 + (10 − 15.51)2/15.51 + (8 − 12.27)2/12.27+ (5 − 6.732)2/6.732 + (6 − 2.79)2/2.79 = 404.58
سؤال
سؤال
A survey was conducted on the age and gender of the purchasers of a specific automotive model.The results are below.
For each column total,calculate the corresponding percentage.
For each column total,calculate the corresponding percentage.
سؤال
A survey was conducted on the age and gender of the purchasers of a specific automotive model.The results are below.
For each row total,calculate the corresponding percentage.
For each row total,calculate the corresponding percentage.
سؤال
The HR manager of a major office supply chain is interested in determining whether employee educational level affects knowledge of their job.An exam was given to 120 employees.The results are below. 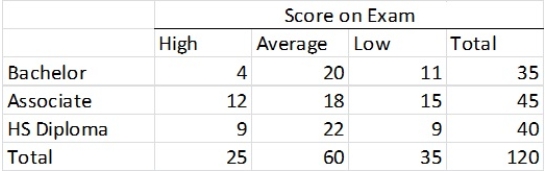 For each column total,calculate the corresponding percentage.
For each column total,calculate the corresponding percentage. سؤال
A survey was conducted on the age and gender of the purchasers of a specific automotive model.The results are below.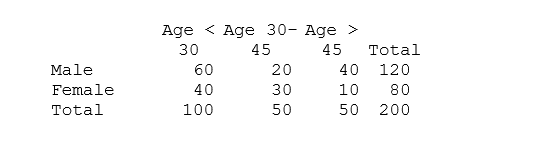
For each cell,calculate the corresponding cell,row,and column percentage.
For each cell,calculate the corresponding cell,row,and column percentage.
سؤال
سؤال
The HR manager of a major office supply chain is interested in determining whether employee educational level affects knowledge of their job.An exam was given to 120 employees.The results are below. 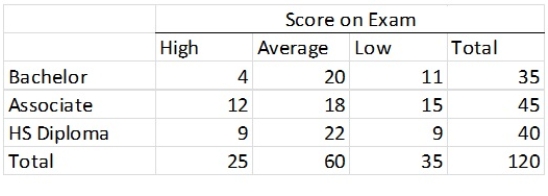 Test the null hypothesis that score is independent of education level at α = .01.
Test the null hypothesis that score is independent of education level at α = .01. سؤال
The following frequency table summarizes the ages of 60 shoppers at the local farmer's market. 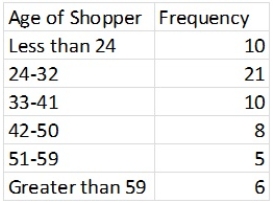 The estimated mean is 36.25,and estimated standard deviation is 13.57.Calculate the probability for each interval,assuming a normal distribution.
The estimated mean is 36.25,and estimated standard deviation is 13.57.Calculate the probability for each interval,assuming a normal distribution. سؤال
The following frequency table summarizes the ages of 60 shoppers at the local farmer's market  The estimated mean is 36.25,and the estimated standard deviation is 13.57.It is desired to test whether these measurements came from a normal population.What is the df for this chi-square test of normality?
The estimated mean is 36.25,and the estimated standard deviation is 13.57.It is desired to test whether these measurements came from a normal population.What is the df for this chi-square test of normality? سؤال

فتح الحزمة
قم بالتسجيل لفتح البطاقات في هذه المجموعة!
Unlock Deck
Unlock Deck
1/81
العب
ملء الشاشة (f)
Deck 12: Experimental Design and Analysis of Variance
1
When we carry out a chi-square test of independence,the chi-square statistic is based on (r × c)− 1 degrees of freedom,where r and c denote,respectively,the number of rows and columns in the contingency table.
False
2
When using a chi-square goodness-of-fit test with multinomial probabilities,the rejection of the null hypothesis indicates that at least one of the multinomial probabilities is not equal to the value stated in the null hypothesis.
True
3
A multinomial probability distribution describes data that are classified into two or more categories when a multinomial experiment is carried out.
True
4
In performing a chi-square test of independence,as the difference between the respective observed and expected frequencies calculated by assuming independence decreases,the probability of concluding that the row variable is independent of the column variable decreases.
فتح الحزمة
افتح القفل للوصول البطاقات البالغ عددها 81 في هذه المجموعة.
فتح الحزمة
k this deck
5
The actual counts in the cells of a contingency table are referred to as the expected cell frequencies.
فتح الحزمة
افتح القفل للوصول البطاقات البالغ عددها 81 في هذه المجموعة.
فتح الحزمة
k this deck
6
When we carry out a chi-square test of independence,the expected frequencies are based on the null hypothesis.
فتح الحزمة
افتح القفل للوصول البطاقات البالغ عددها 81 في هذه المجموعة.
فتح الحزمة
k this deck
7
The chi-square distribution is a continuous probability distribution that is skewed to the left.
فتح الحزمة
افتح القفل للوصول البطاقات البالغ عددها 81 في هذه المجموعة.
فتح الحزمة
k this deck
8
A contingency table summarizes data that has been classified on two dimensions or scales.
فتح الحزمة
افتح القفل للوصول البطاقات البالغ عددها 81 في هذه المجموعة.
فتح الحزمة
k this deck
9
In performing a chi-square goodness-of-fit test with multinomial probabilities,the smaller the difference between observed and expected frequencies,the higher the probability of concluding that the probabilities specified in the null hypothesis are correct.
فتح الحزمة
افتح القفل للوصول البطاقات البالغ عددها 81 في هذه المجموعة.
فتح الحزمة
k this deck
10
When using the chi-square goodness-of-fit test,if the value of the chi-square statistic is large enough,we reject the null hypothesis.
فتح الحزمة
افتح القفل للوصول البطاقات البالغ عددها 81 في هذه المجموعة.
فتح الحزمة
k this deck
11
When we carry out a chi-square test of independence,if ri is the row total for row i and cj is the column total for column j,then the estimated expected cell frequency corresponding to row i and column j equals (ri)(cj)/n.
فتح الحزمة
افتح القفل للوصول البطاقات البالغ عددها 81 في هذه المجموعة.
فتح الحزمة
k this deck
12
The chi-square goodness-of-fit test can only be used to test whether a population has specified multinomial probabilities or to test if a sample has been selected from a normally distributed population.It cannot be used if sample data come from other distribution forms,such as the Poisson.
فتح الحزمة
افتح القفل للوصول البطاقات البالغ عددها 81 في هذه المجموعة.
فتح الحزمة
k this deck
13
The χ2 goodness-of-fit test requires the nominative level of data.
فتح الحزمة
افتح القفل للوصول البطاقات البالغ عددها 81 في هذه المجموعة.
فتح الحزمة
k this deck
14
A fastener manufacturing company uses a chi-square goodness-of-fit test to determine if a population of all lengths of ¼-inch bolts it manufactures is distributed according to a normal distribution.If we reject the null hypothesis,it is reasonable to assume that the population distribution is at least approximately normally distributed.
فتح الحزمة
افتح القفل للوصول البطاقات البالغ عددها 81 في هذه المجموعة.
فتح الحزمة
k this deck
15
In a contingency table,when all the expected frequencies equal the observed frequencies,the calculated χ2 statistic equals zero.
فتح الحزمة
افتح القفل للوصول البطاقات البالغ عددها 81 في هذه المجموعة.
فتح الحزمة
k this deck
16
One use of the chi-square goodness-of-fit test is to determine if specified multinomial probabilities in the null hypothesis are correct.
فتح الحزمة
افتح القفل للوصول البطاقات البالغ عددها 81 في هذه المجموعة.
فتح الحزمة
k this deck
17
Expected cell frequencies for a multinomial distribution are calculated by assuming statistical dependence.
فتح الحزمة
افتح القفل للوصول البطاقات البالغ عددها 81 في هذه المجموعة.
فتح الحزمة
k this deck
18
When we carry out a chi-square test of independence,in the alternative hypothesis we state that the two classifications are statistically independent.
فتح الحزمة
افتح القفل للوصول البطاقات البالغ عددها 81 في هذه المجموعة.
فتح الحزمة
k this deck
19
In a contingency table,if all of the expected frequencies equal the observed frequencies,then we can conclude that there is a perfect association between rows and columns.
فتح الحزمة
افتح القفل للوصول البطاقات البالغ عددها 81 في هذه المجموعة.
فتح الحزمة
k this deck
20
The trials of a multinomial probability are assumed to be dependent.
فتح الحزمة
افتح القفل للوصول البطاقات البالغ عددها 81 في هذه المجموعة.
فتح الحزمة
k this deck
21
When we carry out a chi-square test of independence,as the differences between the respective observed and expected frequencies decrease,the probability of concluding that the row variable is independent of the column variable
A) decreases.
B) increases.
C) may decrease or increase depending on the number of rows and columns.
D) will be unaffected.
A) decreases.
B) increases.
C) may decrease or increase depending on the number of rows and columns.
D) will be unaffected.
فتح الحزمة
افتح القفل للوصول البطاقات البالغ عددها 81 في هذه المجموعة.
فتح الحزمة
k this deck
22
In performing a chi-square goodness-of-fit test for a normal distribution,if there are 7 intervals,then the number of degrees of freedom for the chi-square statistic is ______.
A) 7
B) 3
C) 4
D) 6
A) 7
B) 3
C) 4
D) 6
فتح الحزمة
افتح القفل للوصول البطاقات البالغ عددها 81 في هذه المجموعة.
فتح الحزمة
k this deck
23
A special version of the chi-square goodness-of-fit test that involves testing the null hypothesis that all of the multinomial probabilities are equal is called the test for ___________.
A) goodness of fit
B) statistical independence
C) normality
D) homogeneity
A) goodness of fit
B) statistical independence
C) normality
D) homogeneity
فتح الحزمة
افتح القفل للوصول البطاقات البالغ عددها 81 في هذه المجموعة.
فتح الحزمة
k this deck
24
When we carry out a goodness-of-fit chi-square test,the expected frequencies are based on the alternative hypothesis.
فتح الحزمة
افتح القفل للوصول البطاقات البالغ عددها 81 في هذه المجموعة.
فتح الحزمة
k this deck
25
While a binomial distribution describes count data that can be classified into one of two mutually exclusive categories,a __________________ distribution describes count data that are classified into more than two mutually exclusive categories.
A) normal
B) skewed
C) uniform
D) multinomial
A) normal
B) skewed
C) uniform
D) multinomial
فتح الحزمة
افتح القفل للوصول البطاقات البالغ عددها 81 في هذه المجموعة.
فتح الحزمة
k this deck
26
In performing a chi-square goodness-of-fit test for a normal distribution,a researcher wants to make sure that all of the expected cell frequencies are at least five.The sample is divided into 7 intervals.The second through the sixth intervals all have expected cell frequencies of at least five.The first and the last intervals have expected cell frequencies of 1.5 each.After adjusting the number of intervals,the degrees of freedom for the chi-square statistic is ____.
A) 2
B) 3
C) 5
D) 7
A) 2
B) 3
C) 5
D) 7
فتح الحزمة
افتح القفل للوصول البطاقات البالغ عددها 81 في هذه المجموعة.
فتح الحزمة
k this deck
27
The chi-square goodness-of-fit test will be valid if the average of the expected cell frequencies is ______________.
A) greater than 0
B) less than 5
C) between 0 and 5
D) at least 1
E) at least 5
A) greater than 0
B) less than 5
C) between 0 and 5
D) at least 1
E) at least 5
فتح الحزمة
افتح القفل للوصول البطاقات البالغ عددها 81 في هذه المجموعة.
فتح الحزمة
k this deck
28
Which,if any,of the following statements about the chi-square test of independence is false?
A) If ri is the row total for row i and cj is the column total for column j,then the estimated expected cell frequency corresponding to row i and column j equals (ri)(cj)/n.
B) The test is valid if all of the estimated cell frequencies are at least five.
C) The chi-square statistic is based on (r − 1)(c − 1)degrees of freedom,where r and c denote,respectively,the number of rows and columns in the contingency table.
D) The alternative hypothesis states that the two classifications are statistically independent.
E) All of the other statements about the chi-square test of independence are true.
فتح الحزمة
افتح القفل للوصول البطاقات البالغ عددها 81 في هذه المجموعة.
فتح الحزمة
k this deck
29
In performing a chi-square goodness-of-fit test with multinomial probabilities,the ___________ the difference between observed and expected frequencies,the higher the probability of concluding that the probabilities specified in the null hypothesis are correct.
A) larger
B) smaller
A) larger
B) smaller
فتح الحزمة
افتح القفل للوصول البطاقات البالغ عددها 81 في هذه المجموعة.
فتح الحزمة
k this deck
30
As the difference between observed frequency and expected frequency _______________,the probability of rejecting the null hypothesis increases.
A) stays the same
B) decreases
C) increases
D) goes to 0
A) stays the same
B) decreases
C) increases
D) goes to 0
فتح الحزمة
افتح القفل للوصول البطاقات البالغ عددها 81 في هذه المجموعة.
فتح الحزمة
k this deck
31
A manufacturing company produces part QV2Y for the aerospace industry.This particular part can be manufactured using 3 different production processes.The management wants to know if the quality of the units of part QV2Y is the same for all three processes.The production supervisor obtained the following data: Process 1 had 29 defective units in 240 items,Process 2 produced 12 defective units in 180 items,and Process 3 manufactured 9 defective units in 150 items.At a significance level of .05,we performed a chi-square test to determine whether the quality of the items produced appears to be the same for all three processes.What is the null hypothesis?
A) H0: The number of defectives produced is independent of the production process used.
B) H0: The row and column variables are associated with each other.
C) H0: The proportion of defective units produced by the three production processes is the same.
D) Both "H0: The number of defectives produced is independent of the production process used." and "H0: The proportion of defective units produced by the three production processes is the same." are correct or at least acceptable ways of stating the null hypothesis.
E) All of the other choices are acceptable ways of stating the null hypothesis.
فتح الحزمة
افتح القفل للوصول البطاقات البالغ عددها 81 في هذه المجموعة.
فتح الحزمة
k this deck
32
A manufacturing company produces part QV2Y for the aerospace industry.This particular part can be manufactured using 3 different production processes.The management wants to know if the quality of the units of part QV2Y is the same for all three processes.The production supervisor obtained the following data: Process 1 had 29 defective units in 240 items,Process 2 produced 12 defective units in 180 items,and Process 3 manufactured 9 defective units in 150 items.At a significance level of .05,we performed a chi-square test of independence to determine if the quality of the items produced appears to be independent of the production process.What are the degrees of freedom for the chi-square statistic?
A) 2
B) 3
C) 50
D) 520
E) 570
A) 2
B) 3
C) 50
D) 520
E) 570
فتح الحزمة
افتح القفل للوصول البطاقات البالغ عددها 81 في هذه المجموعة.
فتح الحزمة
k this deck
33
When we carry out a chi-square goodness-of-fit test for a normal distribution,the null hypothesis states that the population
A) does not have a normal distribution.
B) has a normal distribution.
C) has a chi-square distribution.
D) does not have a chi-square distribution.
E) has k − 3 degrees of freedom.
A) does not have a normal distribution.
B) has a normal distribution.
C) has a chi-square distribution.
D) does not have a chi-square distribution.
E) has k − 3 degrees of freedom.
فتح الحزمة
افتح القفل للوصول البطاقات البالغ عددها 81 في هذه المجموعة.
فتح الحزمة
k this deck
34
An experiment consists of 400 observations and four mutually exclusive groups.If the probability of a randomly selected item being classified into any of the four groups is equal,then the expected number of items that will be classified into group 1 is _____.
A) 25
B) 100
C) 125
D) 150
A) 25
B) 100
C) 125
D) 150
فتح الحزمة
افتح القفل للوصول البطاقات البالغ عددها 81 في هذه المجموعة.
فتح الحزمة
k this deck
35
A manufacturing company produces part QV2Y for the aerospace industry.This particular part can be manufactured using 3 different production processes.The management wants to know if the quality of the units of part QV2Y is the same for all three processes.The production supervisor obtained the following data: Process 1 had 29 defective units in 240 items,Process 2 produced 12 defective units in 180 items,and Process 3 manufactured 9 defective units in 150 items.At a significance level of .05,the management wants to perform a hypothesis test to determine whether the quality of items produced appears to be independent of the production process used.What is the rejection point condition?
A) Reject H0 if χ2 > .10257
B) Reject H0 if χ2 > 9.3484
C) Reject H0 if χ2 > 5.99147
D) Reject H0 if χ2 > 7.37776
E) Reject H0 if χ2 > 7.81473
A) Reject H0 if χ2 > .10257
B) Reject H0 if χ2 > 9.3484
C) Reject H0 if χ2 > 5.99147
D) Reject H0 if χ2 > 7.37776
E) Reject H0 if χ2 > 7.81473
فتح الحزمة
افتح القفل للوصول البطاقات البالغ عددها 81 في هذه المجموعة.
فتح الحزمة
k this deck
36
The chi-square goodness-of-fit test for multinomial probabilities with 5 categories has _____ degrees of freedom.
A) 5
B) 4
C) 3
D) 6
A) 5
B) 4
C) 3
D) 6
فتح الحزمة
افتح القفل للوصول البطاقات البالغ عددها 81 في هذه المجموعة.
فتح الحزمة
k this deck
37
The χ2 statistic from a contingency table with 6 rows and 5 columns will have
A) 30 degrees of freedom.
B) 24 degrees of freedom.
C) 5 degrees of freedom.
D) 20 degrees of freedom.
E) 25 degrees of freedom.
A) 30 degrees of freedom.
B) 24 degrees of freedom.
C) 5 degrees of freedom.
D) 20 degrees of freedom.
E) 25 degrees of freedom.
فتح الحزمة
افتح القفل للوصول البطاقات البالغ عددها 81 في هذه المجموعة.
فتح الحزمة
k this deck
38
In performing a chi-square test of independence,as the differences between respective observed and expected frequencies _________,the probability of concluding that the row variable is independent of the column variable increases.
A) stay the same
B) decrease
C) increase
D) double
A) stay the same
B) decrease
C) increase
D) double
فتح الحزمة
افتح القفل للوصول البطاقات البالغ عددها 81 في هذه المجموعة.
فتح الحزمة
k this deck
39
When we carry out a chi-square test of independence,the alternate hypothesis states that the two relevant classifications
A) are mutually exclusive.
B) form a contingency table with r rows and c columns.
C) have (r − 1)(c − 1)degrees of freedom.
D) are statistically dependent.
E) are normally distributed.
A) are mutually exclusive.
B) form a contingency table with r rows and c columns.
C) have (r − 1)(c − 1)degrees of freedom.
D) are statistically dependent.
E) are normally distributed.
فتح الحزمة
افتح القفل للوصول البطاقات البالغ عددها 81 في هذه المجموعة.
فتح الحزمة
k this deck
40
The number of degrees of freedom associated with a chi-square test for independence based upon a contingency table with 4 rows and 3 columns is _____.
A) 7
B) 12
C) 5
D) 6
A) 7
B) 12
C) 5
D) 6
فتح الحزمة
افتح القفل للوصول البطاقات البالغ عددها 81 في هذه المجموعة.
فتح الحزمة
k this deck
41
A manufacturing company produces part QV2Y for the aerospace industry.This particular part can be manufactured using 3 different production processes.The management wants to know if the quality of the units of part QV2Y is the same for all three processes.The production supervisor obtained the following data: Process 1 had 29 defective units in 240 items,Process 2 produced 12 defective units in 180 items,and Process 3 manufactured 9 defective units in 150 items.Chi-Square Contingency Table Test for Independence At a significance level of .10,the management wants to perform a hypothesis test to determine if the quality of the items produced appears to be independent of the production process used.Based on the results summarized in the MegaStat/Excel output provided in the table above,we
A) do not reject H0 and conclude that the quality of the product is not the same for all processes.
B) reject H0 and conclude that the quality of the product is dependent on the manufacturing process.
C) do not reject H0,and conclude that the quality of the product does not significantly differ among the three processes.
D) reject H0 and conclude that the quality of the product is independent of the production process utilized.
At a significance level of .10,the management wants to perform a hypothesis test to determine if the quality of the items produced appears to be independent of the production process used.Based on the results summarized in the MegaStat/Excel output provided in the table above,weA) do not reject H0 and conclude that the quality of the product is not the same for all processes.
B) reject H0 and conclude that the quality of the product is dependent on the manufacturing process.
C) do not reject H0,and conclude that the quality of the product does not significantly differ among the three processes.
D) reject H0 and conclude that the quality of the product is independent of the production process utilized.
فتح الحزمة
افتح القفل للوصول البطاقات البالغ عددها 81 في هذه المجموعة.
فتح الحزمة
k this deck
42
A study of car accidents and drivers who use cell phones collects the following sample data. Determine the expected frequencies of those who had accidents in the last year to use for the chi-square test of independence.
Determine the expected frequencies of those who had accidents in the last year to use for the chi-square test of independence. فتح الحزمة
افتح القفل للوصول البطاقات البالغ عددها 81 في هذه المجموعة.
فتح الحزمة
k this deck
43
A paper presented at a recent meeting of higher education researchers compared the type of college freshmen attend and the numbers who drop out.A random sample of freshmen shows the following results. Calculate the chi-square statistic for this test of independence.
Calculate the chi-square statistic for this test of independence. فتح الحزمة
افتح القفل للوصول البطاقات البالغ عددها 81 في هذه المجموعة.
فتح الحزمة
k this deck
44
A manufacturing company produces part QV2Y for the aerospace industry.This particular part can be manufactured using 3 different production processes.The management wants to know if the quality of the units of part QV2Y is the same for all three processes.The production supervisor obtained the following data: Process 1 had 29 defective units in 240 items,Process 2 produced 12 defective units in 180 items,and Process 3 manufactured 9 defective units in 150 items.At a significance level of .05,the management wants to perform a hypothesis test to determine whether the quality of items produced appears to be independent of the production process used.Calculate the expected number of defective units produced by Process 1.
فتح الحزمة
افتح القفل للوصول البطاقات البالغ عددها 81 في هذه المجموعة.
فتح الحزمة
k this deck
45
A study of car accidents and drivers who use cell phones collects the following sample data. At a significance level of 0.05,determine the appropriate degrees of freedom and the rejection point condition for the test.
At a significance level of 0.05,determine the appropriate degrees of freedom and the rejection point condition for the test. فتح الحزمة
افتح القفل للوصول البطاقات البالغ عددها 81 في هذه المجموعة.
فتح الحزمة
k this deck
46
A real estate company is analyzing the selling prices of residential homes in a given community.140 homes that have been sold in the past month are randomly selected and their selling prices are recorded.The statistician working on the project has stated that in order to perform various statistical tests,the data must be distributed according to a normal distribution.In order to determine whether the selling prices of homes included in the random sample are normally distributed,the statistician divides the data into 6 classes of equal size and records the number of observations in each class.She then performs a chi-square goodness-of-fit test for normal distribution.The results are summarized in the following table. At a significance level of .05,we
A) reject H0;conclude that the residential home selling prices are not distributed according to a normal distribution.
B) do not reject H0;conclude that the residential home selling prices are not distributed according to a normal distribution.
C) reject H0;conclude that the residential home selling prices are distributed according to a normal distribution.
D) do not reject H0;conclude that the residential home selling prices are distributed according to a normal distribution.
At a significance level of .05,weA) reject H0;conclude that the residential home selling prices are not distributed according to a normal distribution.
B) do not reject H0;conclude that the residential home selling prices are not distributed according to a normal distribution.
C) reject H0;conclude that the residential home selling prices are distributed according to a normal distribution.
D) do not reject H0;conclude that the residential home selling prices are distributed according to a normal distribution.
فتح الحزمة
افتح القفل للوصول البطاقات البالغ عددها 81 في هذه المجموعة.
فتح الحزمة
k this deck
47
A study of car accidents and drivers who use cell phones collects the following sample data. Determine the expected frequencies of those who had accidents in the last year to use for the chi-square test of independence.
Determine the expected frequencies of those who had accidents in the last year to use for the chi-square test of independence. فتح الحزمة
افتح القفل للوصول البطاقات البالغ عددها 81 في هذه المجموعة.
فتح الحزمة
k this deck
48
A real estate company is analyzing the selling prices of residential homes in a given community.140 homes that have been sold in the past month are randomly selected and their selling prices are recorded.The statistician working on the project has stated that in order to perform various statistical tests,the data must be distributed according to a normal distribution.In order to determine whether the selling prices of homes included in the random sample are normally distributed,the statistician divides the data into 6 classes of equal size and records the number of observations in each class.She then performs a chi-square goodness-of-fit test for normal distribution.The results are summarized in the following table. What is the appropriate null hypothesis?
A) H0: The residential home selling prices are distributed according to a normal distribution.
B) H0: The residential home selling prices are not distributed according to a normal distribution.
C) H0: The distribution of residential home selling prices is either right or left skewed.
D) H0: The distribution of the residential home selling prices is symmetric.
E) None of the other answers is correct.
What is the appropriate null hypothesis?A) H0: The residential home selling prices are distributed according to a normal distribution.
B) H0: The residential home selling prices are not distributed according to a normal distribution.
C) H0: The distribution of residential home selling prices is either right or left skewed.
D) H0: The distribution of the residential home selling prices is symmetric.
E) None of the other answers is correct.
فتح الحزمة
افتح القفل للوصول البطاقات البالغ عددها 81 في هذه المجموعة.
فتح الحزمة
k this deck
49
A study of car accidents and drivers who use cell phones collects the following sample data. Calculate the chi-square statistic for this test of independence.
Calculate the chi-square statistic for this test of independence. فتح الحزمة
افتح القفل للوصول البطاقات البالغ عددها 81 في هذه المجموعة.
فتح الحزمة
k this deck
50
A real estate company is analyzing the selling prices of residential homes in a given community.140 homes that have been sold in the past month are randomly selected and their selling prices are recorded.The statistician working on the project has stated that in order to perform various statistical tests,the data must be distributed according to a normal distribution.In order to determine whether the selling prices of homes included in the random sample are normally distributed,the statistician divides the data into 6 classes of equal size and records the number of observations in each class.She then performs a chi-square goodness-of-fit test for normal distribution.The results are summarized in the following table. At a significance level of .05,what is the appropriate rejection point condition?
A) Reject H0 if χ2 > 12.5916
B) Reject H0 if χ2 > 11.0705
C) Reject H0 if χ2 > 9.3484
D) Reject H0 if χ2 > 7.81473
E) Reject H0 if χ2 > 9.48773
At a significance level of .05,what is the appropriate rejection point condition?A) Reject H0 if χ2 > 12.5916
B) Reject H0 if χ2 > 11.0705
C) Reject H0 if χ2 > 9.3484
D) Reject H0 if χ2 > 7.81473
E) Reject H0 if χ2 > 9.48773
فتح الحزمة
افتح القفل للوصول البطاقات البالغ عددها 81 في هذه المجموعة.
فتح الحزمة
k this deck
51
Consider the 3 × 2 contingency table below. Compute the expected frequencies in row 1.
Compute the expected frequencies in row 1. فتح الحزمة
افتح القفل للوصول البطاقات البالغ عددها 81 في هذه المجموعة.
فتح الحزمة
k this deck
52
A real estate company is analyzing the selling prices of residential homes in a given community.140 homes that have been sold in the past month are randomly selected and their selling prices are recorded.The statistician working on the project has stated that in order to perform various statistical tests,the data must be distributed according to a normal distribution.In order to determine whether the selling prices of homes included in the random sample are normally distributed,the statistician divides the data into 6 classes of equal size and records the number of observations in each class.She then performs a chi-square goodness-of-fit test for normal distribution.The results are summarized in the following table What are the degrees of freedom for the chi-square test?
A) 2
B) 3
C) 4
D) 5
E) 6
What are the degrees of freedom for the chi-square test?A) 2
B) 3
C) 4
D) 5
E) 6
فتح الحزمة
افتح القفل للوصول البطاقات البالغ عددها 81 في هذه المجموعة.
فتح الحزمة
k this deck
53
Consider the 3 × 2 contingency table below. Compute the expected frequencies in row 3.
Compute the expected frequencies in row 3. فتح الحزمة
افتح القفل للوصول البطاقات البالغ عددها 81 في هذه المجموعة.
فتح الحزمة
k this deck
54
Consider the 3 × 2 contingency table below. Compute the expected frequencies in row 2.
Compute the expected frequencies in row 2. فتح الحزمة
افتح القفل للوصول البطاقات البالغ عددها 81 في هذه المجموعة.
فتح الحزمة
k this deck
55
A paper presented at a recent meeting of higher education researchers compared the type of college that freshmen attend and the numbers who drop out.A random sample of freshmen shows the following results. Determine the expected frequencies for the freshmen who drop out of 2-year institutions that will be used in the chi-square test of independence.
Determine the expected frequencies for the freshmen who drop out of 2-year institutions that will be used in the chi-square test of independence. فتح الحزمة
افتح القفل للوصول البطاقات البالغ عددها 81 في هذه المجموعة.
فتح الحزمة
k this deck
56
A paper presented at a recent meeting of higher education researchers compared the type of college that freshmen attend and the numbers who drop out.A random sample of freshmen shows the following results. At a significance level of .05,determine the appropriate degrees of freedom and the rejection point condition for this test.
At a significance level of .05,determine the appropriate degrees of freedom and the rejection point condition for this test. فتح الحزمة
افتح القفل للوصول البطاقات البالغ عددها 81 في هذه المجموعة.
فتح الحزمة
k this deck
57
A paper presented at a recent meeting of higher education researchers compared the type of college that freshmen attend and the numbers who drop out.A random sample of freshmen shows the following results. Determine the expected frequencies for the two cells of 4-year public institutions that will be used in the chi-square test of independence.
Determine the expected frequencies for the two cells of 4-year public institutions that will be used in the chi-square test of independence. فتح الحزمة
افتح القفل للوصول البطاقات البالغ عددها 81 في هذه المجموعة.
فتح الحزمة
k this deck
58
A manufacturing company produces part QV2Y for the aerospace industry.This particular part can be manufactured using 3 different production processes.The management wants to know if the quality of the units of part QV2Y is the same for all three processes.The production supervisor obtained the following data: Process 1 had 29 defective units in 240 items,Process 2 produced 12 defective units in 180 items,and Process 3 manufactured 9 defective units in 150 items.Chi-Square Contingency Table Test for Independence At a significance level of .05,the management wants to perform a hypothesis test to determine if the quality of the items produced appears to be independent of the production process used.Based on the results summarized in the MegaStat/Excel output provided in the table above,we
A) reject H0 and conclude that the quality of the product is not the same for all processes.
B) reject H0 and conclude that the quality of the product is dependent on the manufacturing process.
C) do not reject H0,and conclude that the quality of the product does not significantly differ among the three processes.
D) do not reject H0,and conclude that the quality of the product is not the same for all processes.
E) reject H0 and conclude that the quality of the product is independent of the manufacturing process used.
At a significance level of .05,the management wants to perform a hypothesis test to determine if the quality of the items produced appears to be independent of the production process used.Based on the results summarized in the MegaStat/Excel output provided in the table above,weA) reject H0 and conclude that the quality of the product is not the same for all processes.
B) reject H0 and conclude that the quality of the product is dependent on the manufacturing process.
C) do not reject H0,and conclude that the quality of the product does not significantly differ among the three processes.
D) do not reject H0,and conclude that the quality of the product is not the same for all processes.
E) reject H0 and conclude that the quality of the product is independent of the manufacturing process used.
فتح الحزمة
افتح القفل للوصول البطاقات البالغ عددها 81 في هذه المجموعة.
فتح الحزمة
k this deck
59
A paper presented at a recent meeting of higher education researchers compared the type of college freshmen attend and the numbers who drop out.A random sample of freshmen shows the following results. Use a significance level of .05 and determine if the type of school and the drop rate are independent.(Null hypothesis is that dropout rate is independent of type of school. )
Use a significance level of .05 and determine if the type of school and the drop rate are independent.(Null hypothesis is that dropout rate is independent of type of school. ) فتح الحزمة
افتح القفل للوصول البطاقات البالغ عددها 81 في هذه المجموعة.
فتح الحزمة
k this deck
60
Consider the 3 × 2 contingency table below. How many degrees of freedom are associated with the chi-square test?
How many degrees of freedom are associated with the chi-square test? فتح الحزمة
افتح القفل للوصول البطاقات البالغ عددها 81 في هذه المجموعة.
فتح الحزمة
k this deck
61
The AAA Co.is interested in the level of satisfaction of their employees in the benefit package that they offer compared to their major competitors.A consultant hired to conduct the satisfaction survey told AAA Co.that the distribution of level of satisfaction at other companies is displayed below.Very Satisfied
A survey was conducted of 125 AAA employees with the following results.
Using the critical value for α = .05,test the null hypothesis that the distribution of AAA employees at each satisfaction level is similar to the distribution of the employees of their major competitors.
A survey was conducted of 125 AAA employees with the following results.
Using the critical value for α = .05,test the null hypothesis that the distribution of AAA employees at each satisfaction level is similar to the distribution of the employees of their major competitors.
فتح الحزمة
افتح القفل للوصول البطاقات البالغ عددها 81 في هذه المجموعة.
فتح الحزمة
k this deck
62
A survey was conducted on the age and gender of the purchasers of a specific automotive model.The results are below.
Test the null hypothesis that age is independent of gender at α = .05.
Test the null hypothesis that age is independent of gender at α = .05.
فتح الحزمة
افتح القفل للوصول البطاقات البالغ عددها 81 في هذه المجموعة.
فتح الحزمة
k this deck
63
AAA Co.operates distribution centers in the Midwest.Three of their centers were recently audited to determine if they are in compliance with company standard billing procedures.According to the auditing firm,a billing had an equal probability of being from each of the three centers.A random sample of the audited billings had the following distribution.Center 1: 385 billings
Center 2: 305 billings
Center 3: 210 billings
What is the critical value at α = .01 to test the null hypothesis (equal billings from each center)?
Center 2: 305 billings
Center 3: 210 billings
What is the critical value at α = .01 to test the null hypothesis (equal billings from each center)?
فتح الحزمة
افتح القفل للوصول البطاقات البالغ عددها 81 في هذه المجموعة.
فتح الحزمة
k this deck
64
The AAA Co.is interested in the level of satisfaction of their employees with the benefit package that they offer compared to their major competitors.A consultant hired to conduct the satisfaction survey told AAA Co.that the distribution of level of satisfaction at other companies is displayed below.Very Satisfied
A survey of 125 AAA employees gave the following results.
What are the degrees of freedom for testing the goodness of fit at α = .05?
A survey of 125 AAA employees gave the following results.
What are the degrees of freedom for testing the goodness of fit at α = .05?
فتح الحزمة
افتح القفل للوصول البطاقات البالغ عددها 81 في هذه المجموعة.
فتح الحزمة
k this deck
65
The HR manager of a major office supply chain is interested in determining whether employee educational level affects knowledge of their job.An exam was given to 120 employees.The results are below. For each cell,calculate the corresponding cell,row,and column percentage.
For each cell,calculate the corresponding cell,row,and column percentage. فتح الحزمة
افتح القفل للوصول البطاقات البالغ عددها 81 في هذه المجموعة.
فتح الحزمة
k this deck
66
The distance (in thousands of miles)traveled by buses before their first major motor failure is distributed below,with an estimated mean and standard deviation of 95.7 and 38.1.Also shown are the expected frequencies of these intervals if the original population was a normal distribution. What is the df for testing the hypothesis that the original population is a normal distribution?
What is the df for testing the hypothesis that the original population is a normal distribution? فتح الحزمة
افتح القفل للوصول البطاقات البالغ عددها 81 في هذه المجموعة.
فتح الحزمة
k this deck
67
The HR manager of a major office supply chain is interested in determining whether employee educational level affects knowledge of their job.An exam was given to 120 employees.The results are below. For each row total,calculate the corresponding percentage.
For each row total,calculate the corresponding percentage. فتح الحزمة
افتح القفل للوصول البطاقات البالغ عددها 81 في هذه المجموعة.
فتح الحزمة
k this deck
68
The following frequency table summarizes the ages of 60 shoppers at the local farmer's market. The estimated mean is 36.25,and the estimated standard deviation is 13.57.Calculate the expected frequencies for each interval,assuming a normal distribution.
The estimated mean is 36.25,and the estimated standard deviation is 13.57.Calculate the expected frequencies for each interval,assuming a normal distribution. فتح الحزمة
افتح القفل للوصول البطاقات البالغ عددها 81 في هذه المجموعة.
فتح الحزمة
k this deck
69
AAA Co.operates distribution centers in the Midwest.Three of their centers were recently audited to determine if they are in compliance with company standard billing procedures.According to the auditing firm,a billing had an equal probability of being from each of the three centers.A random sample of the audited billings had the following distribution.Center 1: 385 billings
Center 2: 305 billings
Center 3: 210 billings
What are the degrees of freedom for the χ2 test?
Center 2: 305 billings
Center 3: 210 billings
What are the degrees of freedom for the χ2 test?
فتح الحزمة
افتح القفل للوصول البطاقات البالغ عددها 81 في هذه المجموعة.
فتح الحزمة
k this deck
70
The following frequency table summarizes the ages of 60 shoppers at the local farmer's market. The estimated mean is 36.25,and the estimated standard deviation is 13.57.Calculate the value of the chi-square test statistic to determine whether these measurements came from a normal population. χ2 = (10 − .24)2/.24 + (21 − 22.458)2/22.458 + (10 − 15.51)2/15.51 + (8 − 12.27)2/12.27
+ (5 − 6.732)2/6.732 + (6 − 2.79)2/2.79 = 404.58
The estimated mean is 36.25,and the estimated standard deviation is 13.57.Calculate the value of the chi-square test statistic to determine whether these measurements came from a normal population. χ2 = (10 − .24)2/.24 + (21 − 22.458)2/22.458 + (10 − 15.51)2/15.51 + (8 − 12.27)2/12.27+ (5 − 6.732)2/6.732 + (6 − 2.79)2/2.79 = 404.58
فتح الحزمة
افتح القفل للوصول البطاقات البالغ عددها 81 في هذه المجموعة.
فتح الحزمة
k this deck
71
AAA Co.operates distribution centers in the Midwest.Three of their centers were recently audited to determine if they are in compliance with company standard billing procedures.According to the auditing firm,a billing had an equal probability of being from each of the three centers.A random sample of the audited billings had the following distribution.Center 1: 385 billings
Center 2: 305 billings
Center 3: 210 billings
What is the expected value of the number of billings for each center if H0 (equal probabilities)is true?
Center 2: 305 billings
Center 3: 210 billings
What is the expected value of the number of billings for each center if H0 (equal probabilities)is true?
فتح الحزمة
افتح القفل للوصول البطاقات البالغ عددها 81 في هذه المجموعة.
فتح الحزمة
k this deck
72
A survey was conducted on the age and gender of the purchasers of a specific automotive model.The results are below.
For each column total,calculate the corresponding percentage.
For each column total,calculate the corresponding percentage.
فتح الحزمة
افتح القفل للوصول البطاقات البالغ عددها 81 في هذه المجموعة.
فتح الحزمة
k this deck
73
A survey was conducted on the age and gender of the purchasers of a specific automotive model.The results are below.
For each row total,calculate the corresponding percentage.
For each row total,calculate the corresponding percentage.
فتح الحزمة
افتح القفل للوصول البطاقات البالغ عددها 81 في هذه المجموعة.
فتح الحزمة
k this deck
74
The HR manager of a major office supply chain is interested in determining whether employee educational level affects knowledge of their job.An exam was given to 120 employees.The results are below. For each column total,calculate the corresponding percentage.
For each column total,calculate the corresponding percentage. فتح الحزمة
افتح القفل للوصول البطاقات البالغ عددها 81 في هذه المجموعة.
فتح الحزمة
k this deck
75
A survey was conducted on the age and gender of the purchasers of a specific automotive model.The results are below.
For each cell,calculate the corresponding cell,row,and column percentage.
For each cell,calculate the corresponding cell,row,and column percentage.
فتح الحزمة
افتح القفل للوصول البطاقات البالغ عددها 81 في هذه المجموعة.
فتح الحزمة
k this deck
76
A manufacturing company produces part QV2Y for the aerospace industry.This particular part can be manufactured using 3 different production processes.The management wants to know if the quality of the units of part QV2Y is the same for all three processes.The production supervisor obtained the following data: Process 1 had 29 defective units in 240 items,Process 2 produced 12 defective units in 180 items,and Process 3 manufactured 9 defective units in 150 items.At a significance level of .05,the management wants to perform a hypothesis test to determine whether the quality of items produced appears to be independent of the production process used.Calculate the expected number of conforming units produced by Process 2.
فتح الحزمة
افتح القفل للوصول البطاقات البالغ عددها 81 في هذه المجموعة.
فتح الحزمة
k this deck
77
The HR manager of a major office supply chain is interested in determining whether employee educational level affects knowledge of their job.An exam was given to 120 employees.The results are below. Test the null hypothesis that score is independent of education level at α = .01.
Test the null hypothesis that score is independent of education level at α = .01. فتح الحزمة
افتح القفل للوصول البطاقات البالغ عددها 81 في هذه المجموعة.
فتح الحزمة
k this deck
78
The following frequency table summarizes the ages of 60 shoppers at the local farmer's market. The estimated mean is 36.25,and estimated standard deviation is 13.57.Calculate the probability for each interval,assuming a normal distribution.
The estimated mean is 36.25,and estimated standard deviation is 13.57.Calculate the probability for each interval,assuming a normal distribution. فتح الحزمة
افتح القفل للوصول البطاقات البالغ عددها 81 في هذه المجموعة.
فتح الحزمة
k this deck
79
The following frequency table summarizes the ages of 60 shoppers at the local farmer's market The estimated mean is 36.25,and the estimated standard deviation is 13.57.It is desired to test whether these measurements came from a normal population.What is the df for this chi-square test of normality?
The estimated mean is 36.25,and the estimated standard deviation is 13.57.It is desired to test whether these measurements came from a normal population.What is the df for this chi-square test of normality? فتح الحزمة
افتح القفل للوصول البطاقات البالغ عددها 81 في هذه المجموعة.
فتح الحزمة
k this deck
80
AAA Co.operates distribution centers in the Midwest.Three of their centers were recently audited to determine if they are in compliance with company standard billing procedures.According to the auditing firm,a billing had an equal probability of being from each of the three centers.A random sample of the audited billings had the following distribution.Center 1: 385 billings
Center 2: 305 billings
Center 3: 210 billings
State the null hypothesis that states the expectations of the auditors.
Center 2: 305 billings
Center 3: 210 billings
State the null hypothesis that states the expectations of the auditors.
فتح الحزمة
افتح القفل للوصول البطاقات البالغ عددها 81 في هذه المجموعة.
فتح الحزمة
k this deck
فتح الحزمة
افتح القفل للوصول البطاقات البالغ عددها 81 في هذه المجموعة.


