Deck 11: Statistical Inference Concerning Variance
ملء الشاشة (f)
سؤال
If a sample of size n is taken from a normal population with a finite variance,then the statistic 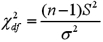 follows the
  distribution with degrees of freedom ____.
A)(n + 1)(n - 1)
B)n + 1
C)n - 1
D)n
follows the distribution with degrees of freedom ____.A)(n + 1)(n - 1)
B)n + 1
C)n - 1
D)n
سؤال
سؤال
سؤال
A right-tailed test for the ratio of two population variances  examines whether
  is greater than
  .
.
examines whether is greater than . سؤال
The value of the test statistic to test the ratio of two population variances is  .
.
. سؤال
A  distribution tends to the ____,as the degrees of freedom increase.
A)F distribution
B)Uniform distribution
C)Student's t distribution
D)Normal distribution
distribution tends to the ____,as the degrees of freedom increase.A)F distribution
B)Uniform distribution
C)Student's t distribution
D)Normal distribution
سؤال
The sampling distribution of  is the χ2 distribution.
is the χ2 distribution. سؤال
The  distribution is positively skewed.
distribution is positively skewed. سؤال
Which of the following is the formula for the sample variance s2 when used as an estimate of σ2 for a random sample of n observations from a population?
A)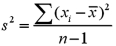
B)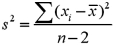
C)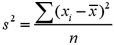
D)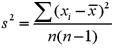
A)
B)
C)
D)
سؤال
سؤال
The null hypothesis  is rejected if the value of the test statistic exceeds
  .
.
is rejected if the value of the test statistic exceeds . سؤال
سؤال
If s2 is computed from a random sample of n observations drawn from an underlying normal population with a finite variance,then the  variable is defined as ____.
A)
B)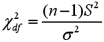
C)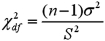
D)
variable is defined as ____.A)
B)
C)
D)
سؤال
The _____ is the probability distribution of the sum of several independent squared standard normal random variables.
A)F distribution
B) distribution
C)Student's t distribution
D)Uniform distribution
A)F distribution
B)
distributionC)Student's t distribution
D)Uniform distribution
سؤال
The parameter of interest for inferences regarding the ratio of two population variances is their sum  .
.
. سؤال
The estimator of  used in the inference regarding the ratio of two population variances is
  .
.
used in the inference regarding the ratio of two population variances is . سؤال
It is preferable to place the smaller sample variance in the numerator of the  statistic.
statistic. سؤال
سؤال
The value of the test statistic for the hypothesis test of the population variance,σ2 is computed as 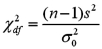 .
.
. سؤال
The values of the  distribution range from negative infinity to infinity.
distribution range from negative infinity to infinity. سؤال
Exhibit 11-1.Becky owns a diner and is concerned about sustaining the business.She wants to ascertain if the standard deviation of the profits for each week is greater than $250.The details of the profits for the week are listed below (in dollars. )Assume that profits are normally distributed.  Refer to Exhibit 11-1.The appropriate null and alternate hypotheses are:
A)
B)
C)
D)
Refer to Exhibit 11-1.The appropriate null and alternate hypotheses are:A)
B)
C)
D)
سؤال
سؤال
سؤال
سؤال
سؤال
سؤال
Find the value of x for which  = 0.05.
A)20.483
B)18.307
C)15.987
D)4.1680
= 0.05.A)20.483
B)18.307
C)15.987
D)4.1680
سؤال
You want to test whether the population variance differs from 50.From a sample of 25 observations drawn from a normally distributed population,you calculate s2 = 80.When conducting this test at the 5% significance level,the value of test statistic,  is:
is:
A)5.625
B)12.401
C)14.400
D)39.364
is:A)5.625
B)12.401
C)14.400
D)39.364
سؤال
Exhibit 11-1.Becky owns a diner and is concerned about sustaining the business.She wants to ascertain if the standard deviation of the profits for each week is greater than $250.The details of the profits for the week are listed below (in dollars. )Assume that profits are normally distributed.  Refer to Exhibit 11-1.What is the value of the test statistic?
A)6.146
B)8.604
C)6.652
D)7.375
Refer to Exhibit 11-1.What is the value of the test statistic?A)6.146
B)8.604
C)6.652
D)7.375
سؤال
If P(  ≥ x)= 0.05,then the value of x is ____.
A)14.449
B)10.645
C)12.592
D)1.6350
≥ x)= 0.05,then the value of x is ____.A)14.449
B)10.645
C)12.592
D)1.6350
سؤال
We conduct the following hypothesis test:  versus
  .For a random sample of 15 observations,the sample standard deviation is 12.Approximate the p-value used to conduct this test.
A)p-value lies between 0.025 and 0.05
B)p-value lies between 0.01 and 0.025
C)p-value lies between 0.05 and 0.10
D)p-value is greater than 0.10
versus .For a random sample of 15 observations,the sample standard deviation is 12.Approximate the p-value used to conduct this test.A)p-value lies between 0.025 and 0.05
B)p-value lies between 0.01 and 0.025
C)p-value lies between 0.05 and 0.10
D)p-value is greater than 0.10
سؤال
Identify the hypothesis that depicts a right-tailed test for the population variance from the list of hypotheses given below.
A)
B)
C)
D)
A)
B)
C)
D)
سؤال
سؤال
سؤال
Exhibit 11-1.Becky owns a diner and is concerned about sustaining the business.She wants to ascertain if the standard deviation of the profits for each week is greater than $250.The details of the profits for the week are listed below (in dollars. )Assume that profits are normally distributed.  Refer to Exhibit 11-1.Test Becky's concern using the critical value approach at α = 0.05.What is the result?
A)We reject H0 since the value of the test statistic is greater than .
.
B)We do not reject H0 since the value of the test statistic is greater than .
.
C)We reject H0 since the value of the test statistic is less than .
.
D)We do not reject H0 since the value of the test statistic is less than
Refer to Exhibit 11-1.Test Becky's concern using the critical value approach at α = 0.05.What is the result?A)We reject H0 since the value of the test statistic is greater than
.B)We do not reject H0 since the value of the test statistic is greater than
.C)We reject H0 since the value of the test statistic is less than
.D)We do not reject H0 since the value of the test statistic is less than
سؤال
سؤال
Given below are the values taken from a normal population. ![<strong>Given below are the values taken from a normal population. A 95% confidence interval for the population variance is closest to:</strong> A)[2.03,16.30] B)[10.12,81.43] C)[9.00,72.41] D)[11.39,91.64] <div style=padding-top: 35px>](https://d2lvgg3v3hfg70.cloudfront.net/TB2339/11eaa4ae_7aad_da8d_9180_4b07770e0320_TB2339_11.jpg) A 95% confidence interval for the population variance is closest to:
A 95% confidence interval for the population variance is closest to:
A)[2.03,16.30]
B)[10.12,81.43]
C)[9.00,72.41]
D)[11.39,91.64]
A 95% confidence interval for the population variance is closest to:A)[2.03,16.30]
B)[10.12,81.43]
C)[9.00,72.41]
D)[11.39,91.64]
سؤال
Exhibit 11-2.The manager of a video library would like the variance of the waiting times of the customers not to exceed 2.30 minutes-squared.He would like to add an additional billing counter if the variance exceeds the cut-off.He checks the recent sample data.For a random sample of 24 customer waiting times,he arrives at a sample variance of 3.8 minutes-squared.The manager assumes the waiting times to be normally distributed. Refer to Exhibit 11-2.Which of the following would be null and the alternate hypothesis to test if the cut-off is surpassed?
A)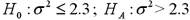
B)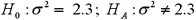
C)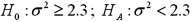
D)
A)
B)
C)
D)
سؤال
For a 99% confidence level find  with 6 degrees of freedom.
A)16.812
B)18.548
C)0.872
D)0.676
with 6 degrees of freedom.A)16.812
B)18.548
C)0.872
D)0.676
سؤال
Students of two sections of a History course took a common final examination.The course instructor examines the variance in scores between the two sections.He selects random samples of n1 = 11 and n2 = 16 with sample variances of ![<strong>Students of two sections of a History course took a common final examination.The course instructor examines the variance in scores between the two sections.He selects random samples of n<sub>1</sub> = 11 and n<sub>2</sub> = 16 with sample variances of and ,respectively.Assuming that the population distributions are normal,construct a 90% confidence interval for the ratio of the population variance.</strong> A)[0.90,2.41] B)[0.50,2.00] C)[0.25,4.00] D)[0.79,5.70] <div style=padding-top: 35px>](https://d2lvgg3v3hfg70.cloudfront.net/TB2339/11eaa4ae_7aae_76d6_9180_7f542cf37971_TB2339_11.jpg) and
and ![<strong>Students of two sections of a History course took a common final examination.The course instructor examines the variance in scores between the two sections.He selects random samples of n<sub>1</sub> = 11 and n<sub>2</sub> = 16 with sample variances of and ,respectively.Assuming that the population distributions are normal,construct a 90% confidence interval for the ratio of the population variance.</strong> A)[0.90,2.41] B)[0.50,2.00] C)[0.25,4.00] D)[0.79,5.70] <div style=padding-top: 35px>](https://d2lvgg3v3hfg70.cloudfront.net/TB2339/11eaa4ae_7aae_76d7_9180_c129e23eea61_TB2339_11.jpg) ,respectively.Assuming that the population distributions are normal,construct a 90% confidence interval for the ratio of the population variance.
,respectively.Assuming that the population distributions are normal,construct a 90% confidence interval for the ratio of the population variance.
A)[0.90,2.41]
B)[0.50,2.00]
C)[0.25,4.00]
D)[0.79,5.70]
and ,respectively.Assuming that the population distributions are normal,construct a 90% confidence interval for the ratio of the population variance.A)[0.90,2.41]
B)[0.50,2.00]
C)[0.25,4.00]
D)[0.79,5.70]
سؤال
A professor analyzes the variance in scores between two sections that he teaches.The students of each section took the same test.The random samples drawn from the observations yield sample variances of ![<strong>A professor analyzes the variance in scores between two sections that he teaches.The students of each section took the same test.The random samples drawn from the observations yield sample variances of = 203.15 and = 474.42 for samples of n<sub>1</sub> = 13 and n<sub>2</sub> = 16,respectively.Construct a 99% confidence interval for the ratio of the population variances.</strong> A)[0.1540,2.7809] B)[0.1008,2.0217] C)[0.1386,3.0895] D)[0.0907,1.8198] <div style=padding-top: 35px>](https://d2lvgg3v3hfg70.cloudfront.net/TB2339/11eaa4ae_7ab0_71c3_9180_0191825b4b86_TB2339_11.jpg) = 203.15 and
= 203.15 and ![<strong>A professor analyzes the variance in scores between two sections that he teaches.The students of each section took the same test.The random samples drawn from the observations yield sample variances of = 203.15 and = 474.42 for samples of n<sub>1</sub> = 13 and n<sub>2</sub> = 16,respectively.Construct a 99% confidence interval for the ratio of the population variances.</strong> A)[0.1540,2.7809] B)[0.1008,2.0217] C)[0.1386,3.0895] D)[0.0907,1.8198] <div style=padding-top: 35px>](https://d2lvgg3v3hfg70.cloudfront.net/TB2339/11eaa4ae_7ab0_71c4_9180_5bed29d98b2b_TB2339_11.jpg) = 474.42 for samples of n1 = 13 and n2 = 16,respectively.Construct a 99% confidence interval for the ratio of the population variances.
= 474.42 for samples of n1 = 13 and n2 = 16,respectively.Construct a 99% confidence interval for the ratio of the population variances.
A)[0.1540,2.7809]
B)[0.1008,2.0217]
C)[0.1386,3.0895]
D)[0.0907,1.8198]
= 203.15 and = 474.42 for samples of n1 = 13 and n2 = 16,respectively.Construct a 99% confidence interval for the ratio of the population variances.A)[0.1540,2.7809]
B)[0.1008,2.0217]
C)[0.1386,3.0895]
D)[0.0907,1.8198]
سؤال
Exhibit 11-2.The manager of a video library would like the variance of the waiting times of the customers not to exceed 2.30 minutes-squared.He would like to add an additional billing counter if the variance exceeds the cut-off.He checks the recent sample data.For a random sample of 24 customer waiting times,he arrives at a sample variance of 3.8 minutes-squared.The manager assumes the waiting times to be normally distributed. Refer to Exhibit 11-2.At α = 0.05 which of the following is the critical value,  ?
?
A)13.091
B)32.007
C)35.172
D)38.076
?A)13.091
B)32.007
C)35.172
D)38.076
سؤال
Exhibit 11-5.Amie Jackson,a manager at Sigma travel services,makes every effort to ensure that customers attempting to make online reservations do not have to wait too long to complete the reservation process.The travel website is open for reservations 24 hours a day,and Amie regularly checks the website for the waiting time to maintain consistency in service.She uses the following independently drawn samples of wait time during two peak hours,morning 8 am to 10 am and evening 7 pm to 9 pm,for the analysis.Assume that wait times are normally distributed. ![<strong>Exhibit 11-5.Amie Jackson,a manager at Sigma travel services,makes every effort to ensure that customers attempting to make online reservations do not have to wait too long to complete the reservation process.The travel website is open for reservations 24 hours a day,and Amie regularly checks the website for the waiting time to maintain consistency in service.She uses the following independently drawn samples of wait time during two peak hours,morning 8 am to 10 am and evening 7 pm to 9 pm,for the analysis.Assume that wait times are normally distributed. Refer to Exhibit 11-5.Identify the 95% interval estimate for the ratio of the population variances.</strong> A)[1.02,8.55] B)[1.00,8.73] C)[0.99,8.83] D)[1.19,7.34] <div style=padding-top: 35px>](https://d2lvgg3v3hfg70.cloudfront.net/TB2339/11eaa4ae_7ab1_834b_9180_3bf0d33d2ce7_TB2339_00.jpg) Refer to Exhibit 11-5.Identify the 95% interval estimate for the ratio of the population variances.
Refer to Exhibit 11-5.Identify the 95% interval estimate for the ratio of the population variances.
A)[1.02,8.55]
B)[1.00,8.73]
C)[0.99,8.83]
D)[1.19,7.34]
Refer to Exhibit 11-5.Identify the 95% interval estimate for the ratio of the population variances.A)[1.02,8.55]
B)[1.00,8.73]
C)[0.99,8.83]
D)[1.19,7.34]
سؤال
Exhibit 11-5.Amie Jackson,a manager at Sigma travel services,makes every effort to ensure that customers attempting to make online reservations do not have to wait too long to complete the reservation process.The travel website is open for reservations 24 hours a day,and Amie regularly checks the website for the waiting time to maintain consistency in service.She uses the following independently drawn samples of wait time during two peak hours,morning 8 am to 10 am and evening 7 pm to 9 pm,for the analysis.Assume that wait times are normally distributed.  Refer to Exhibit 11-5.State the null and the alternate hypotheses to determine if the variance of wait time during morning peak hours (population 1)differs from that during the evening peak hours (population 2).
A)
B)
C)
D)
Refer to Exhibit 11-5.State the null and the alternate hypotheses to determine if the variance of wait time during morning peak hours (population 1)differs from that during the evening peak hours (population 2).A)
B)
C)
D)
سؤال
Exhibit 11-3.The following are the competing hypotheses and the relevant summary statistics.  Sample 1:
  n1 = 10 Sample 2:
  n2 = 9
Refer to Exhibit 11-3.Which of the following statements is true with regard to the assumptions for conducting the hypothesis test?
A)The samples are drawn from a nonnormal population.
B)The samples are dependent and taken from a normal population.
C)The difference of the sample variances is used to test the hypotheses.
D)The samples are independent and taken from a normal population.
Sample 1: n1 = 10 Sample 2: n2 = 9Refer to Exhibit 11-3.Which of the following statements is true with regard to the assumptions for conducting the hypothesis test?
A)The samples are drawn from a nonnormal population.
B)The samples are dependent and taken from a normal population.
C)The difference of the sample variances is used to test the hypotheses.
D)The samples are independent and taken from a normal population.
سؤال
Which of the following Excel functions is used to calculate the exact probability for a left-tailed  distribution?
A)CHISQ.DIST (x,deg_ freedom,cumulative)
B)CHISQ.DIST (x,n-2)
C)CHISQ.DIST (x,n/2)
D)CHISQ.DIST (x/2,deg_freedom,cumulative)
distribution?A)CHISQ.DIST (x,deg_ freedom,cumulative)
B)CHISQ.DIST (x,n-2)
C)CHISQ.DIST (x,n/2)
D)CHISQ.DIST (x/2,deg_freedom,cumulative)
سؤال
Exhibit 11-3.The following are the competing hypotheses and the relevant summary statistics.  Sample 1:
  n1 = 10 Sample 2:
  n2 = 9
Refer to Exhibit 11-3.What is the critical value at the 5% significance level?
A)3.02
B)3.14
C)3.23
D)3.39
Sample 1: n1 = 10 Sample 2: n2 = 9Refer to Exhibit 11-3.What is the critical value at the 5% significance level?
A)3.02
B)3.14
C)3.23
D)3.39
سؤال
سؤال
Exhibit 11-3.The following are the competing hypotheses and the relevant summary statistics. 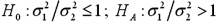 Sample 1:
  n1 = 10 Sample 2:
  n2 = 9
Refer to Exhibit 11-3.The p-value associated with the value of the test statistic is 0.3692.At the 5% significance level,which of the following conclusions is correct?
A)We reject the null hypothesis and conclude that the variances differ.
B)We do not reject the null hypothesis and conclude that the variances differ.
C)We reject the null hypothesis and cannot conclude that the variances differ.
D)We do not reject the null hypothesis and cannot conclude that the variances differ.
Sample 1: n1 = 10 Sample 2: n2 = 9Refer to Exhibit 11-3.The p-value associated with the value of the test statistic is 0.3692.At the 5% significance level,which of the following conclusions is correct?
A)We reject the null hypothesis and conclude that the variances differ.
B)We do not reject the null hypothesis and conclude that the variances differ.
C)We reject the null hypothesis and cannot conclude that the variances differ.
D)We do not reject the null hypothesis and cannot conclude that the variances differ.
سؤال
Consider the expected returns (in percent)from two investment options.Beth wants to determine if investment 1 has a lower variance.Use the following summary statistics to arrive at the results. Investment 1:  = 33.53;n1 = 8
Investment 2: = 44.76;n2 = 8
Identify the relevant null and alternate hypotheses for this test.
A)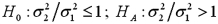
B)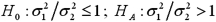
C)
D)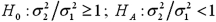
= 33.53;n1 = 8Investment 2:
= 44.76;n2 = 8Identify the relevant null and alternate hypotheses for this test.
A)
B)
C)
D)
سؤال
A two-tailed test is used to determine if two population variances differ.The null hypothesis takes the form H0:
A)
B)
C)
D)
A)
B)
C)
D)
سؤال
If independent samples of size n1 and n2 are drawn from normal populations with equal variances,then the value of the F(df1,df2) statistic is calculated as ____.
A)
B)
C)
D)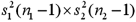
A)
B)
C)
D)
سؤال
Construct a 95% confidence interval for the ratios of two population variances.The random samples of n1 = 9 and n2 = 11 with sample variances of ![<strong>Construct a 95% confidence interval for the ratios of two population variances.The random samples of n<sub>1</sub> = 9 and n<sub>2</sub> = 11 with sample variances of and ,respectively.Assume that the samples were drawn from a normal population.</strong> A)[0.50,2.00] B)[0.52,8.60] C)[0.25,1.41] D)[0.44,4.30] <div style=padding-top: 35px>](https://d2lvgg3v3hfg70.cloudfront.net/TB2339/11eaa4ae_7ab0_bfe9_9180_b3f614572b24_TB2339_11.jpg) and
and ![<strong>Construct a 95% confidence interval for the ratios of two population variances.The random samples of n<sub>1</sub> = 9 and n<sub>2</sub> = 11 with sample variances of and ,respectively.Assume that the samples were drawn from a normal population.</strong> A)[0.50,2.00] B)[0.52,8.60] C)[0.25,1.41] D)[0.44,4.30] <div style=padding-top: 35px>](https://d2lvgg3v3hfg70.cloudfront.net/TB2339/11eaa4ae_7ab0_bfea_9180_c34e0b84e9e2_TB2339_11.jpg) ,respectively.Assume that the samples were drawn from a normal population.
,respectively.Assume that the samples were drawn from a normal population.
A)[0.50,2.00]
B)[0.52,8.60]
C)[0.25,1.41]
D)[0.44,4.30]
and ,respectively.Assume that the samples were drawn from a normal population.A)[0.50,2.00]
B)[0.52,8.60]
C)[0.25,1.41]
D)[0.44,4.30]
سؤال
Which of the following is the formula for a confidence interval for the ratio of the population variances  ?
?
A)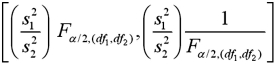
B)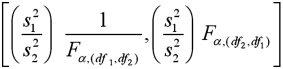
C)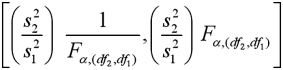
D)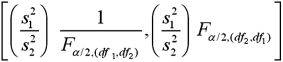
?A)
B)
C)
D)
سؤال
سؤال
سؤال
Which of the following Excel functions is used to determine the left-tailed  value given any probability?
A)CHISQ.INV (probability,n)
B)CHISQ.INV (probability,n-2)
C)CHISQ.INV (probability,deg_ freedom)
D)CHISQ.INV (probability,n/2)
value given any probability?A)CHISQ.INV (probability,n)
B)CHISQ.INV (probability,n-2)
C)CHISQ.INV (probability,deg_ freedom)
D)CHISQ.INV (probability,n/2)
سؤال
Exhibit 11-5.Amie Jackson,a manager at Sigma travel services,makes every effort to ensure that customers attempting to make online reservations do not have to wait too long to complete the reservation process.The travel website is open for reservations 24 hours a day,and Amie regularly checks the website for the waiting time to maintain consistency in service.She uses the following independently drawn samples of wait time during two peak hours,morning 8 am to 10 am and evening 7 pm to 9 pm,for the analysis.Assume that wait times are normally distributed. ![<strong>Exhibit 11-5.Amie Jackson,a manager at Sigma travel services,makes every effort to ensure that customers attempting to make online reservations do not have to wait too long to complete the reservation process.The travel website is open for reservations 24 hours a day,and Amie regularly checks the website for the waiting time to maintain consistency in service.She uses the following independently drawn samples of wait time during two peak hours,morning 8 am to 10 am and evening 7 pm to 9 pm,for the analysis.Assume that wait times are normally distributed. Refer to Exhibit 11-5.Construct a 90% confidence interval and test if the ratio of the population variances differs from one at the 10% significance level.Which of the following outcomes supports the test?</strong> A)[1.47,5.99].The ratio of the population variances differs from one at the 10% significance level. B)[1.19,7.35].The ratio of the population variances differs from one at the 10% significance level. C)[1.47,5.99].The ratio of the population variances does not differ from one at the 10% significance level. D)[1.19,7.35].The ratio of the population variances does not differ from one at the 10% significance level. <div style=padding-top: 35px>](https://d2lvgg3v3hfg70.cloudfront.net/TB2339/11eaa4ae_7ab1_834c_9180_4d8c89aecdcd_TB2339_00.jpg) Refer to Exhibit 11-5.Construct a 90% confidence interval and test if the ratio of the population variances differs from one at the 10% significance level.Which of the following outcomes supports the test?
Refer to Exhibit 11-5.Construct a 90% confidence interval and test if the ratio of the population variances differs from one at the 10% significance level.Which of the following outcomes supports the test?
A)[1.47,5.99].The ratio of the population variances differs from one at the 10% significance level.
B)[1.19,7.35].The ratio of the population variances differs from one at the 10% significance level.
C)[1.47,5.99].The ratio of the population variances does not differ from one at the 10% significance level.
D)[1.19,7.35].The ratio of the population variances does not differ from one at the 10% significance level.
Refer to Exhibit 11-5.Construct a 90% confidence interval and test if the ratio of the population variances differs from one at the 10% significance level.Which of the following outcomes supports the test?A)[1.47,5.99].The ratio of the population variances differs from one at the 10% significance level.
B)[1.19,7.35].The ratio of the population variances differs from one at the 10% significance level.
C)[1.47,5.99].The ratio of the population variances does not differ from one at the 10% significance level.
D)[1.19,7.35].The ratio of the population variances does not differ from one at the 10% significance level.
سؤال
سؤال
Exhibit 11-4.Consider the expected returns (in percent)from the two investment options.Beth claims that the variances of the returns for the two investments differ.Use the following data to arrive at the results.  Refer to Exhibit 11-4.Test Beth's claim at the 5% significance level.What is the conclusion?
A)p-value = 0.7127 > α = 0.05;Beth's claim is correct.
B)p-value = 0.7127 > α = 0.05;Beth's claim is wrong.
C)p-value = 0.7127 < α = 0.05;Beth's claim is wrong.
D)p-value = 0.7127 < α = 0.05;Beth's claim is correct.
Refer to Exhibit 11-4.Test Beth's claim at the 5% significance level.What is the conclusion?A)p-value = 0.7127 > α = 0.05;Beth's claim is correct.
B)p-value = 0.7127 > α = 0.05;Beth's claim is wrong.
C)p-value = 0.7127 < α = 0.05;Beth's claim is wrong.
D)p-value = 0.7127 < α = 0.05;Beth's claim is correct.
سؤال
سؤال
Find the value x for which:
A)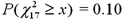 b.
b.  c.
c.  d.
d. 
A)
b. c. d. سؤال
Exhibit 11-5.Amie Jackson,a manager at Sigma travel services,makes every effort to ensure that customers attempting to make online reservations do not have to wait too long to complete the reservation process.The travel website is open for reservations 24 hours a day,and Amie regularly checks the website for the waiting time to maintain consistency in service.She uses the following independently drawn samples of wait time during two peak hours,morning 8 am to 10 am and evening 7 pm to 9 pm,for the analysis.Assume that wait times are normally distributed.  Refer to Exhibit 11-5.Compute the value of the test statistic.
A)1.72
B)2.96
C)1.66
D)0.34
Refer to Exhibit 11-5.Compute the value of the test statistic.A)1.72
B)2.96
C)1.66
D)0.34
سؤال
Consider the following hypotheses:  Approximate the p-value based on the following sample information,where the sample is drawn from a normally distributed population.
A)s2 = 500;n = 15
B)s2 = 600;n = 10
C)Which of the above sample information enables us to reject the null hypothesis at α = 0.10?
Approximate the p-value based on the following sample information,where the sample is drawn from a normally distributed population.A)s2 = 500;n = 15
B)s2 = 600;n = 10
C)Which of the above sample information enables us to reject the null hypothesis at α = 0.10?
سؤال
Find  and
and  under the following scenarios:
A)A 90% confidence level with n = 10.
B)A 95% confidence level with n = 15.
C)A 99% confidence level with n = 20.
and under the following scenarios:A)A 90% confidence level with n = 10.
B)A 95% confidence level with n = 15.
C)A 99% confidence level with n = 20.
سؤال
سؤال
Exhibit 11-5.Amie Jackson,a manager at Sigma travel services,makes every effort to ensure that customers attempting to make online reservations do not have to wait too long to complete the reservation process.The travel website is open for reservations 24 hours a day,and Amie regularly checks the website for the waiting time to maintain consistency in service.She uses the following independently drawn samples of wait time during two peak hours,morning 8 am to 10 am and evening 7 pm to 9 pm,for the analysis.Assume that wait times are normally distributed. 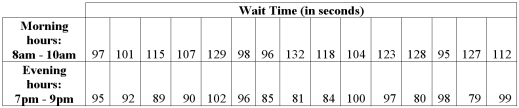 Refer to Exhibit 11-5.Calculate the p-value.
A)p-value is greater than 0.1
B)p-value lies between 0.025 and 0.05
C)p-value lies between 0.05 and 0.10
D)p-value is greater than 0.2
Refer to Exhibit 11-5.Calculate the p-value.A)p-value is greater than 0.1
B)p-value lies between 0.025 and 0.05
C)p-value lies between 0.05 and 0.10
D)p-value is greater than 0.2
سؤال
Exhibit 11-6.A financial analyst examines the performance of two mutual funds and claims that the variances of the annual returns for the bond funds differ.To support his claim,he collects data on the annual returns (in percent)for the years 2001 through 2010.The analyst assumes that the annual returns for the two emerging market bond funds are normally distributed.Here are some relevant summary statistics.  Refer to Exhibit 4-6.At α = 0.10,is the analyst's claim supported by the data?
A)No,the p-value < α = 0.10.
B)Yes,the p-value > α = 0.10.
C)No,the p-value > α = 0.10.
D)Yes,the p-value < α = 0.10.
Refer to Exhibit 4-6.At α = 0.10,is the analyst's claim supported by the data?A)No,the p-value < α = 0.10.
B)Yes,the p-value > α = 0.10.
C)No,the p-value > α = 0.10.
D)Yes,the p-value < α = 0.10.
سؤال
سؤال
The sample standard deviation of the monthly sales (in thousands of dollars)of a telecommunications firm in U.S.for two years,2010 and 2011,is computed as 6.7.Assuming that the sales data are drawn from a normally distributed population,conduct the following hypothesis tests for the population variance.Use the critical value approach at α = 0.05.
A) b.
b. 
A)
b. سؤال
Exhibit 11-5.Amie Jackson,a manager at Sigma travel services,makes every effort to ensure that customers attempting to make online reservations do not have to wait too long to complete the reservation process.The travel website is open for reservations 24 hours a day,and Amie regularly checks the website for the waiting time to maintain consistency in service.She uses the following independently drawn samples of wait time during two peak hours,morning 8 am to 10 am and evening 7 pm to 9 pm,for the analysis.Assume that wait times are normally distributed.  Refer to Exhibit 11-5.At the 10% significance level,what is the conclusion?
A)Do not reject H0.We cannot conclude that the variance of wait time during morning peak hours differs from that during the evening peak hours.
B)Reject H0.We conclude that the variance of wait time during morning peak hours differs from that during the evening peak hours.
C)Do not reject H0.We conclude that the variance of wait time during morning peak hours differs from that during the evening peak hours.
D)Reject H0.We cannot conclude that the variance of wait time during morning peak hours differs from that during the evening peak hours.
Refer to Exhibit 11-5.At the 10% significance level,what is the conclusion?A)Do not reject H0.We cannot conclude that the variance of wait time during morning peak hours differs from that during the evening peak hours.
B)Reject H0.We conclude that the variance of wait time during morning peak hours differs from that during the evening peak hours.
C)Do not reject H0.We conclude that the variance of wait time during morning peak hours differs from that during the evening peak hours.
D)Reject H0.We cannot conclude that the variance of wait time during morning peak hours differs from that during the evening peak hours.
سؤال
Consider the following hypotheses:  A sample variance of 98 is obtained from a random sample of 10 observations drawn from a normally distributed population.At 1% significance level,conduct a test for the population variance using the p-value approach.
A sample variance of 98 is obtained from a random sample of 10 observations drawn from a normally distributed population.At 1% significance level,conduct a test for the population variance using the p-value approach. سؤال
Exhibit 11-6.A financial analyst examines the performance of two mutual funds and claims that the variances of the annual returns for the bond funds differ.To support his claim,he collects data on the annual returns (in percent)for the years 2001 through 2010.The analyst assumes that the annual returns for the two emerging market bond funds are normally distributed.Here are some relevant summary statistics.  Refer to Exhibit 11-6.At α = 0.10,is the analyst's claim supported by the data using the critical value approach?
A)No,because the value of the test statistic is less than the critical F value.
B)Yes,because the value of the test statistic is less than the critical F value.
C)Yes,because the value of the test statistic is greater than the critical F value.
D)No,because the value of the test statistic is greater than the critical F value.
Refer to Exhibit 11-6.At α = 0.10,is the analyst's claim supported by the data using the critical value approach?A)No,because the value of the test statistic is less than the critical F value.
B)Yes,because the value of the test statistic is less than the critical F value.
C)Yes,because the value of the test statistic is greater than the critical F value.
D)No,because the value of the test statistic is greater than the critical F value.
سؤال
The following table shows the annual returns (in percent)for the Fidelity Utilities fund from 2006 through 2010. 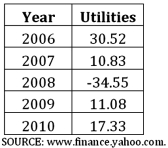
A)Calculate the point estimate of σ.
B)Construct a 95% confidence interval of σ.
A)Calculate the point estimate of σ.
B)Construct a 95% confidence interval of σ.
سؤال
Find the value x for which:
A)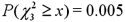 b.
b.  c.
c.  d.
d. 
A)
b. c. d. سؤال
Exhibit 11-6.A financial analyst examines the performance of two mutual funds and claims that the variances of the annual returns for the bond funds differ.To support his claim,he collects data on the annual returns (in percent)for the years 2001 through 2010.The analyst assumes that the annual returns for the two emerging market bond funds are normally distributed.Here are some relevant summary statistics.  Refer to Exhibit 11-6.For the competing hypotheses:
  since
since  ,approximate the p-value for the test.
A)Less than 0.01
B)Between 0.01 and 0.025
C)Between 0.02 and 0.05
D)Between 0.05 and 0.10
Refer to Exhibit 11-6.For the competing hypotheses: since ,approximate the p-value for the test.A)Less than 0.01
B)Between 0.01 and 0.025
C)Between 0.02 and 0.05
D)Between 0.05 and 0.10
سؤال
Exhibit 11-6.A financial analyst examines the performance of two mutual funds and claims that the variances of the annual returns for the bond funds differ.To support his claim,he collects data on the annual returns (in percent)for the years 2001 through 2010.The analyst assumes that the annual returns for the two emerging market bond funds are normally distributed.Here are some relevant summary statistics.  Refer to Exhibit 11-6.Repeat the hypothesis test,
 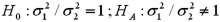 since
since  .What is the critical F value at the 10% significance level?
A)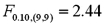
B)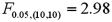
C)
D)
Refer to Exhibit 11-6.Repeat the hypothesis test, since .What is the critical F value at the 10% significance level?A)
B)
C)
D)
سؤال
سؤال
سؤال
Consider the following hypotheses:  A sample variance of 98 is obtained from a random sample of 10 observations drawn from a normally distributed population.At 1% significance level,conduct a test for the population variance using the critical value approach.
A sample variance of 98 is obtained from a random sample of 10 observations drawn from a normally distributed population.At 1% significance level,conduct a test for the population variance using the critical value approach.
فتح الحزمة
قم بالتسجيل لفتح البطاقات في هذه المجموعة!
Unlock Deck
Unlock Deck
1/96
العب
ملء الشاشة (f)
Deck 11: Statistical Inference Concerning Variance
1
If a sample of size n is taken from a normal population with a finite variance,then the statistic follows the distribution with degrees of freedom ____.
A)(n + 1)(n - 1)
B)n + 1
C)n - 1
D)n
follows the distribution with degrees of freedom ____.A)(n + 1)(n - 1)
B)n + 1
C)n - 1
D)n
n - 1
2
The formula for the confidence interval of the population variance σ2 is valid for the random samples drawn from any population.
False
3
The skewness of the Chi-square probability distribution depends on the degrees of freedom.
True
4
A right-tailed test for the ratio of two population variances examines whether is greater than .
examines whether is greater than . فتح الحزمة
افتح القفل للوصول البطاقات البالغ عددها 96 في هذه المجموعة.
فتح الحزمة
k this deck
5
The value of the test statistic to test the ratio of two population variances is .
. فتح الحزمة
افتح القفل للوصول البطاقات البالغ عددها 96 في هذه المجموعة.
فتح الحزمة
k this deck
6
A distribution tends to the ____,as the degrees of freedom increase.
A)F distribution
B)Uniform distribution
C)Student's t distribution
D)Normal distribution
distribution tends to the ____,as the degrees of freedom increase.A)F distribution
B)Uniform distribution
C)Student's t distribution
D)Normal distribution
فتح الحزمة
افتح القفل للوصول البطاقات البالغ عددها 96 في هذه المجموعة.
فتح الحزمة
k this deck
7
The sampling distribution of is the χ2 distribution.
is the χ2 distribution. فتح الحزمة
افتح القفل للوصول البطاقات البالغ عددها 96 في هذه المجموعة.
فتح الحزمة
k this deck
8
The distribution is positively skewed.
distribution is positively skewed. فتح الحزمة
افتح القفل للوصول البطاقات البالغ عددها 96 في هذه المجموعة.
فتح الحزمة
k this deck
9
Which of the following is the formula for the sample variance s2 when used as an estimate of σ2 for a random sample of n observations from a population?
A)
B)
C)
D)
A)
B)
C)
D)
فتح الحزمة
افتح القفل للوصول البطاقات البالغ عددها 96 في هذه المجموعة.
فتح الحزمة
k this deck
10
The population variance is one of the most widely used quantitative measures of risk in investments.
فتح الحزمة
افتح القفل للوصول البطاقات البالغ عددها 96 في هذه المجموعة.
فتح الحزمة
k this deck
11
The null hypothesis is rejected if the value of the test statistic exceeds .
is rejected if the value of the test statistic exceeds . فتح الحزمة
افتح القفل للوصول البطاقات البالغ عددها 96 في هذه المجموعة.
فتح الحزمة
k this deck
12
The formula for constructing the confidence interval for the ratio of two population variances is based on the assumption that the sample variances are computed from independently drawn samples from two nonnormal populations.
فتح الحزمة
افتح القفل للوصول البطاقات البالغ عددها 96 في هذه المجموعة.
فتح الحزمة
k this deck
13
If s2 is computed from a random sample of n observations drawn from an underlying normal population with a finite variance,then the variable is defined as ____.
A)
B)
C)
D)
variable is defined as ____.A)
B)
C)
D)
فتح الحزمة
افتح القفل للوصول البطاقات البالغ عددها 96 في هذه المجموعة.
فتح الحزمة
k this deck
14
The _____ is the probability distribution of the sum of several independent squared standard normal random variables.
A)F distribution
B) distribution
C)Student's t distribution
D)Uniform distribution
A)F distribution
B)
distributionC)Student's t distribution
D)Uniform distribution
فتح الحزمة
افتح القفل للوصول البطاقات البالغ عددها 96 في هذه المجموعة.
فتح الحزمة
k this deck
15
The parameter of interest for inferences regarding the ratio of two population variances is their sum .
. فتح الحزمة
افتح القفل للوصول البطاقات البالغ عددها 96 في هذه المجموعة.
فتح الحزمة
k this deck
16
The estimator of used in the inference regarding the ratio of two population variances is .
used in the inference regarding the ratio of two population variances is . فتح الحزمة
افتح القفل للوصول البطاقات البالغ عددها 96 في هذه المجموعة.
فتح الحزمة
k this deck
17
It is preferable to place the smaller sample variance in the numerator of the statistic.
statistic. فتح الحزمة
افتح القفل للوصول البطاقات البالغ عددها 96 في هذه المجموعة.
فتح الحزمة
k this deck
18
Statistical inferences regarding σ2 are based on the F distribution.
فتح الحزمة
افتح القفل للوصول البطاقات البالغ عددها 96 في هذه المجموعة.
فتح الحزمة
k this deck
19
The value of the test statistic for the hypothesis test of the population variance,σ2 is computed as .
. فتح الحزمة
افتح القفل للوصول البطاقات البالغ عددها 96 في هذه المجموعة.
فتح الحزمة
k this deck
20
The values of the distribution range from negative infinity to infinity.
distribution range from negative infinity to infinity. فتح الحزمة
افتح القفل للوصول البطاقات البالغ عددها 96 في هذه المجموعة.
فتح الحزمة
k this deck
21
Exhibit 11-1.Becky owns a diner and is concerned about sustaining the business.She wants to ascertain if the standard deviation of the profits for each week is greater than $250.The details of the profits for the week are listed below (in dollars. )Assume that profits are normally distributed. Refer to Exhibit 11-1.The appropriate null and alternate hypotheses are:
A)
B)
C)
D)
Refer to Exhibit 11-1.The appropriate null and alternate hypotheses are:A)
B)
C)
D)
فتح الحزمة
افتح القفل للوصول البطاقات البالغ عددها 96 في هذه المجموعة.
فتح الحزمة
k this deck
22
Which of the following is a feature of the F distribution?
A)The F distribution depends on one degree of freedom.
B)The F distribution is bell-shaped with values ranging from negative infinity to infinity.
C)The F distribution becomes increasingly symmetric when the degrees of freedom increase.
D)The F distribution is negatively skewed.
A)The F distribution depends on one degree of freedom.
B)The F distribution is bell-shaped with values ranging from negative infinity to infinity.
C)The F distribution becomes increasingly symmetric when the degrees of freedom increase.
D)The F distribution is negatively skewed.
فتح الحزمة
افتح القفل للوصول البطاقات البالغ عددها 96 في هذه المجموعة.
فتح الحزمة
k this deck
23
How does the width of the interval respond to the changes in the confidence interval?
A)The width of the interval decreases with an increase in the confidence interval.
B)The width of the interval increases with an increase in the confidence interval.
C)The width of the interval is halved with the increase in the confidence interval.
D)The width of the interval is doubled with the decrease in the confidence interval.
فتح الحزمة
افتح القفل للوصول البطاقات البالغ عددها 96 في هذه المجموعة.
فتح الحزمة
k this deck
24
Statistical inferences pertaining to σ2 are based on which of the following distributions?
A)The F distribution
B)The Student's t distribution
C)The Chi-Square distribution
D)The normal distribution
A)The F distribution
B)The Student's t distribution
C)The Chi-Square distribution
D)The normal distribution
فتح الحزمة
افتح القفل للوصول البطاقات البالغ عددها 96 في هذه المجموعة.
فتح الحزمة
k this deck
25
For a sample of 10 observations drawn from a normally distributed population,we obtain the sample mean and the sample variance as 50 and 75,respectively.We want to determine whether the population variance is greater than 70.The critical value at a 5% significance level is:
A)1.645
B)3.325
C)9.642
D)16.919
A)1.645
B)3.325
C)9.642
D)16.919
فتح الحزمة
افتح القفل للوصول البطاقات البالغ عددها 96 في هذه المجموعة.
فتح الحزمة
k this deck
26
Exhibit 11-2.The manager of a video library would like the variance of the waiting times of the customers not to exceed 2.30 minutes-squared.He would like to add an additional billing counter if the variance exceeds the cut-off.He checks the recent sample data.For a random sample of 24 customer waiting times,he arrives at a sample variance of 3.8 minutes-squared.The manager assumes the waiting times to be normally distributed. Refer to Exhibit 11-2.Approximate the p-value.
A)p-value lies between 0.005 and 0.010
B)p-value lies between 0.010 and 0.025
C)p-value lies between 0.050 and 0.10
D)p-value lies between 0.025 and 0.05
A)p-value lies between 0.005 and 0.010
B)p-value lies between 0.010 and 0.025
C)p-value lies between 0.050 and 0.10
D)p-value lies between 0.025 and 0.05
فتح الحزمة
افتح القفل للوصول البطاقات البالغ عددها 96 في هذه المجموعة.
فتح الحزمة
k this deck
27
Find the value of x for which = 0.05.
A)20.483
B)18.307
C)15.987
D)4.1680
= 0.05.A)20.483
B)18.307
C)15.987
D)4.1680
فتح الحزمة
افتح القفل للوصول البطاقات البالغ عددها 96 في هذه المجموعة.
فتح الحزمة
k this deck
28
You want to test whether the population variance differs from 50.From a sample of 25 observations drawn from a normally distributed population,you calculate s2 = 80.When conducting this test at the 5% significance level,the value of test statistic, is:
A)5.625
B)12.401
C)14.400
D)39.364
is:A)5.625
B)12.401
C)14.400
D)39.364
فتح الحزمة
افتح القفل للوصول البطاقات البالغ عددها 96 في هذه المجموعة.
فتح الحزمة
k this deck
29
Exhibit 11-1.Becky owns a diner and is concerned about sustaining the business.She wants to ascertain if the standard deviation of the profits for each week is greater than $250.The details of the profits for the week are listed below (in dollars. )Assume that profits are normally distributed. Refer to Exhibit 11-1.What is the value of the test statistic?
A)6.146
B)8.604
C)6.652
D)7.375
Refer to Exhibit 11-1.What is the value of the test statistic?A)6.146
B)8.604
C)6.652
D)7.375
فتح الحزمة
افتح القفل للوصول البطاقات البالغ عددها 96 في هذه المجموعة.
فتح الحزمة
k this deck
30
If P( ≥ x)= 0.05,then the value of x is ____.
A)14.449
B)10.645
C)12.592
D)1.6350
≥ x)= 0.05,then the value of x is ____.A)14.449
B)10.645
C)12.592
D)1.6350
فتح الحزمة
افتح القفل للوصول البطاقات البالغ عددها 96 في هذه المجموعة.
فتح الحزمة
k this deck
31
We conduct the following hypothesis test: versus .For a random sample of 15 observations,the sample standard deviation is 12.Approximate the p-value used to conduct this test.
A)p-value lies between 0.025 and 0.05
B)p-value lies between 0.01 and 0.025
C)p-value lies between 0.05 and 0.10
D)p-value is greater than 0.10
versus .For a random sample of 15 observations,the sample standard deviation is 12.Approximate the p-value used to conduct this test.A)p-value lies between 0.025 and 0.05
B)p-value lies between 0.01 and 0.025
C)p-value lies between 0.05 and 0.10
D)p-value is greater than 0.10
فتح الحزمة
افتح القفل للوصول البطاقات البالغ عددها 96 في هذه المجموعة.
فتح الحزمة
k this deck
32
Identify the hypothesis that depicts a right-tailed test for the population variance from the list of hypotheses given below.
A)
B)
C)
D)
A)
B)
C)
D)
فتح الحزمة
افتح القفل للوصول البطاقات البالغ عددها 96 في هذه المجموعة.
فتح الحزمة
k this deck
33
Which of the following factors is used to conduct hypothesis tests regarding the population variance?
A)Sample mean
B)Population mean
C)Sample proportion
D)Sample variance
A)Sample mean
B)Population mean
C)Sample proportion
D)Sample variance
فتح الحزمة
افتح القفل للوصول البطاقات البالغ عددها 96 في هذه المجموعة.
فتح الحزمة
k this deck
34
A random sample of 18 observations is taken from a normal population.The sample mean and sample standard deviation are 76.4 and 4.2,respectively.What is an 80% interval estimate of the population variance?
A)[12.107,29.735]
B)[10.870,34.581]
C)[12.819,31.484]
D)[14.636,23.443]
A)[12.107,29.735]
B)[10.870,34.581]
C)[12.819,31.484]
D)[14.636,23.443]
فتح الحزمة
افتح القفل للوصول البطاقات البالغ عددها 96 في هذه المجموعة.
فتح الحزمة
k this deck
35
Exhibit 11-1.Becky owns a diner and is concerned about sustaining the business.She wants to ascertain if the standard deviation of the profits for each week is greater than $250.The details of the profits for the week are listed below (in dollars. )Assume that profits are normally distributed. Refer to Exhibit 11-1.Test Becky's concern using the critical value approach at α = 0.05.What is the result?
A)We reject H0 since the value of the test statistic is greater than .
B)We do not reject H0 since the value of the test statistic is greater than .
C)We reject H0 since the value of the test statistic is less than .
D)We do not reject H0 since the value of the test statistic is less than
Refer to Exhibit 11-1.Test Becky's concern using the critical value approach at α = 0.05.What is the result?A)We reject H0 since the value of the test statistic is greater than
.B)We do not reject H0 since the value of the test statistic is greater than
.C)We reject H0 since the value of the test statistic is less than
.D)We do not reject H0 since the value of the test statistic is less than
فتح الحزمة
افتح القفل للوصول البطاقات البالغ عددها 96 في هذه المجموعة.
فتح الحزمة
k this deck
36
Compute a 98% confidence interval for the population variance when the sample variance is 20 for a sample of 10 items from a normal population.
A)8.308 to 86.207
B)7.476 to 77.512
C)8.617 to 78.125
D)7.755 to 70.313
A)8.308 to 86.207
B)7.476 to 77.512
C)8.617 to 78.125
D)7.755 to 70.313
فتح الحزمة
افتح القفل للوصول البطاقات البالغ عددها 96 في هذه المجموعة.
فتح الحزمة
k this deck
37
Given below are the values taken from a normal population. A 95% confidence interval for the population variance is closest to:
A)[2.03,16.30]
B)[10.12,81.43]
C)[9.00,72.41]
D)[11.39,91.64]
A 95% confidence interval for the population variance is closest to:A)[2.03,16.30]
B)[10.12,81.43]
C)[9.00,72.41]
D)[11.39,91.64]
فتح الحزمة
افتح القفل للوصول البطاقات البالغ عددها 96 في هذه المجموعة.
فتح الحزمة
k this deck
38
Exhibit 11-2.The manager of a video library would like the variance of the waiting times of the customers not to exceed 2.30 minutes-squared.He would like to add an additional billing counter if the variance exceeds the cut-off.He checks the recent sample data.For a random sample of 24 customer waiting times,he arrives at a sample variance of 3.8 minutes-squared.The manager assumes the waiting times to be normally distributed. Refer to Exhibit 11-2.Which of the following would be null and the alternate hypothesis to test if the cut-off is surpassed?
A)
B)
C)
D)
A)
B)
C)
D)
فتح الحزمة
افتح القفل للوصول البطاقات البالغ عددها 96 في هذه المجموعة.
فتح الحزمة
k this deck
39
For a 99% confidence level find with 6 degrees of freedom.
A)16.812
B)18.548
C)0.872
D)0.676
with 6 degrees of freedom.A)16.812
B)18.548
C)0.872
D)0.676
فتح الحزمة
افتح القفل للوصول البطاقات البالغ عددها 96 في هذه المجموعة.
فتح الحزمة
k this deck
40
Students of two sections of a History course took a common final examination.The course instructor examines the variance in scores between the two sections.He selects random samples of n1 = 11 and n2 = 16 with sample variances of and ,respectively.Assuming that the population distributions are normal,construct a 90% confidence interval for the ratio of the population variance.
A)[0.90,2.41]
B)[0.50,2.00]
C)[0.25,4.00]
D)[0.79,5.70]
and ,respectively.Assuming that the population distributions are normal,construct a 90% confidence interval for the ratio of the population variance.A)[0.90,2.41]
B)[0.50,2.00]
C)[0.25,4.00]
D)[0.79,5.70]
فتح الحزمة
افتح القفل للوصول البطاقات البالغ عددها 96 في هذه المجموعة.
فتح الحزمة
k this deck
41
A professor analyzes the variance in scores between two sections that he teaches.The students of each section took the same test.The random samples drawn from the observations yield sample variances of = 203.15 and = 474.42 for samples of n1 = 13 and n2 = 16,respectively.Construct a 99% confidence interval for the ratio of the population variances.
A)[0.1540,2.7809]
B)[0.1008,2.0217]
C)[0.1386,3.0895]
D)[0.0907,1.8198]
= 203.15 and = 474.42 for samples of n1 = 13 and n2 = 16,respectively.Construct a 99% confidence interval for the ratio of the population variances.A)[0.1540,2.7809]
B)[0.1008,2.0217]
C)[0.1386,3.0895]
D)[0.0907,1.8198]
فتح الحزمة
افتح القفل للوصول البطاقات البالغ عددها 96 في هذه المجموعة.
فتح الحزمة
k this deck
42
Exhibit 11-2.The manager of a video library would like the variance of the waiting times of the customers not to exceed 2.30 minutes-squared.He would like to add an additional billing counter if the variance exceeds the cut-off.He checks the recent sample data.For a random sample of 24 customer waiting times,he arrives at a sample variance of 3.8 minutes-squared.The manager assumes the waiting times to be normally distributed. Refer to Exhibit 11-2.At α = 0.05 which of the following is the critical value, ?
A)13.091
B)32.007
C)35.172
D)38.076
?A)13.091
B)32.007
C)35.172
D)38.076
فتح الحزمة
افتح القفل للوصول البطاقات البالغ عددها 96 في هذه المجموعة.
فتح الحزمة
k this deck
43
Exhibit 11-5.Amie Jackson,a manager at Sigma travel services,makes every effort to ensure that customers attempting to make online reservations do not have to wait too long to complete the reservation process.The travel website is open for reservations 24 hours a day,and Amie regularly checks the website for the waiting time to maintain consistency in service.She uses the following independently drawn samples of wait time during two peak hours,morning 8 am to 10 am and evening 7 pm to 9 pm,for the analysis.Assume that wait times are normally distributed. Refer to Exhibit 11-5.Identify the 95% interval estimate for the ratio of the population variances.
A)[1.02,8.55]
B)[1.00,8.73]
C)[0.99,8.83]
D)[1.19,7.34]
Refer to Exhibit 11-5.Identify the 95% interval estimate for the ratio of the population variances.A)[1.02,8.55]
B)[1.00,8.73]
C)[0.99,8.83]
D)[1.19,7.34]
فتح الحزمة
افتح القفل للوصول البطاقات البالغ عددها 96 في هذه المجموعة.
فتح الحزمة
k this deck
44
Exhibit 11-5.Amie Jackson,a manager at Sigma travel services,makes every effort to ensure that customers attempting to make online reservations do not have to wait too long to complete the reservation process.The travel website is open for reservations 24 hours a day,and Amie regularly checks the website for the waiting time to maintain consistency in service.She uses the following independently drawn samples of wait time during two peak hours,morning 8 am to 10 am and evening 7 pm to 9 pm,for the analysis.Assume that wait times are normally distributed. Refer to Exhibit 11-5.State the null and the alternate hypotheses to determine if the variance of wait time during morning peak hours (population 1)differs from that during the evening peak hours (population 2).
A)
B)
C)
D)
Refer to Exhibit 11-5.State the null and the alternate hypotheses to determine if the variance of wait time during morning peak hours (population 1)differs from that during the evening peak hours (population 2).A)
B)
C)
D)
فتح الحزمة
افتح القفل للوصول البطاقات البالغ عددها 96 في هذه المجموعة.
فتح الحزمة
k this deck
45
Exhibit 11-3.The following are the competing hypotheses and the relevant summary statistics. Sample 1: n1 = 10 Sample 2: n2 = 9
Refer to Exhibit 11-3.Which of the following statements is true with regard to the assumptions for conducting the hypothesis test?
A)The samples are drawn from a nonnormal population.
B)The samples are dependent and taken from a normal population.
C)The difference of the sample variances is used to test the hypotheses.
D)The samples are independent and taken from a normal population.
Sample 1: n1 = 10 Sample 2: n2 = 9Refer to Exhibit 11-3.Which of the following statements is true with regard to the assumptions for conducting the hypothesis test?
A)The samples are drawn from a nonnormal population.
B)The samples are dependent and taken from a normal population.
C)The difference of the sample variances is used to test the hypotheses.
D)The samples are independent and taken from a normal population.
فتح الحزمة
افتح القفل للوصول البطاقات البالغ عددها 96 في هذه المجموعة.
فتح الحزمة
k this deck
46
Which of the following Excel functions is used to calculate the exact probability for a left-tailed distribution?
A)CHISQ.DIST (x,deg_ freedom,cumulative)
B)CHISQ.DIST (x,n-2)
C)CHISQ.DIST (x,n/2)
D)CHISQ.DIST (x/2,deg_freedom,cumulative)
distribution?A)CHISQ.DIST (x,deg_ freedom,cumulative)
B)CHISQ.DIST (x,n-2)
C)CHISQ.DIST (x,n/2)
D)CHISQ.DIST (x/2,deg_freedom,cumulative)
فتح الحزمة
افتح القفل للوصول البطاقات البالغ عددها 96 في هذه المجموعة.
فتح الحزمة
k this deck
47
Exhibit 11-3.The following are the competing hypotheses and the relevant summary statistics. Sample 1: n1 = 10 Sample 2: n2 = 9
Refer to Exhibit 11-3.What is the critical value at the 5% significance level?
A)3.02
B)3.14
C)3.23
D)3.39
Sample 1: n1 = 10 Sample 2: n2 = 9Refer to Exhibit 11-3.What is the critical value at the 5% significance level?
A)3.02
B)3.14
C)3.23
D)3.39
فتح الحزمة
افتح القفل للوصول البطاقات البالغ عددها 96 في هذه المجموعة.
فتح الحزمة
k this deck
48
The result of placing a larger sample variance in the numerator of the F(df1,df2) statistic allows us to
A)focus only on the right tail of the distribution.
B)arrive at a more accurate F(df1,df2) statistic value.
C)focus only on the left tail of the distribution.
D)determine if the distribution is symmetric.
A)focus only on the right tail of the distribution.
B)arrive at a more accurate F(df1,df2) statistic value.
C)focus only on the left tail of the distribution.
D)determine if the distribution is symmetric.
فتح الحزمة
افتح القفل للوصول البطاقات البالغ عددها 96 في هذه المجموعة.
فتح الحزمة
k this deck
49
Exhibit 11-3.The following are the competing hypotheses and the relevant summary statistics. Sample 1: n1 = 10 Sample 2: n2 = 9
Refer to Exhibit 11-3.The p-value associated with the value of the test statistic is 0.3692.At the 5% significance level,which of the following conclusions is correct?
A)We reject the null hypothesis and conclude that the variances differ.
B)We do not reject the null hypothesis and conclude that the variances differ.
C)We reject the null hypothesis and cannot conclude that the variances differ.
D)We do not reject the null hypothesis and cannot conclude that the variances differ.
Sample 1: n1 = 10 Sample 2: n2 = 9Refer to Exhibit 11-3.The p-value associated with the value of the test statistic is 0.3692.At the 5% significance level,which of the following conclusions is correct?
A)We reject the null hypothesis and conclude that the variances differ.
B)We do not reject the null hypothesis and conclude that the variances differ.
C)We reject the null hypothesis and cannot conclude that the variances differ.
D)We do not reject the null hypothesis and cannot conclude that the variances differ.
فتح الحزمة
افتح القفل للوصول البطاقات البالغ عددها 96 في هذه المجموعة.
فتح الحزمة
k this deck
50
Consider the expected returns (in percent)from two investment options.Beth wants to determine if investment 1 has a lower variance.Use the following summary statistics to arrive at the results. Investment 1: = 33.53;n1 = 8
Investment 2: = 44.76;n2 = 8
Identify the relevant null and alternate hypotheses for this test.
A)
B)
C)
D)
= 33.53;n1 = 8Investment 2:
= 44.76;n2 = 8Identify the relevant null and alternate hypotheses for this test.
A)
B)
C)
D)
فتح الحزمة
افتح القفل للوصول البطاقات البالغ عددها 96 في هذه المجموعة.
فتح الحزمة
k this deck
51
A two-tailed test is used to determine if two population variances differ.The null hypothesis takes the form H0:
A)
B)
C)
D)
A)
B)
C)
D)
فتح الحزمة
افتح القفل للوصول البطاقات البالغ عددها 96 في هذه المجموعة.
فتح الحزمة
k this deck
52
If independent samples of size n1 and n2 are drawn from normal populations with equal variances,then the value of the F(df1,df2) statistic is calculated as ____.
A)
B)
C)
D)
A)
B)
C)
D)
فتح الحزمة
افتح القفل للوصول البطاقات البالغ عددها 96 في هذه المجموعة.
فتح الحزمة
k this deck
53
Construct a 95% confidence interval for the ratios of two population variances.The random samples of n1 = 9 and n2 = 11 with sample variances of and ,respectively.Assume that the samples were drawn from a normal population.
A)[0.50,2.00]
B)[0.52,8.60]
C)[0.25,1.41]
D)[0.44,4.30]
and ,respectively.Assume that the samples were drawn from a normal population.A)[0.50,2.00]
B)[0.52,8.60]
C)[0.25,1.41]
D)[0.44,4.30]
فتح الحزمة
افتح القفل للوصول البطاقات البالغ عددها 96 في هذه المجموعة.
فتح الحزمة
k this deck
54
Which of the following is the formula for a confidence interval for the ratio of the population variances ?
A)
B)
C)
D)
?A)
B)
C)
D)
فتح الحزمة
افتح القفل للوصول البطاقات البالغ عددها 96 في هذه المجموعة.
فتح الحزمة
k this deck
55
The degrees of freedom df1 and df2 for an F(df1,df2) distribution is given by _____ and ____.
A)(n1 - 2); (n2 - 2)
B)n2 (n1 - 2);n1(n2 - 2)
C)(n1 - 1); (n2 - 1)
D)n (n1 - 1);n (n2 - 1)
A)(n1 - 2); (n2 - 2)
B)n2 (n1 - 2);n1(n2 - 2)
C)(n1 - 1); (n2 - 1)
D)n (n1 - 1);n (n2 - 1)
فتح الحزمة
افتح القفل للوصول البطاقات البالغ عددها 96 في هذه المجموعة.
فتح الحزمة
k this deck
56
Find the value of x given the equation P(F(6,10) ≥ x)= 0.025.
A)4.07
B)5.46
C)3.22
D)5.39
A)4.07
B)5.46
C)3.22
D)5.39
فتح الحزمة
افتح القفل للوصول البطاقات البالغ عددها 96 في هذه المجموعة.
فتح الحزمة
k this deck
57
Which of the following Excel functions is used to determine the left-tailed value given any probability?
A)CHISQ.INV (probability,n)
B)CHISQ.INV (probability,n-2)
C)CHISQ.INV (probability,deg_ freedom)
D)CHISQ.INV (probability,n/2)
value given any probability?A)CHISQ.INV (probability,n)
B)CHISQ.INV (probability,n-2)
C)CHISQ.INV (probability,deg_ freedom)
D)CHISQ.INV (probability,n/2)
فتح الحزمة
افتح القفل للوصول البطاقات البالغ عددها 96 في هذه المجموعة.
فتح الحزمة
k this deck
58
Exhibit 11-5.Amie Jackson,a manager at Sigma travel services,makes every effort to ensure that customers attempting to make online reservations do not have to wait too long to complete the reservation process.The travel website is open for reservations 24 hours a day,and Amie regularly checks the website for the waiting time to maintain consistency in service.She uses the following independently drawn samples of wait time during two peak hours,morning 8 am to 10 am and evening 7 pm to 9 pm,for the analysis.Assume that wait times are normally distributed. Refer to Exhibit 11-5.Construct a 90% confidence interval and test if the ratio of the population variances differs from one at the 10% significance level.Which of the following outcomes supports the test?
A)[1.47,5.99].The ratio of the population variances differs from one at the 10% significance level.
B)[1.19,7.35].The ratio of the population variances differs from one at the 10% significance level.
C)[1.47,5.99].The ratio of the population variances does not differ from one at the 10% significance level.
D)[1.19,7.35].The ratio of the population variances does not differ from one at the 10% significance level.
Refer to Exhibit 11-5.Construct a 90% confidence interval and test if the ratio of the population variances differs from one at the 10% significance level.Which of the following outcomes supports the test?A)[1.47,5.99].The ratio of the population variances differs from one at the 10% significance level.
B)[1.19,7.35].The ratio of the population variances differs from one at the 10% significance level.
C)[1.47,5.99].The ratio of the population variances does not differ from one at the 10% significance level.
D)[1.19,7.35].The ratio of the population variances does not differ from one at the 10% significance level.
فتح الحزمة
افتح القفل للوصول البطاقات البالغ عددها 96 في هذه المجموعة.
فتح الحزمة
k this deck
59
Which of the following characteristics is true with regard to the F distribution?
A)The F(df1,df2) distribution is negatively skewed.
B)The values of the F(df1,df2) distribution range from negative infinity to infinity.
C)The F(df1,df2) distribution is the probability distribution of the ratio of two independent chi-square variables.
D)The shape of the F(df1,df2) distribution is independent of the degrees of freedom.
فتح الحزمة
افتح القفل للوصول البطاقات البالغ عددها 96 في هذه المجموعة.
فتح الحزمة
k this deck
60
Exhibit 11-4.Consider the expected returns (in percent)from the two investment options.Beth claims that the variances of the returns for the two investments differ.Use the following data to arrive at the results. Refer to Exhibit 11-4.Test Beth's claim at the 5% significance level.What is the conclusion?
A)p-value = 0.7127 > α = 0.05;Beth's claim is correct.
B)p-value = 0.7127 > α = 0.05;Beth's claim is wrong.
C)p-value = 0.7127 < α = 0.05;Beth's claim is wrong.
D)p-value = 0.7127 < α = 0.05;Beth's claim is correct.
Refer to Exhibit 11-4.Test Beth's claim at the 5% significance level.What is the conclusion?A)p-value = 0.7127 > α = 0.05;Beth's claim is correct.
B)p-value = 0.7127 > α = 0.05;Beth's claim is wrong.
C)p-value = 0.7127 < α = 0.05;Beth's claim is wrong.
D)p-value = 0.7127 < α = 0.05;Beth's claim is correct.
فتح الحزمة
افتح القفل للوصول البطاقات البالغ عددها 96 في هذه المجموعة.
فتح الحزمة
k this deck
61
A random sample of 21 pages is used to estimate the population variance of the number of typographical errors in a book.The sample mean and sample standard deviation are calculated as 7.34 and 5.11,respectively.Assume that the population is normally distributed.
A)Construct a 95% interval estimate of the population variance.
B)Construct a 99% interval estimate of the population variance.
C)Use your answers to discuss the impact of the confidence level on the width of the interval.
A)Construct a 95% interval estimate of the population variance.
B)Construct a 99% interval estimate of the population variance.
C)Use your answers to discuss the impact of the confidence level on the width of the interval.
فتح الحزمة
افتح القفل للوصول البطاقات البالغ عددها 96 في هذه المجموعة.
فتح الحزمة
k this deck
62
Find the value x for which:
A) b. c. d.
A)
b. c. d. فتح الحزمة
افتح القفل للوصول البطاقات البالغ عددها 96 في هذه المجموعة.
فتح الحزمة
k this deck
63
Exhibit 11-5.Amie Jackson,a manager at Sigma travel services,makes every effort to ensure that customers attempting to make online reservations do not have to wait too long to complete the reservation process.The travel website is open for reservations 24 hours a day,and Amie regularly checks the website for the waiting time to maintain consistency in service.She uses the following independently drawn samples of wait time during two peak hours,morning 8 am to 10 am and evening 7 pm to 9 pm,for the analysis.Assume that wait times are normally distributed. Refer to Exhibit 11-5.Compute the value of the test statistic.
A)1.72
B)2.96
C)1.66
D)0.34
Refer to Exhibit 11-5.Compute the value of the test statistic.A)1.72
B)2.96
C)1.66
D)0.34
فتح الحزمة
افتح القفل للوصول البطاقات البالغ عددها 96 في هذه المجموعة.
فتح الحزمة
k this deck
64
Consider the following hypotheses: Approximate the p-value based on the following sample information,where the sample is drawn from a normally distributed population.
A)s2 = 500;n = 15
B)s2 = 600;n = 10
C)Which of the above sample information enables us to reject the null hypothesis at α = 0.10?
Approximate the p-value based on the following sample information,where the sample is drawn from a normally distributed population.A)s2 = 500;n = 15
B)s2 = 600;n = 10
C)Which of the above sample information enables us to reject the null hypothesis at α = 0.10?
فتح الحزمة
افتح القفل للوصول البطاقات البالغ عددها 96 في هذه المجموعة.
فتح الحزمة
k this deck
65
Find and under the following scenarios:
A)A 90% confidence level with n = 10.
B)A 95% confidence level with n = 15.
C)A 99% confidence level with n = 20.
and under the following scenarios:A)A 90% confidence level with n = 10.
B)A 95% confidence level with n = 15.
C)A 99% confidence level with n = 20.
فتح الحزمة
افتح القفل للوصول البطاقات البالغ عددها 96 في هذه المجموعة.
فتح الحزمة
k this deck
66
The supervisor of an automobile sales and service industry would like the variance of the number of automobiles serviced not to exceed 5 units-squared.He would recruit one more service executive if the variance exceeds this threshold.In a recent random sample of 14 services,he computes the sample standard deviation as 3.3.He believes that the automobile services are normally distributed.
A)State the null and the alternative hypotheses to test if the threshold has been crossed.
B)Use the critical value approach to conduct the test at α = 0.01.
C)What should the supervisor do?
A)State the null and the alternative hypotheses to test if the threshold has been crossed.
B)Use the critical value approach to conduct the test at α = 0.01.
C)What should the supervisor do?
فتح الحزمة
افتح القفل للوصول البطاقات البالغ عددها 96 في هذه المجموعة.
فتح الحزمة
k this deck
67
Exhibit 11-5.Amie Jackson,a manager at Sigma travel services,makes every effort to ensure that customers attempting to make online reservations do not have to wait too long to complete the reservation process.The travel website is open for reservations 24 hours a day,and Amie regularly checks the website for the waiting time to maintain consistency in service.She uses the following independently drawn samples of wait time during two peak hours,morning 8 am to 10 am and evening 7 pm to 9 pm,for the analysis.Assume that wait times are normally distributed. Refer to Exhibit 11-5.Calculate the p-value.
A)p-value is greater than 0.1
B)p-value lies between 0.025 and 0.05
C)p-value lies between 0.05 and 0.10
D)p-value is greater than 0.2
Refer to Exhibit 11-5.Calculate the p-value.A)p-value is greater than 0.1
B)p-value lies between 0.025 and 0.05
C)p-value lies between 0.05 and 0.10
D)p-value is greater than 0.2
فتح الحزمة
افتح القفل للوصول البطاقات البالغ عددها 96 في هذه المجموعة.
فتح الحزمة
k this deck
68
Exhibit 11-6.A financial analyst examines the performance of two mutual funds and claims that the variances of the annual returns for the bond funds differ.To support his claim,he collects data on the annual returns (in percent)for the years 2001 through 2010.The analyst assumes that the annual returns for the two emerging market bond funds are normally distributed.Here are some relevant summary statistics. Refer to Exhibit 4-6.At α = 0.10,is the analyst's claim supported by the data?
A)No,the p-value < α = 0.10.
B)Yes,the p-value > α = 0.10.
C)No,the p-value > α = 0.10.
D)Yes,the p-value < α = 0.10.
Refer to Exhibit 4-6.At α = 0.10,is the analyst's claim supported by the data?A)No,the p-value < α = 0.10.
B)Yes,the p-value > α = 0.10.
C)No,the p-value > α = 0.10.
D)Yes,the p-value < α = 0.10.
فتح الحزمة
افتح القفل للوصول البطاقات البالغ عددها 96 في هذه المجموعة.
فتح الحزمة
k this deck
69
A random sample of 10 homes sold during last month in the city of Fontana had the following number of bedrooms in each house: 4,2,3,5,4,3,3,4,5,3.At α = 0.01,test the claim that the variance of a normally distributed population is less than 1 using (a)the p-value approach and (b)the critical value approach.
فتح الحزمة
افتح القفل للوصول البطاقات البالغ عددها 96 في هذه المجموعة.
فتح الحزمة
k this deck
70
The sample standard deviation of the monthly sales (in thousands of dollars)of a telecommunications firm in U.S.for two years,2010 and 2011,is computed as 6.7.Assuming that the sales data are drawn from a normally distributed population,conduct the following hypothesis tests for the population variance.Use the critical value approach at α = 0.05.
A) b.
A)
b. فتح الحزمة
افتح القفل للوصول البطاقات البالغ عددها 96 في هذه المجموعة.
فتح الحزمة
k this deck
71
Exhibit 11-5.Amie Jackson,a manager at Sigma travel services,makes every effort to ensure that customers attempting to make online reservations do not have to wait too long to complete the reservation process.The travel website is open for reservations 24 hours a day,and Amie regularly checks the website for the waiting time to maintain consistency in service.She uses the following independently drawn samples of wait time during two peak hours,morning 8 am to 10 am and evening 7 pm to 9 pm,for the analysis.Assume that wait times are normally distributed. Refer to Exhibit 11-5.At the 10% significance level,what is the conclusion?
A)Do not reject H0.We cannot conclude that the variance of wait time during morning peak hours differs from that during the evening peak hours.
B)Reject H0.We conclude that the variance of wait time during morning peak hours differs from that during the evening peak hours.
C)Do not reject H0.We conclude that the variance of wait time during morning peak hours differs from that during the evening peak hours.
D)Reject H0.We cannot conclude that the variance of wait time during morning peak hours differs from that during the evening peak hours.
Refer to Exhibit 11-5.At the 10% significance level,what is the conclusion?A)Do not reject H0.We cannot conclude that the variance of wait time during morning peak hours differs from that during the evening peak hours.
B)Reject H0.We conclude that the variance of wait time during morning peak hours differs from that during the evening peak hours.
C)Do not reject H0.We conclude that the variance of wait time during morning peak hours differs from that during the evening peak hours.
D)Reject H0.We cannot conclude that the variance of wait time during morning peak hours differs from that during the evening peak hours.
فتح الحزمة
افتح القفل للوصول البطاقات البالغ عددها 96 في هذه المجموعة.
فتح الحزمة
k this deck
72
Consider the following hypotheses: A sample variance of 98 is obtained from a random sample of 10 observations drawn from a normally distributed population.At 1% significance level,conduct a test for the population variance using the p-value approach.
A sample variance of 98 is obtained from a random sample of 10 observations drawn from a normally distributed population.At 1% significance level,conduct a test for the population variance using the p-value approach. فتح الحزمة
افتح القفل للوصول البطاقات البالغ عددها 96 في هذه المجموعة.
فتح الحزمة
k this deck
73
Exhibit 11-6.A financial analyst examines the performance of two mutual funds and claims that the variances of the annual returns for the bond funds differ.To support his claim,he collects data on the annual returns (in percent)for the years 2001 through 2010.The analyst assumes that the annual returns for the two emerging market bond funds are normally distributed.Here are some relevant summary statistics. Refer to Exhibit 11-6.At α = 0.10,is the analyst's claim supported by the data using the critical value approach?
A)No,because the value of the test statistic is less than the critical F value.
B)Yes,because the value of the test statistic is less than the critical F value.
C)Yes,because the value of the test statistic is greater than the critical F value.
D)No,because the value of the test statistic is greater than the critical F value.
Refer to Exhibit 11-6.At α = 0.10,is the analyst's claim supported by the data using the critical value approach?A)No,because the value of the test statistic is less than the critical F value.
B)Yes,because the value of the test statistic is less than the critical F value.
C)Yes,because the value of the test statistic is greater than the critical F value.
D)No,because the value of the test statistic is greater than the critical F value.
فتح الحزمة
افتح القفل للوصول البطاقات البالغ عددها 96 في هذه المجموعة.
فتح الحزمة
k this deck
74
The following table shows the annual returns (in percent)for the Fidelity Utilities fund from 2006 through 2010.
A)Calculate the point estimate of σ.
B)Construct a 95% confidence interval of σ.
A)Calculate the point estimate of σ.
B)Construct a 95% confidence interval of σ.
فتح الحزمة
افتح القفل للوصول البطاقات البالغ عددها 96 في هذه المجموعة.
فتح الحزمة
k this deck
75
Find the value x for which:
A) b. c. d.
A)
b. c. d. فتح الحزمة
افتح القفل للوصول البطاقات البالغ عددها 96 في هذه المجموعة.
فتح الحزمة
k this deck
76
Exhibit 11-6.A financial analyst examines the performance of two mutual funds and claims that the variances of the annual returns for the bond funds differ.To support his claim,he collects data on the annual returns (in percent)for the years 2001 through 2010.The analyst assumes that the annual returns for the two emerging market bond funds are normally distributed.Here are some relevant summary statistics. Refer to Exhibit 11-6.For the competing hypotheses: since ,approximate the p-value for the test.
A)Less than 0.01
B)Between 0.01 and 0.025
C)Between 0.02 and 0.05
D)Between 0.05 and 0.10
Refer to Exhibit 11-6.For the competing hypotheses: since ,approximate the p-value for the test.A)Less than 0.01
B)Between 0.01 and 0.025
C)Between 0.02 and 0.05
D)Between 0.05 and 0.10
فتح الحزمة
افتح القفل للوصول البطاقات البالغ عددها 96 في هذه المجموعة.
فتح الحزمة
k this deck
77
Exhibit 11-6.A financial analyst examines the performance of two mutual funds and claims that the variances of the annual returns for the bond funds differ.To support his claim,he collects data on the annual returns (in percent)for the years 2001 through 2010.The analyst assumes that the annual returns for the two emerging market bond funds are normally distributed.Here are some relevant summary statistics. Refer to Exhibit 11-6.Repeat the hypothesis test, since .What is the critical F value at the 10% significance level?
A)
B)
C)
D)
Refer to Exhibit 11-6.Repeat the hypothesis test, since .What is the critical F value at the 10% significance level?A)
B)
C)
D)
فتح الحزمة
افتح القفل للوصول البطاقات البالغ عددها 96 في هذه المجموعة.
فتح الحزمة
k this deck
78
The sample mean and the sample standard deviation of annual returns on a stock over a 12-year period as computed by a stock analyst were 18% and 12%,respectively.The analyst wants to know if the risk,as measured by the standard deviation,differs from 15%.
A)Construct a 90% confidence interval of the population variance and the population standard deviation.
B)What assumption is required in constructing the confidence interval?
C)Based on the above confidence interval,does the risk differ from 15%?
A)Construct a 90% confidence interval of the population variance and the population standard deviation.
B)What assumption is required in constructing the confidence interval?
C)Based on the above confidence interval,does the risk differ from 15%?
فتح الحزمة
افتح القفل للوصول البطاقات البالغ عددها 96 في هذه المجموعة.
فتح الحزمة
k this deck
79
The following data,drawn from a normal population,is the waiting time (in minutes)of 12 randomly selected customers at a travel desk.
1.8,2.4,2.7,2.1,1.3,1.7,1.5,1.5,2.3,2.8,2.5,1.9
A)Calculate the point estimates of the population variance and the population standard deviation.
B)Compute a 90% confidence interval for the population variance and the population standard deviation.
1.8,2.4,2.7,2.1,1.3,1.7,1.5,1.5,2.3,2.8,2.5,1.9
A)Calculate the point estimates of the population variance and the population standard deviation.
B)Compute a 90% confidence interval for the population variance and the population standard deviation.
فتح الحزمة
افتح القفل للوصول البطاقات البالغ عددها 96 في هذه المجموعة.
فتح الحزمة
k this deck
80
Consider the following hypotheses: A sample variance of 98 is obtained from a random sample of 10 observations drawn from a normally distributed population.At 1% significance level,conduct a test for the population variance using the critical value approach.
A sample variance of 98 is obtained from a random sample of 10 observations drawn from a normally distributed population.At 1% significance level,conduct a test for the population variance using the critical value approach. فتح الحزمة
افتح القفل للوصول البطاقات البالغ عددها 96 في هذه المجموعة.
فتح الحزمة
k this deck
فتح الحزمة
افتح القفل للوصول البطاقات البالغ عددها 96 في هذه المجموعة.


