Deck 5: Scatterplots and Correlation
ملء الشاشة (f)
سؤال
An introductory statistics class decides to investigate whether there is a relationship between the performance on midterms 1 and 2. The instructor creates a scatterplot of midterm 2 scores (y) versus midterm 1 scores (x). 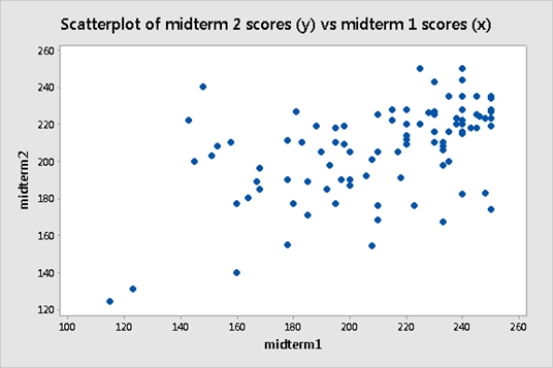 Based on the plot, which of the following is likely true?
A)The correlation between midterm 1 and midterm 2 scores is positive.
B)Students who did well on midterm 1 did not do so well on midterm 2, and vice versa.
C)There is no relationship between midterm 1 and midterm 2 performance.
D)None of the answer options is correct.
Based on the plot, which of the following is likely true?A)The correlation between midterm 1 and midterm 2 scores is positive.
B)Students who did well on midterm 1 did not do so well on midterm 2, and vice versa.
C)There is no relationship between midterm 1 and midterm 2 performance.
D)None of the answer options is correct.
سؤال
سؤال
سؤال
سؤال
سؤال
سؤال
The volume of oxygen consumed (in liters per minute) while a person is at rest and while a person is exercising (running on a treadmill) were both measured for 50 subjects. The goal is to determine if the volume of oxygen consumed during aerobic exercise can be estimated from the amount consumed at rest. The results are plotted below. 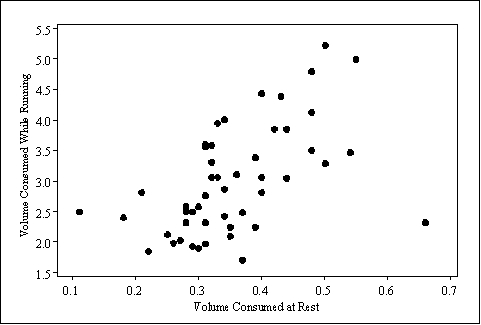 The scatterplot suggests that there is:
A)a positive association between the volume of oxygen consumed at rest and while running.
B)an outlier in the plot.
C)both a positive association between volume of oxygen consumed at rest and while running, and an outlier in the plot.
D)neither a positive association between volume of oxygen consumed at rest and while running, nor an outlier in the plot.
The scatterplot suggests that there is:A)a positive association between the volume of oxygen consumed at rest and while running.
B)an outlier in the plot.
C)both a positive association between volume of oxygen consumed at rest and while running, and an outlier in the plot.
D)neither a positive association between volume of oxygen consumed at rest and while running, nor an outlier in the plot.
سؤال
Below is a scatterplot of the number of home runs versus the number of stolen bases for major league teams in 2009. American League teams are represented by filled circles, and National League teams are represented by open circles. 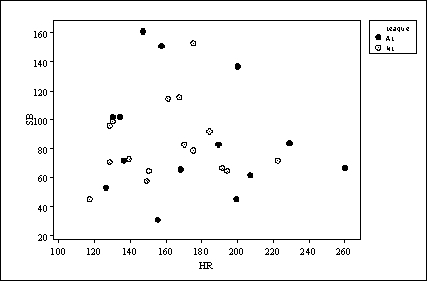 We conclude that:
A)there is a strong positive association for American League teams but a negative association for National League teams.
B)there is a strong negative association for American League teams but a positive association for National League teams.
C)there is no association for either league.
D)all American League teams hit more home runs and stole more bases than did National League teams.
We conclude that:A)there is a strong positive association for American League teams but a negative association for National League teams.
B)there is a strong negative association for American League teams but a positive association for National League teams.
C)there is no association for either league.
D)all American League teams hit more home runs and stole more bases than did National League teams.
سؤال
سؤال
When water flows across farmland, some soil is washed away, resulting in erosion. An experiment was conducted to investigate the effect of the rate of water flow (liters per second) on the amount of soil (kilograms) washed away. The data are given in the following table: 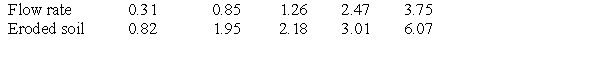 The association between flow rate and the amount of eroded soil is:
A)positive.
B)negative.
C)neither positive nor negative.
D)impossible to determine, because both variables are categorical.
The association between flow rate and the amount of eroded soil is:A)positive.
B)negative.
C)neither positive nor negative.
D)impossible to determine, because both variables are categorical.
سؤال
The graph below shows a scatterplot of midterm scores plotted against homework scores. The graph contains several points that correspond to unusually low homework scores, and one of those scores is associated with the highest midterm score. 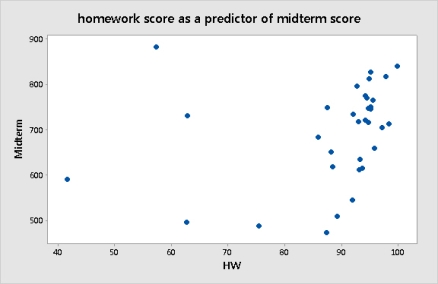 Removing this point will:
A)increase the correlation.
B)leave the correlation unchanged.
C)decrease the correlation.
D)The effect cannot be determined from the scatterplot.
Removing this point will:A)increase the correlation.
B)leave the correlation unchanged.
C)decrease the correlation.
D)The effect cannot be determined from the scatterplot.
سؤال
A student wonders if people with similar heights tend to date each other. She measures herself, her dormitory roommate, and the women in the adjoining rooms; then she measures the next man each woman dates. Here are the pairs of data (heights in inches):  Which of the following statements is true?
A)The variables measured are all categorical.
B)There is a strong positive correlation between the heights of men and women, because the women are always smaller than the men they date.
C)There is a positive correlation between the heights of men and women.
D)Correlation makes no sense here, because gender is a categorical variable.
Which of the following statements is true?A)The variables measured are all categorical.
B)There is a strong positive correlation between the heights of men and women, because the women are always smaller than the men they date.
C)There is a positive correlation between the heights of men and women.
D)Correlation makes no sense here, because gender is a categorical variable.
سؤال
The volume of oxygen consumed (in liters per minute) while a person is at rest and while a person is exercising (running on a treadmill) were both measured for 50 subjects. The goal is to determine if the volume of oxygen consumed during aerobic exercise can be estimated from the amount consumed at rest. The results are plotted below.  In this study, the explanatory variable is:
A)the volume of oxygen consumed at rest.
B)the volume of oxygen consumed while running.
C)the instrument used to measure the volume of oxygen consumed.
D)either variable-it doesn't matter which is considered the response.
In this study, the explanatory variable is:A)the volume of oxygen consumed at rest.
B)the volume of oxygen consumed while running.
C)the instrument used to measure the volume of oxygen consumed.
D)either variable-it doesn't matter which is considered the response.
سؤال
سؤال
For each menu item at a fast food restaurant, the fat content (in grams) and the number of calories were recorded. A scatterplot of these data is given:  A plausible value for the correlation between fat content and number of calories is:
A)+0.2.
B)-0.9.
C)+0.9.
D)-1.0.
A plausible value for the correlation between fat content and number of calories is:A)+0.2.
B)-0.9.
C)+0.9.
D)-1.0.
سؤال
سؤال
سؤال
The volume of oxygen consumed (in liters per minute) while a person is at rest and while a person is exercising (running on a treadmill) were both measured for 50 subjects. The goal is to determine if the volume of oxygen consumed during aerobic exercise can be estimated from the amount consumed at rest. The results are plotted below.  If the outlier is removed, the correlation coefficient r will:
A)increase.
B)decrease.
C)neither increase nor decrease.
D)There is not enough information to determine the effect on r.
If the outlier is removed, the correlation coefficient r will:A)increase.
B)decrease.
C)neither increase nor decrease.
D)There is not enough information to determine the effect on r.
سؤال
سؤال
سؤال
Consider the following scatterplot of two variables x and y. 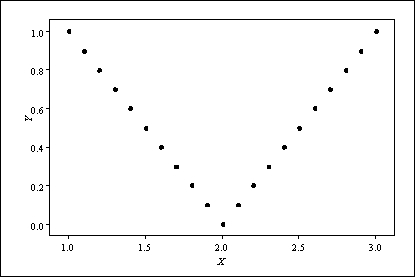 We may conclude:
A)the correlation between x and y must be close to 1, because there is a nearly perfect relation between them.
B)the correlation between x and y must be close to -1, because there is a nearly perfect relation between them but it is not a straight line relation.
C)the correlation between x and y is close to 0 because, although there is a strong relationship between these variables, it isn't a linear relationship.
D)the correlation between x and y could be any number between -1 and +1; we can say nothing more without knowing the actual values.
We may conclude:A)the correlation between x and y must be close to 1, because there is a nearly perfect relation between them.
B)the correlation between x and y must be close to -1, because there is a nearly perfect relation between them but it is not a straight line relation.
C)the correlation between x and y is close to 0 because, although there is a strong relationship between these variables, it isn't a linear relationship.
D)the correlation between x and y could be any number between -1 and +1; we can say nothing more without knowing the actual values.
سؤال
سؤال
An economist conducted a study of the possible association between weekly income and weekly grocery expenditures. The particular interest was whether higher income would cause shoppers to spend more on groceries. A random sample of shoppers at a local supermarket was obtained. A questionnaire was administered asking about the weekly income of each shopper's family and their grocery bill for that week. The data below are for 10 selected survey participants: 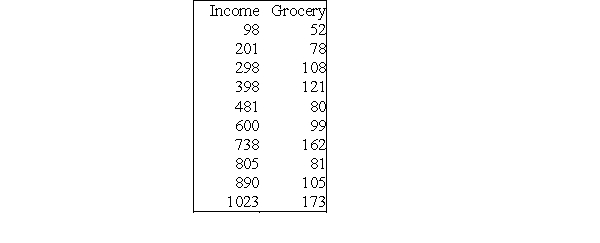 The scatterplot with a linear trend line is given below:
 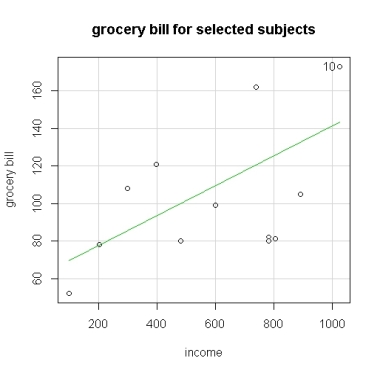 If the expenditure for subject 7 is decreased and for subject 8 is increased, the effect on the correlation:
A)will be to decrease it.
B)will be to increase it.
C)will be no effect.
D)cannot be determined without knowing the new values for expenditure.
The scatterplot with a linear trend line is given below: If the expenditure for subject 7 is decreased and for subject 8 is increased, the effect on the correlation:A)will be to decrease it.
B)will be to increase it.
C)will be no effect.
D)cannot be determined without knowing the new values for expenditure.
سؤال
سؤال
Frequent food questionnaires (FFQ) are a simple way to obtain information on the foods individuals consume by asking them questions about typical amounts of food consumed in a day, a week, or a month. A more accurate picture is obtained by obtaining a detailed food diary (DR) for several days that are randomly chosen over a certain time period. The data obtained from a frequent food questionnaire can be compared with the food diary to assess the validity of the questionnaire. The correlation between alcohol consumption from the food questionnaire and diary was r = 0.89, based on seven individuals: 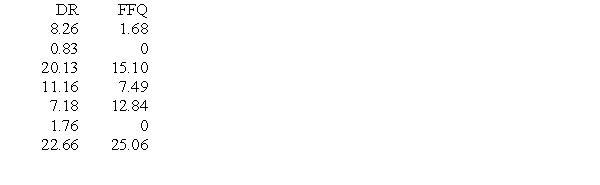 Based on the seven individuals for whom data are available, which of the following statements is incorrect?
A)Typical consumption, as stated on the FFQ, is positively associated with what is actually consumed.
B)The FFQ is a reasonable tool to obtain information on the amount of alcohol consumed by individuals.
C)Because r > 0, the amount that is truly consumed is always larger than what is stated on the FFQ.
D)All of the answer options are correct.
Based on the seven individuals for whom data are available, which of the following statements is incorrect?A)Typical consumption, as stated on the FFQ, is positively associated with what is actually consumed.
B)The FFQ is a reasonable tool to obtain information on the amount of alcohol consumed by individuals.
C)Because r > 0, the amount that is truly consumed is always larger than what is stated on the FFQ.
D)All of the answer options are correct.
سؤال
For each menu item at a fast food restaurant, the fat content (in grams) and the number of calories were recorded. A scatterplot of these data is given: 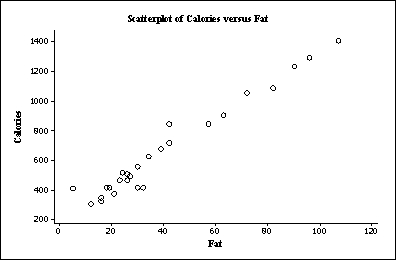 The restaurant decides to add six new high-calorie, low-fat pasta dishes to its menu. What is a plausible value for the new correlation coefficient describing the relationship between fat and calories?
A)+0.2
B)-0.2
C)+0.7
D)-0.7
The restaurant decides to add six new high-calorie, low-fat pasta dishes to its menu. What is a plausible value for the new correlation coefficient describing the relationship between fat and calories?A)+0.2
B)-0.2
C)+0.7
D)-0.7
سؤال
سؤال
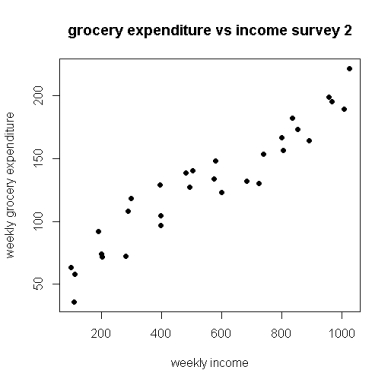
An economist conducted a study of the possible association between weekly income and weekly grocery expenditures. Of particular interest was whether higher income would result in shoppers spending more on groceries. A random sample of shoppers at a local supermarket was obtained. A questionnaire was administered asking about the weekly income of each shopper's family and their grocery bill for that week. 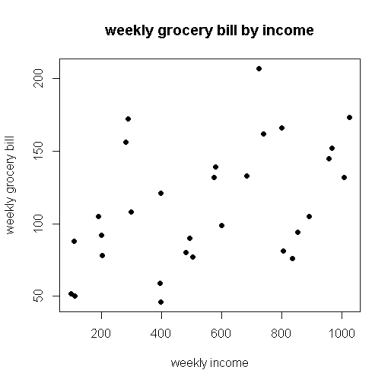 The scatterplot of weekly grocery expenditures vs. income shows:
A)a weak positive association between the two variables.
B)a weak negative association between the two variables.
C)a strong positive association between the two variables.
D)a strong negative association between the two variables.
The scatterplot of weekly grocery expenditures vs. income shows:A)a weak positive association between the two variables.
B)a weak negative association between the two variables.
C)a strong positive association between the two variables.
D)a strong negative association between the two variables.
سؤال
سؤال
Consider the following scatterplot, which depicts the tread depth (measured in mils, where 1 mil = 0.001 inch) versus the number of miles driven on the tire (measured in thousands of miles). 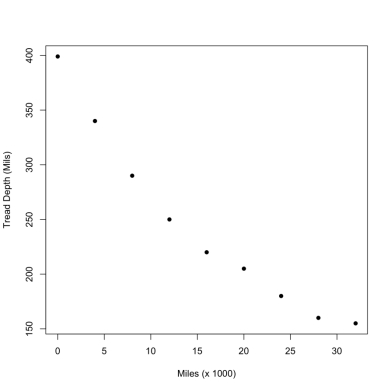 The correlation between x and y:
A)is approximately 0.97.
B)is approximately -0.97.
C)is approximately 0.
D)cannot be computed because the trend is curved.
The correlation between x and y:A)is approximately 0.97.
B)is approximately -0.97.
C)is approximately 0.
D)cannot be computed because the trend is curved.
سؤال
سؤال
An economist conducted a study of the possible association between weekly income and weekly grocery expenditures. The particular interest was whether higher income would cause shoppers to spend more on groceries. A random sample of shoppers at a local supermarket was obtained. A questionnaire was administered asking about the weekly income of each shopper's family and their grocery bill for that week. A second survey was conducted at a different supermarket, and the scatterplot was obtained for the relationship between grocery expenditures and incomes in that survey as well. The two scatterplots are given below: 
 Which of the following statements is true?
A)The correlations for both surveys are similar in magnitude.
B)The correlation is closer to 1 in survey 1 than in survey 2.
C)The correlation is closer to 0 in survey 1 than in survey 2.
D)The correlations need to be calculated to determine which is closer to 1; a scatterplot cannot provide this information.
Which of the following statements is true?A)The correlations for both surveys are similar in magnitude.
B)The correlation is closer to 1 in survey 1 than in survey 2.
C)The correlation is closer to 0 in survey 1 than in survey 2.
D)The correlations need to be calculated to determine which is closer to 1; a scatterplot cannot provide this information.
سؤال
An economist conducted a study of the possible association between weekly income and weekly grocery expenditures. Of particular interest was whether higher income would result in shoppers spending more on groceries. A random sample of shoppers at a local supermarket was obtained. A questionnaire was administered asking about the weekly income of each shopper's family and their grocery bill for that week. The gender of each shopper was also obtained. One question of interest was whether spending patterns differed much by gender. 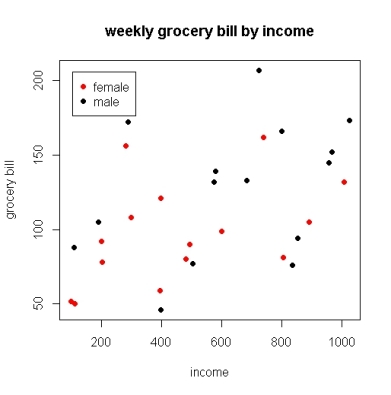 The scatterplot above shows red dots for females and black dots for males. Based on this plot:
A)males and females exhibit similar weak positive relationships between income and grocery expenditures.
B)males tend to spend more as income rises, while females spend the same whether income is high or low.
C)males spend more as income rises, while females spend less as income rises.
D)None of the answer options is correct.
The scatterplot above shows red dots for females and black dots for males. Based on this plot:A)males and females exhibit similar weak positive relationships between income and grocery expenditures.
B)males tend to spend more as income rises, while females spend the same whether income is high or low.
C)males spend more as income rises, while females spend less as income rises.
D)None of the answer options is correct.
سؤال
An economist conducted a study of the possible association between weekly income and weekly grocery expenditures. The particular interest was whether higher income would cause shoppers to spend more on groceries. A random sample of shoppers at a local supermarket was obtained. A questionnaire was administered asking about the weekly income of each shopper's family and their grocery bill for that week. The gender of each shopper was also obtained. The data below are expenditures and income for 10 selected survey participants. 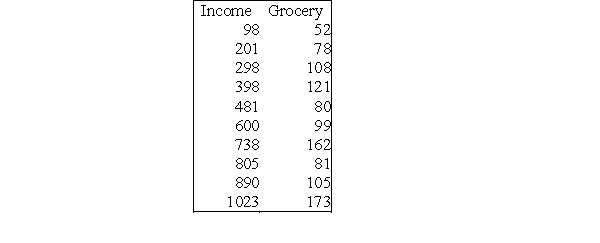 The correlation for these data is given by:
A)0.649.
B)-0.649.
C)0.4212.
D)-0.4212.
The correlation for these data is given by:A)0.649.
B)-0.649.
C)0.4212.
D)-0.4212.

فتح الحزمة
قم بالتسجيل لفتح البطاقات في هذه المجموعة!
Unlock Deck
Unlock Deck
1/34
العب
ملء الشاشة (f)
Deck 5: Scatterplots and Correlation
1
An introductory statistics class decides to investigate whether there is a relationship between the performance on midterms 1 and 2. The instructor creates a scatterplot of midterm 2 scores (y) versus midterm 1 scores (x). Based on the plot, which of the following is likely true?
A)The correlation between midterm 1 and midterm 2 scores is positive.
B)Students who did well on midterm 1 did not do so well on midterm 2, and vice versa.
C)There is no relationship between midterm 1 and midterm 2 performance.
D)None of the answer options is correct.
Based on the plot, which of the following is likely true?A)The correlation between midterm 1 and midterm 2 scores is positive.
B)Students who did well on midterm 1 did not do so well on midterm 2, and vice versa.
C)There is no relationship between midterm 1 and midterm 2 performance.
D)None of the answer options is correct.
The correlation between midterm 1 and midterm 2 scores is positive.
2
What can be said of the correlation between the brand of an automobile and its quality?
A)The correlation is negative, because smaller cars tend to have higher quality and larger cars tend to have lower quality.
B)The correlation is positive, because better brands have higher quality.
C)If the correlation is negative, an arithmetic mistake was made; correlation must be positive.
D)Correlation makes no sense here, because brand is a categorical variable.
Correlation makes no sense here, because brand is a categorical variable.
3
A researcher states that bone density in women is negatively associated with age. This means that:
A)as women get older, bone density tends to decrease.
B)as women get older, bone density tends to increase.
C)below-average values of age tend to accompany below-average values of bone density.
D)older women aren't any more likely than younger women to have below-average bone density.
A)as women get older, bone density tends to decrease.
B)as women get older, bone density tends to increase.
C)below-average values of age tend to accompany below-average values of bone density.
D)older women aren't any more likely than younger women to have below-average bone density.
as women get older, bone density tends to decrease.
4
Archaeologists often find only parts of ancient human remains. For example, they may find a small finger bone, called the metacarpal bone. Is it possible to predict the height of a human from the length of a metacarpal bone? To investigate, a researcher measures the heights and metacarpal lengths of 200 adults. In making the scatterplot, the researcher should:
A)plot the height of the person on the horizontal axis.
B)plot the metacarpal length on the horizontal axis.
C)first determine if the heights of humans follow a Normal distribution.
D)use a plotting scale that makes the overall trend roughly linear.
A)plot the height of the person on the horizontal axis.
B)plot the metacarpal length on the horizontal axis.
C)first determine if the heights of humans follow a Normal distribution.
D)use a plotting scale that makes the overall trend roughly linear.
فتح الحزمة
افتح القفل للوصول البطاقات البالغ عددها 34 في هذه المجموعة.
فتح الحزمة
k this deck
5
Are higher than average sea surface temperatures associated with a greater than average number of hurricanes each year? In a 2010 study, the average global sea surface temperature anomaly was recorded, along with the number of Atlantic hurricanes above or below the average for that year. The response variable is:
A)the number of hurricanes above or below average.
B)the global sea surface temperature anomaly.
C)the number of hurricanes used in the study.
D)None of the answer options is correct.
A)the number of hurricanes above or below average.
B)the global sea surface temperature anomaly.
C)the number of hurricanes used in the study.
D)None of the answer options is correct.
فتح الحزمة
افتح القفل للوصول البطاقات البالغ عددها 34 في هذه المجموعة.
فتح الحزمة
k this deck
6
A group of students participated in an experiment to study the association between resting heart rate and exercise heart rate under various exercise conditions. Study participants stepped at a frequency of 14 steps per minute (0), 21 steps per minute (1), and 28 steps per minute (2). To investigate the relationship between resting and exercise heart rate, and to see the effects of step frequency on the relationship, a scatterplot might be created by:
A)plotting resting heart rate on the y axis and exercise heart rate on the x axis.
B)plotting exercise heart rate on the y axis and step frequency on the x axis.
C)using separate symbols for the different step frequencies to see if the relationship is affected by step frequency, while plotting resting heart rate on the x axis and exercise heart rate on the y axis.
D)None of the answer options is correct.
فتح الحزمة
افتح القفل للوصول البطاقات البالغ عددها 34 في هذه المجموعة.
فتح الحزمة
k this deck
7
The volume of oxygen consumed (in liters per minute) while a person is at rest and while a person is exercising (running on a treadmill) were both measured for 50 subjects. The goal is to determine if the volume of oxygen consumed during aerobic exercise can be estimated from the amount consumed at rest. The results are plotted below. The scatterplot suggests that there is:
A)a positive association between the volume of oxygen consumed at rest and while running.
B)an outlier in the plot.
C)both a positive association between volume of oxygen consumed at rest and while running, and an outlier in the plot.
D)neither a positive association between volume of oxygen consumed at rest and while running, nor an outlier in the plot.
The scatterplot suggests that there is:A)a positive association between the volume of oxygen consumed at rest and while running.
B)an outlier in the plot.
C)both a positive association between volume of oxygen consumed at rest and while running, and an outlier in the plot.
D)neither a positive association between volume of oxygen consumed at rest and while running, nor an outlier in the plot.
فتح الحزمة
افتح القفل للوصول البطاقات البالغ عددها 34 في هذه المجموعة.
فتح الحزمة
k this deck
8
Below is a scatterplot of the number of home runs versus the number of stolen bases for major league teams in 2009. American League teams are represented by filled circles, and National League teams are represented by open circles. We conclude that:
A)there is a strong positive association for American League teams but a negative association for National League teams.
B)there is a strong negative association for American League teams but a positive association for National League teams.
C)there is no association for either league.
D)all American League teams hit more home runs and stole more bases than did National League teams.
We conclude that:A)there is a strong positive association for American League teams but a negative association for National League teams.
B)there is a strong negative association for American League teams but a positive association for National League teams.
C)there is no association for either league.
D)all American League teams hit more home runs and stole more bases than did National League teams.
فتح الحزمة
افتح القفل للوصول البطاقات البالغ عددها 34 في هذه المجموعة.
فتح الحزمة
k this deck
9
Colleges often rely heavily on raising money for an "annual fund" to support operations. Alumni are typically solicited for donations to the annual fund. Studies suggest that the graduate's annual income is a good predictor of the amount of money he or she would be willing to donate, and there is a reasonably strong, positive, linear relationship between these variables. In the studies described:
A)annual income is an explanatory variable.
B)the correlation between annual income and the size of the donation is positive.
C)the size of the donation to the annual fund is the response variable.
D)All of the answer options are correct.
A)annual income is an explanatory variable.
B)the correlation between annual income and the size of the donation is positive.
C)the size of the donation to the annual fund is the response variable.
D)All of the answer options are correct.
فتح الحزمة
افتح القفل للوصول البطاقات البالغ عددها 34 في هذه المجموعة.
فتح الحزمة
k this deck
10
When water flows across farmland, some soil is washed away, resulting in erosion. An experiment was conducted to investigate the effect of the rate of water flow (liters per second) on the amount of soil (kilograms) washed away. The data are given in the following table: The association between flow rate and the amount of eroded soil is:
A)positive.
B)negative.
C)neither positive nor negative.
D)impossible to determine, because both variables are categorical.
The association between flow rate and the amount of eroded soil is:A)positive.
B)negative.
C)neither positive nor negative.
D)impossible to determine, because both variables are categorical.
فتح الحزمة
افتح القفل للوصول البطاقات البالغ عددها 34 في هذه المجموعة.
فتح الحزمة
k this deck
11
The graph below shows a scatterplot of midterm scores plotted against homework scores. The graph contains several points that correspond to unusually low homework scores, and one of those scores is associated with the highest midterm score. Removing this point will:
A)increase the correlation.
B)leave the correlation unchanged.
C)decrease the correlation.
D)The effect cannot be determined from the scatterplot.
Removing this point will:A)increase the correlation.
B)leave the correlation unchanged.
C)decrease the correlation.
D)The effect cannot be determined from the scatterplot.
فتح الحزمة
افتح القفل للوصول البطاقات البالغ عددها 34 في هذه المجموعة.
فتح الحزمة
k this deck
12
A student wonders if people with similar heights tend to date each other. She measures herself, her dormitory roommate, and the women in the adjoining rooms; then she measures the next man each woman dates. Here are the pairs of data (heights in inches): Which of the following statements is true?
A)The variables measured are all categorical.
B)There is a strong positive correlation between the heights of men and women, because the women are always smaller than the men they date.
C)There is a positive correlation between the heights of men and women.
D)Correlation makes no sense here, because gender is a categorical variable.
Which of the following statements is true?A)The variables measured are all categorical.
B)There is a strong positive correlation between the heights of men and women, because the women are always smaller than the men they date.
C)There is a positive correlation between the heights of men and women.
D)Correlation makes no sense here, because gender is a categorical variable.
فتح الحزمة
افتح القفل للوصول البطاقات البالغ عددها 34 في هذه المجموعة.
فتح الحزمة
k this deck
13
The volume of oxygen consumed (in liters per minute) while a person is at rest and while a person is exercising (running on a treadmill) were both measured for 50 subjects. The goal is to determine if the volume of oxygen consumed during aerobic exercise can be estimated from the amount consumed at rest. The results are plotted below. In this study, the explanatory variable is:
A)the volume of oxygen consumed at rest.
B)the volume of oxygen consumed while running.
C)the instrument used to measure the volume of oxygen consumed.
D)either variable-it doesn't matter which is considered the response.
In this study, the explanatory variable is:A)the volume of oxygen consumed at rest.
B)the volume of oxygen consumed while running.
C)the instrument used to measure the volume of oxygen consumed.
D)either variable-it doesn't matter which is considered the response.
فتح الحزمة
افتح القفل للوصول البطاقات البالغ عددها 34 في هذه المجموعة.
فتح الحزمة
k this deck
14
Which of the following statements is correct?
A)Changing the units of measurement of x or y does not change the value of the correlation r.
B)A negative value for the correlation r indicates the data are strongly unassociated.
C)The correlation always has the same units as the x variable but not the y variable.
D)The correlation always has the same units as the y variable but not the x variable.
فتح الحزمة
افتح القفل للوصول البطاقات البالغ عددها 34 في هذه المجموعة.
فتح الحزمة
k this deck
15
For each menu item at a fast food restaurant, the fat content (in grams) and the number of calories were recorded. A scatterplot of these data is given: A plausible value for the correlation between fat content and number of calories is:
A)+0.2.
B)-0.9.
C)+0.9.
D)-1.0.
A plausible value for the correlation between fat content and number of calories is:A)+0.2.
B)-0.9.
C)+0.9.
D)-1.0.
فتح الحزمة
افتح القفل للوصول البطاقات البالغ عددها 34 في هذه المجموعة.
فتح الحزمة
k this deck
16
A scatterplot can be used to illustrate the relationship between:
A)two categorical variables.
B)one categorical variable and one quantitative variable.
C)two quantitative variables.
D)All of the answer options are correct.
A)two categorical variables.
B)one categorical variable and one quantitative variable.
C)two quantitative variables.
D)All of the answer options are correct.
فتح الحزمة
افتح القفل للوصول البطاقات البالغ عددها 34 في هذه المجموعة.
فتح الحزمة
k this deck
17
A scatterplot of the amount of alcohol consumed according to a food diary (DR) against the amount of alcohol consumed on a frequent food questionnaire (FFQ):
A)shows the relationship between the answers from the DR and the FFQ.
B)assesses whether the relationship between the answers on the DR and the FFQ is positive.
C)shows the answers each study participant gave on the FFQ and the DR.
D)All of the answer options are correct.
A)shows the relationship between the answers from the DR and the FFQ.
B)assesses whether the relationship between the answers on the DR and the FFQ is positive.
C)shows the answers each study participant gave on the FFQ and the DR.
D)All of the answer options are correct.
فتح الحزمة
افتح القفل للوصول البطاقات البالغ عددها 34 في هذه المجموعة.
فتح الحزمة
k this deck
18
The volume of oxygen consumed (in liters per minute) while a person is at rest and while a person is exercising (running on a treadmill) were both measured for 50 subjects. The goal is to determine if the volume of oxygen consumed during aerobic exercise can be estimated from the amount consumed at rest. The results are plotted below. If the outlier is removed, the correlation coefficient r will:
A)increase.
B)decrease.
C)neither increase nor decrease.
D)There is not enough information to determine the effect on r.
If the outlier is removed, the correlation coefficient r will:A)increase.
B)decrease.
C)neither increase nor decrease.
D)There is not enough information to determine the effect on r.
فتح الحزمة
افتح القفل للوصول البطاقات البالغ عددها 34 في هذه المجموعة.
فتح الحزمة
k this deck
19
A researcher measures the correlation between two variables. This correlation tells us:
A)whether there is a relation between two variables.
B)whether a scatterplot shows an interesting pattern.
C)whether a cause-and-effect relation exists between two variables.
D)the strength and direction of a linear association between two variables.
A)whether there is a relation between two variables.
B)whether a scatterplot shows an interesting pattern.
C)whether a cause-and-effect relation exists between two variables.
D)the strength and direction of a linear association between two variables.
فتح الحزمة
افتح القفل للوصول البطاقات البالغ عددها 34 في هذه المجموعة.
فتح الحزمة
k this deck
20
Does exposure to classical music (through instrument lessons or concert attendance) improve a child's scholastic performance? In a study, researchers measured the amount of exposure to classical music for a group of children, along with their scores on the state's academic proficiency exam. The explanatory variable in this study is:
A)the type of instrument a child plays.
B)the child's score on the state's proficiency exam.
C)the amount of exposure a child has to classical music.
D)whether a child passed the state's proficiency exam.
A)the type of instrument a child plays.
B)the child's score on the state's proficiency exam.
C)the amount of exposure a child has to classical music.
D)whether a child passed the state's proficiency exam.
فتح الحزمة
افتح القفل للوصول البطاقات البالغ عددها 34 في هذه المجموعة.
فتح الحزمة
k this deck
21
Consider the following scatterplot of two variables x and y. We may conclude:
A)the correlation between x and y must be close to 1, because there is a nearly perfect relation between them.
B)the correlation between x and y must be close to -1, because there is a nearly perfect relation between them but it is not a straight line relation.
C)the correlation between x and y is close to 0 because, although there is a strong relationship between these variables, it isn't a linear relationship.
D)the correlation between x and y could be any number between -1 and +1; we can say nothing more without knowing the actual values.
We may conclude:A)the correlation between x and y must be close to 1, because there is a nearly perfect relation between them.
B)the correlation between x and y must be close to -1, because there is a nearly perfect relation between them but it is not a straight line relation.
C)the correlation between x and y is close to 0 because, although there is a strong relationship between these variables, it isn't a linear relationship.
D)the correlation between x and y could be any number between -1 and +1; we can say nothing more without knowing the actual values.
فتح الحزمة
افتح القفل للوصول البطاقات البالغ عددها 34 في هذه المجموعة.
فتح الحزمة
k this deck
22
An economist conducted a study of the possible association between weekly income and weekly grocery expenditures. Of particular interest was whether higher income would result in shoppers spending more on groceries. A random sample of shoppers at a local supermarket was obtained. A questionnaire was administered asking about the weekly income of each shopper's family and their grocery bill for that week. A graphical display of the relationship between grocery expenditure and income might be:
A)a side-by-side histogram.
B)a side-by-side boxplot.
C)a side-by-side pie chart.
D)None of the answer options is correct.
A)a side-by-side histogram.
B)a side-by-side boxplot.
C)a side-by-side pie chart.
D)None of the answer options is correct.
فتح الحزمة
افتح القفل للوصول البطاقات البالغ عددها 34 في هذه المجموعة.
فتح الحزمة
k this deck
23
An economist conducted a study of the possible association between weekly income and weekly grocery expenditures. The particular interest was whether higher income would cause shoppers to spend more on groceries. A random sample of shoppers at a local supermarket was obtained. A questionnaire was administered asking about the weekly income of each shopper's family and their grocery bill for that week. The data below are for 10 selected survey participants: The scatterplot with a linear trend line is given below: If the expenditure for subject 7 is decreased and for subject 8 is increased, the effect on the correlation:
A)will be to decrease it.
B)will be to increase it.
C)will be no effect.
D)cannot be determined without knowing the new values for expenditure.
The scatterplot with a linear trend line is given below: If the expenditure for subject 7 is decreased and for subject 8 is increased, the effect on the correlation:A)will be to decrease it.
B)will be to increase it.
C)will be no effect.
D)cannot be determined without knowing the new values for expenditure.
فتح الحزمة
افتح القفل للوصول البطاقات البالغ عددها 34 في هذه المجموعة.
فتح الحزمة
k this deck
24
Which of the following statements is false?
A)Older men tend to have lower muscle density, so the correlation between age and muscle density in older men must be negative.
B)Older children tend to be taller than younger children, so the correlation between age and height in children must be positive.
C)A researcher finds that the correlation between two variables is close to 0, so the two variables must be unrelated.
D)Taller people tend to be heavier than shorter people, so the correlation between height and weight must be positive.
فتح الحزمة
افتح القفل للوصول البطاقات البالغ عددها 34 في هذه المجموعة.
فتح الحزمة
k this deck
25
Frequent food questionnaires (FFQ) are a simple way to obtain information on the foods individuals consume by asking them questions about typical amounts of food consumed in a day, a week, or a month. A more accurate picture is obtained by obtaining a detailed food diary (DR) for several days that are randomly chosen over a certain time period. The data obtained from a frequent food questionnaire can be compared with the food diary to assess the validity of the questionnaire. The correlation between alcohol consumption from the food questionnaire and diary was r = 0.89, based on seven individuals: Based on the seven individuals for whom data are available, which of the following statements is incorrect?
A)Typical consumption, as stated on the FFQ, is positively associated with what is actually consumed.
B)The FFQ is a reasonable tool to obtain information on the amount of alcohol consumed by individuals.
C)Because r > 0, the amount that is truly consumed is always larger than what is stated on the FFQ.
D)All of the answer options are correct.
Based on the seven individuals for whom data are available, which of the following statements is incorrect?A)Typical consumption, as stated on the FFQ, is positively associated with what is actually consumed.
B)The FFQ is a reasonable tool to obtain information on the amount of alcohol consumed by individuals.
C)Because r > 0, the amount that is truly consumed is always larger than what is stated on the FFQ.
D)All of the answer options are correct.
فتح الحزمة
افتح القفل للوصول البطاقات البالغ عددها 34 في هذه المجموعة.
فتح الحزمة
k this deck
26
For each menu item at a fast food restaurant, the fat content (in grams) and the number of calories were recorded. A scatterplot of these data is given: The restaurant decides to add six new high-calorie, low-fat pasta dishes to its menu. What is a plausible value for the new correlation coefficient describing the relationship between fat and calories?
A)+0.2
B)-0.2
C)+0.7
D)-0.7
The restaurant decides to add six new high-calorie, low-fat pasta dishes to its menu. What is a plausible value for the new correlation coefficient describing the relationship between fat and calories?A)+0.2
B)-0.2
C)+0.7
D)-0.7
فتح الحزمة
افتح القفل للوصول البطاقات البالغ عددها 34 في هذه المجموعة.
فتح الحزمة
k this deck
27
An economist conducted a study of the possible association between weekly income and weekly grocery expenditures. Of particular interest was whether higher income would result in shoppers to spending more on groceries. A random sample of shoppers at a local supermarket was obtained. A questionnaire was administered asking about the weekly income of each shopper's family and their grocery bill for that week. The explanatory variable is:
A)weekly income.
B)weekly expenditure.
C)gender
D)All of the answer options are correct.
A)weekly income.
B)weekly expenditure.
C)gender
D)All of the answer options are correct.
فتح الحزمة
افتح القفل للوصول البطاقات البالغ عددها 34 في هذه المجموعة.
فتح الحزمة
k this deck
28
An economist conducted a study of the possible association between weekly income and weekly grocery expenditures. Of particular interest was whether higher income would result in shoppers spending more on groceries. A random sample of shoppers at a local supermarket was obtained. A questionnaire was administered asking about the weekly income of each shopper's family and their grocery bill for that week. The scatterplot of weekly grocery expenditures vs. income shows:
A)a weak positive association between the two variables.
B)a weak negative association between the two variables.
C)a strong positive association between the two variables.
D)a strong negative association between the two variables.
The scatterplot of weekly grocery expenditures vs. income shows:A)a weak positive association between the two variables.
B)a weak negative association between the two variables.
C)a strong positive association between the two variables.
D)a strong negative association between the two variables.
فتح الحزمة
افتح القفل للوصول البطاقات البالغ عددها 34 في هذه المجموعة.
فتح الحزمة
k this deck
29
An economist conducted a study of the possible association between weekly income and weekly grocery expenditures. The particular interest was whether higher income would cause shoppers to spend more on groceries. A random sample of shoppers at a local supermarket was obtained. A questionnaire was administered asking about the weekly income of each shopper's family and their grocery bill for that week. The gender of each shopper was also obtained. The relationship between grocery expenditure and income was assessed by calculating both a correlation for the females only and a correlation for the males only. For the females, r = 0.45 and for the males, r = 0.38. We conclude that:
A)the relationship between grocery expenditures and income is stronger for males.
B)the relationship between grocery expenditures and income is the same for males and females.
C)the relationship between grocery expenditures and income is stronger for females.
D)there is not enough information to determine which gender has a stronger relationship between grocery expenditures and income.
فتح الحزمة
افتح القفل للوصول البطاقات البالغ عددها 34 في هذه المجموعة.
فتح الحزمة
k this deck
30
Consider the following scatterplot, which depicts the tread depth (measured in mils, where 1 mil = 0.001 inch) versus the number of miles driven on the tire (measured in thousands of miles). The correlation between x and y:
A)is approximately 0.97.
B)is approximately -0.97.
C)is approximately 0.
D)cannot be computed because the trend is curved.
The correlation between x and y:A)is approximately 0.97.
B)is approximately -0.97.
C)is approximately 0.
D)cannot be computed because the trend is curved.
فتح الحزمة
افتح القفل للوصول البطاقات البالغ عددها 34 في هذه المجموعة.
فتح الحزمة
k this deck
31
An economist conducted a study of the possible association between weekly income and weekly grocery expenditures. Of particular interest was whether higher income would result in shoppers spending more on groceries. A random sample of shoppers at a local supermarket was obtained. A questionnaire was administered asking about the weekly income of each shopper's family and their grocery bill for that week. The response variable is:
A)weekly income.
B)weekly expenditure.
C)gender.
D)None of the answer options is correct.
A)weekly income.
B)weekly expenditure.
C)gender.
D)None of the answer options is correct.
فتح الحزمة
افتح القفل للوصول البطاقات البالغ عددها 34 في هذه المجموعة.
فتح الحزمة
k this deck
32
An economist conducted a study of the possible association between weekly income and weekly grocery expenditures. The particular interest was whether higher income would cause shoppers to spend more on groceries. A random sample of shoppers at a local supermarket was obtained. A questionnaire was administered asking about the weekly income of each shopper's family and their grocery bill for that week. A second survey was conducted at a different supermarket, and the scatterplot was obtained for the relationship between grocery expenditures and incomes in that survey as well. The two scatterplots are given below: Which of the following statements is true?
A)The correlations for both surveys are similar in magnitude.
B)The correlation is closer to 1 in survey 1 than in survey 2.
C)The correlation is closer to 0 in survey 1 than in survey 2.
D)The correlations need to be calculated to determine which is closer to 1; a scatterplot cannot provide this information.
Which of the following statements is true?A)The correlations for both surveys are similar in magnitude.
B)The correlation is closer to 1 in survey 1 than in survey 2.
C)The correlation is closer to 0 in survey 1 than in survey 2.
D)The correlations need to be calculated to determine which is closer to 1; a scatterplot cannot provide this information.
فتح الحزمة
افتح القفل للوصول البطاقات البالغ عددها 34 في هذه المجموعة.
فتح الحزمة
k this deck
33
An economist conducted a study of the possible association between weekly income and weekly grocery expenditures. Of particular interest was whether higher income would result in shoppers spending more on groceries. A random sample of shoppers at a local supermarket was obtained. A questionnaire was administered asking about the weekly income of each shopper's family and their grocery bill for that week. The gender of each shopper was also obtained. One question of interest was whether spending patterns differed much by gender. The scatterplot above shows red dots for females and black dots for males. Based on this plot:
A)males and females exhibit similar weak positive relationships between income and grocery expenditures.
B)males tend to spend more as income rises, while females spend the same whether income is high or low.
C)males spend more as income rises, while females spend less as income rises.
D)None of the answer options is correct.
The scatterplot above shows red dots for females and black dots for males. Based on this plot:A)males and females exhibit similar weak positive relationships between income and grocery expenditures.
B)males tend to spend more as income rises, while females spend the same whether income is high or low.
C)males spend more as income rises, while females spend less as income rises.
D)None of the answer options is correct.
فتح الحزمة
افتح القفل للوصول البطاقات البالغ عددها 34 في هذه المجموعة.
فتح الحزمة
k this deck
34
An economist conducted a study of the possible association between weekly income and weekly grocery expenditures. The particular interest was whether higher income would cause shoppers to spend more on groceries. A random sample of shoppers at a local supermarket was obtained. A questionnaire was administered asking about the weekly income of each shopper's family and their grocery bill for that week. The gender of each shopper was also obtained. The data below are expenditures and income for 10 selected survey participants. The correlation for these data is given by:
A)0.649.
B)-0.649.
C)0.4212.
D)-0.4212.
The correlation for these data is given by:A)0.649.
B)-0.649.
C)0.4212.
D)-0.4212.
فتح الحزمة
افتح القفل للوصول البطاقات البالغ عددها 34 في هذه المجموعة.
فتح الحزمة
k this deck
فتح الحزمة
افتح القفل للوصول البطاقات البالغ عددها 34 في هذه المجموعة.


