Deck 6: Two-Way Tables
ملء الشاشة (f)
سؤال
سؤال
A study was conducted on horses to identify factors that might contribute to the formation of enteroliths-stones that form in the colon of the horse and eventually lead to blockage and death. The table below summarizes disease status by sex (gelding, mare, and stallion). 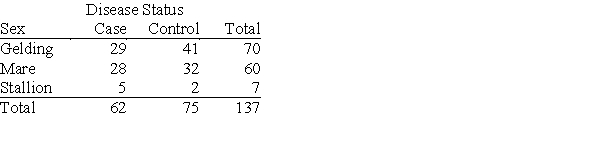 Which of the following statements is not supported by the data?
A)Mares are more likely than geldings to develop enteroliths.
B)Less than half of geldings develop enteroliths.
C)Stallions are the least likely to develop enteroliths.
D)Female horses are slightly more likely to develop enteroliths.
Which of the following statements is not supported by the data?A)Mares are more likely than geldings to develop enteroliths.
B)Less than half of geldings develop enteroliths.
C)Stallions are the least likely to develop enteroliths.
D)Female horses are slightly more likely to develop enteroliths.
سؤال
The following table describes the opinions of the 570 people that returned a residential life services questionnaire to researchers at a small university. Students were classified by class (freshman, sophomore, junior, or senior) and by their opinion of campus residence quality (high quality, medium quality, or low quality).  Which marginal or conditional distribution would you use to determine the percent of all students who responded that are sophomores?
A)the marginal distribution of class
B)the marginal distribution of opinion of residence quality
C)the conditional distribution of opinion of residence quality, given that class is "sophomore"
D)None of the answer options is correct.
Which marginal or conditional distribution would you use to determine the percent of all students who responded that are sophomores?A)the marginal distribution of class
B)the marginal distribution of opinion of residence quality
C)the conditional distribution of opinion of residence quality, given that class is "sophomore"
D)None of the answer options is correct.
سؤال
A study was conducted on horses to identify factors that might contribute to the formation of enteroliths-stones that form in the colon of the horse and eventually lead to blockage and death. The table below summarizes disease status by sex (gelding, mare, and stallion). 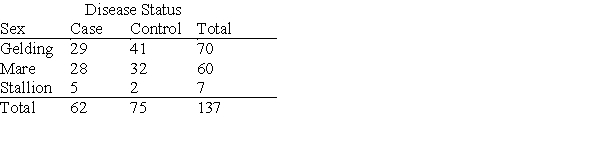 The proportion calculated as p = (62/137) = 0.4526 is:
A)the inverse proportion.
B)the marginal proportion of cases.
C)the restricted proportion of cases that are geldings among the cases.
D)None of the answer options is correct.
The proportion calculated as p = (62/137) = 0.4526 is:A)the inverse proportion.
B)the marginal proportion of cases.
C)the restricted proportion of cases that are geldings among the cases.
D)None of the answer options is correct.
سؤال
An administrator in charge of residential life services recently conducted a survey of undergraduate college students at a small university. A random sample of 300 students was selected from each class level (freshman, sophomore, junior, or senior). Each student was asked to complete and return a short questionnaire on the quality of campus residences. Some students returned the questionnaire; some did not. This is summarized in the table below.  What percent of freshmen returned the questionnaire?
A)50%
B)47.5%
C)36.7%
D)63.3%
What percent of freshmen returned the questionnaire?A)50%
B)47.5%
C)36.7%
D)63.3%
سؤال
A study was conducted on horses to identify factors that might contribute to the formation of enteroliths-stones that form in the colon of the horse and eventually lead to blockage and death. The table below summarizes disease status by sex (gelding, mare, and stallion). 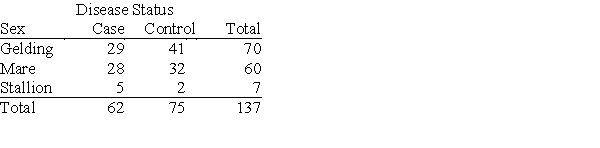 How many conditional distributions for gender p (being a mare, given disease status) can be calculated for these data?
A)1
B)2
C)3
D)4
How many conditional distributions for gender p (being a mare, given disease status) can be calculated for these data?A)1
B)2
C)3
D)4
سؤال
A study was conducted on horses to identify factors that might contribute to the formation of enteroliths-stones that form in the colon of the horse and eventually lead to blockage and death. The table below summarizes disease status by sex (gelding, mare, and stallion). 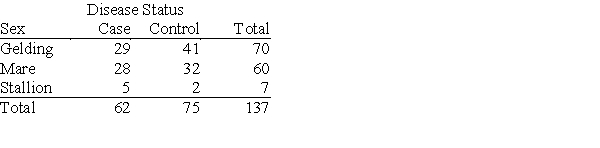 How many conditional distributions for disease status p (being a case, given sex) can be calculated for these data?
A)1
B)2
C)3
D)4
How many conditional distributions for disease status p (being a case, given sex) can be calculated for these data?A)1
B)2
C)3
D)4
سؤال
An administrator in charge of residential life services recently conducted a survey of undergraduate college students at a small university. A random sample of 300 students was selected from each class level (freshman, sophomore, junior, or senior). Each student was asked to complete and return a short questionnaire on the quality of campus residences. Some students returned the questionnaire; some did not. This is summarized in the table below.  Which of the following conclusions seems to be supported by the data?
A)Juniors and seniors appear to be more likely to return the survey than freshmen and sophomores.
B)Juniors and seniors are happier with the quality of campus residences than freshman and sophomores.
C)Students who did not return the questionnaire are unhappy with the quality of campus residences.
D)The percent of students returning the questionnaire is the same for each class.
Which of the following conclusions seems to be supported by the data?A)Juniors and seniors appear to be more likely to return the survey than freshmen and sophomores.
B)Juniors and seniors are happier with the quality of campus residences than freshman and sophomores.
C)Students who did not return the questionnaire are unhappy with the quality of campus residences.
D)The percent of students returning the questionnaire is the same for each class.
سؤال
A study was conducted on horses to identify factors that might contribute to the formation of enteroliths-stones that form in the colon of the horse and eventually lead to blockage and death. The table below summarizes disease status by sex (gelding, mare, and stallion). 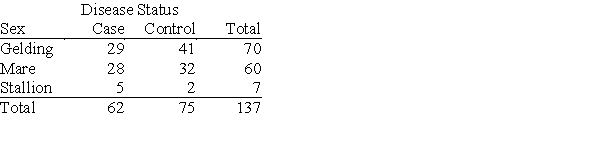 If you want to check whether there is an association between sex and case status, you should:
A)compare the conditional probabilities of being a case, given sex.
B)make a scatterplot of case status versus sex.
C)compare the marginal probability for case status and sex.
D)All of the answer options are correct.
If you want to check whether there is an association between sex and case status, you should:A)compare the conditional probabilities of being a case, given sex.
B)make a scatterplot of case status versus sex.
C)compare the marginal probability for case status and sex.
D)All of the answer options are correct.
سؤال
The following table describes the opinions of the 570 people who returned a residential life services questionnaire to researchers at a small university. Students were classified by class (freshman, sophomore, junior, or senior) and by their opinion of campus residence quality (high quality, medium quality, or low quality). 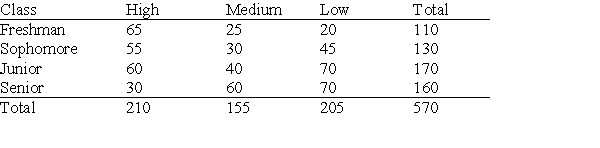 What percent of all students who responded are sophomores?
A)25%
B)19.3%
C)22.8%
D)29.8%
What percent of all students who responded are sophomores?A)25%
B)19.3%
C)22.8%
D)29.8%
سؤال
An administrator in charge of residential life services recently conducted a survey of undergraduate college students at a small university. A random sample of 300 students was selected from each class level (freshman, sophomore, junior, or senior). Each student was asked to complete and return a short questionnaire on the quality of campus residences. Some students returned the questionnaire; some did not. This is summarized in the table below.  What percent of all students surveyed returned the questionnaire?
A)50%
B)52.5%
C)47.5%
D)None of the answer options is correct.
What percent of all students surveyed returned the questionnaire?A)50%
B)52.5%
C)47.5%
D)None of the answer options is correct.
سؤال
In a study of the link between high blood pressure and cardiovascular disease, a group of white men aged 35 to 64 was followed for five years. At the beginning of the study, each man had his blood pressure measured, and it was classified as either low systolic blood pressure (less than 140 mm Hg) or high blood pressure (140 mm Hg or higher). The following table gives the number of men in each blood pressure category and the number of deaths from cardiovascular disease during the five-year period. 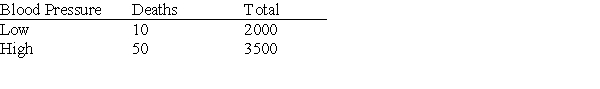 Based on these data, which of the following statements is correct?
A)These data are consistent with the idea that there is a link between high blood pressure and death from cardiovascular disease.
B)The mortality rate (proportion of deaths)for men with high blood pressure is five times that of men with low blood pressure.
C)These data probably understate the link between high blood pressure and death from cardiovascular disease, because men will tend to understate their true blood pressure.
D)All of the answer options are correct.
Based on these data, which of the following statements is correct?A)These data are consistent with the idea that there is a link between high blood pressure and death from cardiovascular disease.
B)The mortality rate (proportion of deaths)for men with high blood pressure is five times that of men with low blood pressure.
C)These data probably understate the link between high blood pressure and death from cardiovascular disease, because men will tend to understate their true blood pressure.
D)All of the answer options are correct.
سؤال
The following table describes the opinions of the 570 people who returned a residential life services questionnaire to researchers at a small university. Students were classified by class (freshman, sophomore, junior, or senior) and by their opinion of campus residence quality (high quality, medium quality, or low quality).  Of the students who feel campus residences are of high quality, what percent are seniors?
A)14.3%
B)18.8%
C)28.1%
D)33.3%
Of the students who feel campus residences are of high quality, what percent are seniors?A)14.3%
B)18.8%
C)28.1%
D)33.3%
سؤال
سؤال
سؤال
An administrator in charge of residential life services recently conducted a survey of undergraduate college students at a small university. A random sample of 300 students was selected from each class level (freshman, sophomore, junior, or senior). Each student was asked to complete and return a short questionnaire on the quality of campus residences. Some students returned the questionnaire; some did not. This is summarized in the table below:  How many different conditional distributions could be plotted from these data?
A)2
B)4
C)6
D)None of the answer options is correct.
How many different conditional distributions could be plotted from these data?A)2
B)4
C)6
D)None of the answer options is correct.
سؤال
The following table describes the opinions of the 570 people who returned a residential life services questionnaire to researchers at a small university. Students were classified by class (freshman, sophomore, junior, or senior) and by their opinion of campus residence quality (high quality, medium quality, or low quality). 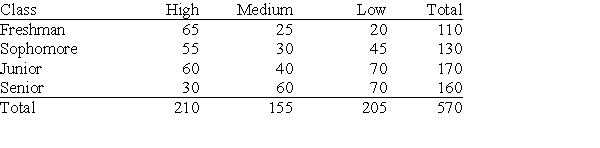 Which marginal or conditional distribution would you use to determine the percent of the students who feel campus residences are of high quality that are seniors?
A)the marginal distribution of class
B)the marginal distribution of opinion of residence quality
C)the conditional distribution of class, given that opinion of residence quality is high
D)None of the answer options is correct.
Which marginal or conditional distribution would you use to determine the percent of the students who feel campus residences are of high quality that are seniors?A)the marginal distribution of class
B)the marginal distribution of opinion of residence quality
C)the conditional distribution of class, given that opinion of residence quality is high
D)None of the answer options is correct.
سؤال
A study was conducted on horses to identify factors that might contribute to the formation of enteroliths-stones that form in the colon of the horse and eventually lead to blockage and death. The table below summarizes disease status by sex (gelding, mare, and stallion). 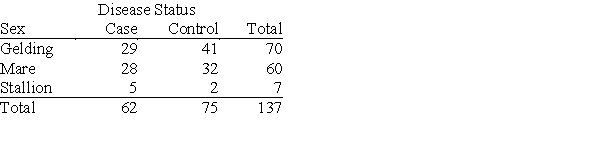 What percent of geldings had enteroliths?
A)41%
B)47%
C)21%
D)56%
What percent of geldings had enteroliths?A)41%
B)47%
C)21%
D)56%
سؤال
An administrator in charge of residential life services recently conducted a survey of undergraduate college students at a small university. A random sample of 300 students was selected from each class level (freshman, sophomore, junior, or senior). Each student was asked to complete and return a short questionnaire on the quality of campus residences. Some students returned the questionnaire; some did not. This is summarized in the table below.  How many different marginal distributions could be plotted from these data?
A)0
B)1
C)2
D)None of the answer options is correct.
How many different marginal distributions could be plotted from these data?A)0
B)1
C)2
D)None of the answer options is correct.
سؤال
The following table describes the opinions of the 570 people who returned a residential life services questionnaire to researchers at a small university. Students were classified by class (freshman, sophomore, junior, or senior) and by their opinion of campus residence quality (high quality, medium quality, or low quality). 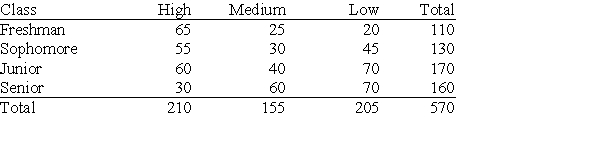 What percent of seniors feel that the quality of campus residences is not high?
A)37.5%
B)43.8%
C)81.3%
D)63.2%
What percent of seniors feel that the quality of campus residences is not high?A)37.5%
B)43.8%
C)81.3%
D)63.2%
سؤال
A study was conducted on horses to identify factors that might contribute to the formation of enteroliths-stones that form in the colon of the horse and eventually lead to blockage and death. The table below summarizes disease status, cases that have enteroliths by whether a horse has been altered (geldings have been castrated, mares and stallions have not been altered) and by whether the horse gets the majority of its feed as alfalfa. 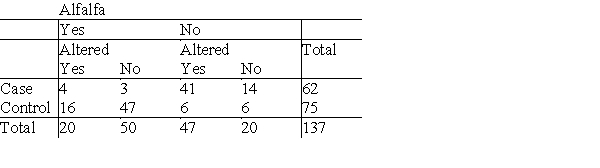 In the above table, when we look at the conditional probabilities of being a case, given being altered or not, we find that among those not fed alfalfa, horses that are not altered have a probability of being a case 3.3 times that of geldings. We find a similar ratio for the probabilities of horses fed alfalfa. When we calculate the ratio of those probabilities, combining the two tables when data are broken down by alfalfa feeding status, we find the probability of being a case, given a horse is not altered, is 6.4 times that of an altered horse. This is an example of:
A)a lurking variable.
B)Simpson's paradox.
C)Options (a)and (b)are correct.
D)None of the answer options is correct.
In the above table, when we look at the conditional probabilities of being a case, given being altered or not, we find that among those not fed alfalfa, horses that are not altered have a probability of being a case 3.3 times that of geldings. We find a similar ratio for the probabilities of horses fed alfalfa. When we calculate the ratio of those probabilities, combining the two tables when data are broken down by alfalfa feeding status, we find the probability of being a case, given a horse is not altered, is 6.4 times that of an altered horse. This is an example of:A)a lurking variable.
B)Simpson's paradox.
C)Options (a)and (b)are correct.
D)None of the answer options is correct.
سؤال
A sociologist studying freshmen carried out a survey, asking (among other questions) how often students went out per week, how many hours they studied per day, and how many hours they slept at night. The table below provides the answers on the time slept and the time spent studying.  What proportion of freshman slept at least 6 hours?
A)1
B)0.46
C)0.71
D)0.25
What proportion of freshman slept at least 6 hours?A)1
B)0.46
C)0.71
D)0.25
سؤال
Applicants looking for a job at a restaurant chain may apply to be a server or a kitchen worker. The table below summarizes the number of male and female applicants hired for the jobs for which they applied.  The proportion of female hires who are servers is:
A)0.2.
B)0.333.
C)0.667.
D)0.8.
The proportion of female hires who are servers is:A)0.2.
B)0.333.
C)0.667.
D)0.8.
سؤال
A sociologist studying freshmen carried out a survey, asking (among other questions) how often students went out per week, how many hours they studied per day, and how many hours they slept at night. The table below provides the answers on the time slept and the time spent studying.  Did students who studied 3 or more hours sleep less?
A)Yes, because if someone studies more they have less time to sleep.
B)No, because students who study more party less.
C)Yes, because the proportion of students who slept at most 8 hours among those studying 3 hours or more is 0.73, while the proportion who slept at most 8 hours among those studying less than 3 hours is 0.769.
D)There is not enough information to answer this question.
Did students who studied 3 or more hours sleep less?A)Yes, because if someone studies more they have less time to sleep.
B)No, because students who study more party less.
C)Yes, because the proportion of students who slept at most 8 hours among those studying 3 hours or more is 0.73, while the proportion who slept at most 8 hours among those studying less than 3 hours is 0.769.
D)There is not enough information to answer this question.
سؤال
A sociologist studying freshmen carried out a survey, asking (among other questions) how often students went out per week, how many hours they studied per day, and how many hours they slept at night. The table below provides the answers on the time slept and the time spent studying. 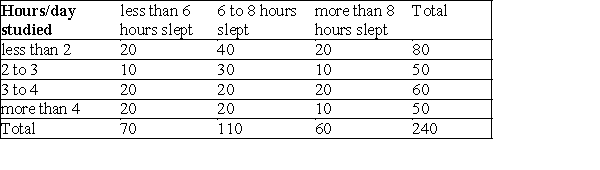 What proportion of students slept less than 6 hours per night?
A)0.286
B)0.292
C)0.25
D)0.333
What proportion of students slept less than 6 hours per night?A)0.286
B)0.292
C)0.25
D)0.333
سؤال
A study was conducted on horses to identify factors that might contribute to the formation of enteroliths-stones that form in the colon of the horse and eventually lead to blockage and death. The table below summarizes disease status, cases that have enteroliths by whether a horse has been altered (geldings have been castrated, mares and stallions have not been altered) and by whether the horse gets the majority of its feed as alfalfa.  To study whether being fed alfalfa has any effect on the relationship between case status and having been altered, we should:
A)calculate the conditional probabilities of having been altered for those who are fed alfalfa and for those who are not fed alfalfa.
B)calculate the conditional probabilities of being a case for those fed alfalfa and for those not fed alfalfa.
C)calculate the conditional probabilities of being a case, given being fed alfalfa or not and being altered or not.
D)All of the answer options are correct.
To study whether being fed alfalfa has any effect on the relationship between case status and having been altered, we should:A)calculate the conditional probabilities of having been altered for those who are fed alfalfa and for those who are not fed alfalfa.
B)calculate the conditional probabilities of being a case for those fed alfalfa and for those not fed alfalfa.
C)calculate the conditional probabilities of being a case, given being fed alfalfa or not and being altered or not.
D)All of the answer options are correct.
سؤال
Applicants looking for a job at a restaurant chain may apply to be a server or a kitchen worker. The table below summarizes the number of male and female applicants hired for the jobs for which they applied.  The proportion of female applicants for a job as kitchen worker that were hired is:
A)0.1.
B)0.375.
C)0.4.
D)0.625.
The proportion of female applicants for a job as kitchen worker that were hired is:A)0.1.
B)0.375.
C)0.4.
D)0.625.
سؤال
A sociologist studying freshmen carried out a survey, asking (among other questions) how often students went out per week, how many hours they studied per day, and how many hours they slept at night. The table below provides the answers on the time slept and the time spent studying.  What proportion of students studied 3 hours or more?
A)0.25
B)0.46
C)0.21
D)0.67
What proportion of students studied 3 hours or more?A)0.25
B)0.46
C)0.21
D)0.67
سؤال
Applicants looking for a job at a restaurant chain may apply to be a server or a kitchen worker. The table below summarizes the number of male and female applicants hired for the jobs for which they applied.  From these data, we may conclude that:
A)men are advantaged in applying for kitchen jobs, whereas women are advantaged in applying to be servers.
B)overall, the proportion of male applicants hired is greater than that for women overall.
C)the restaurant hires more servers than kitchen workers.
D)All of the answer options are correct.
From these data, we may conclude that:A)men are advantaged in applying for kitchen jobs, whereas women are advantaged in applying to be servers.
B)overall, the proportion of male applicants hired is greater than that for women overall.
C)the restaurant hires more servers than kitchen workers.
D)All of the answer options are correct.
سؤال
A sociologist studying freshmen carried out a survey, asking (among other questions) how often students went out per week, how many hours they studied per day, and how many hours they slept at night. The tables below provide the answers on the time slept and the time spent studying by whether or not students went out. 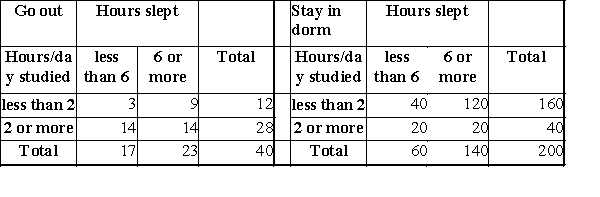 When we examine the data, we find that students who studied more slept less, both among those who go out and among those who stay in the dorm. When we combine both groups of students, we find that those who studied more also slept more. This is an example of:
A)the Probability Paradox.
B)Andersen's Paradox.
C)the Gaussian Paradox.
D)Simpson's paradox.
When we examine the data, we find that students who studied more slept less, both among those who go out and among those who stay in the dorm. When we combine both groups of students, we find that those who studied more also slept more. This is an example of:A)the Probability Paradox.
B)Andersen's Paradox.
C)the Gaussian Paradox.
D)Simpson's paradox.
سؤال
A company exploring ways to help its employees improve work/life balance conducted a survey of 360 of its workers that asked (among other things) about the number of hours typically spent on Facebook each day and about their stress level. 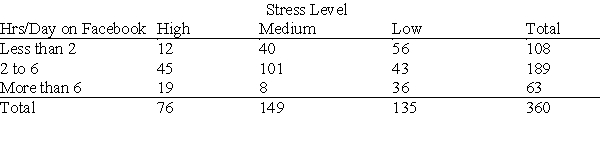 Of the employees who spend the most time on Facebook, what percent have a high stress level?
A)21.1%
B)23.8%
C)30.2%
D)59.2%
Of the employees who spend the most time on Facebook, what percent have a high stress level?A)21.1%
B)23.8%
C)30.2%
D)59.2%
سؤال
A company exploring ways to help its employees improve work/life balance conducted a survey of 360 of its workers that asked (among other things) about the number of hours typically spent on Facebook each day and about their stress level. 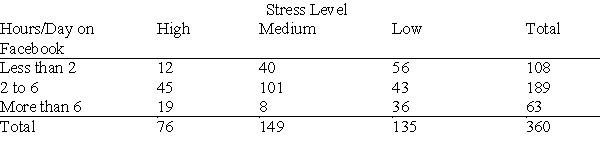 What percent of all employees who responded have a high stress level?
A)15.7%
B)21.1%
C)22.8%
D)25.0%
What percent of all employees who responded have a high stress level?A)15.7%
B)21.1%
C)22.8%
D)25.0%
سؤال
A sociologist studying freshmen carried out a survey, asking (among other questions) how often students went out per week, how many hours they studied per day, and how many hours they slept at night. The table below provides the answers on the time slept and the time spent studying.  Among the students who studied 4 or more hours, what proportion slept less than 6 hours a night?
A)0.29
B)0.08
C)0.4
D)0.2
Among the students who studied 4 or more hours, what proportion slept less than 6 hours a night?A)0.29
B)0.08
C)0.4
D)0.2
سؤال
Applicants looking for a job at a restaurant chain may apply to be a server or a kitchen worker. The table below summarizes the number of male and female applicants hired for the jobs for which they applied.  The proportion of all male applicants hired is:
A)0.091.
B)0.476.
C)0.523.
D)0.909.
The proportion of all male applicants hired is:A)0.091.
B)0.476.
C)0.523.
D)0.909.
سؤال
A sociologist studying freshmen carried out a survey, asking (among other questions) how often students went out per week, how many hours they studied per day, and how many hours they slept at night. The table below provides the answers on the time slept and the time spent studying. 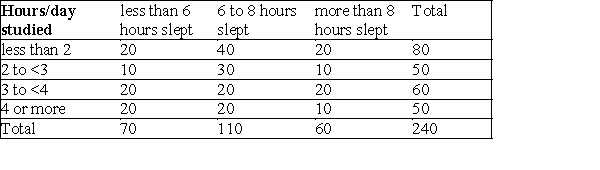 What proportion, among the students who slept more than 8 hours, studied 4 hours or more?
A)0.2
B)0.1
C)0.17
D)0.25
What proportion, among the students who slept more than 8 hours, studied 4 hours or more?A)0.2
B)0.1
C)0.17
D)0.25
سؤال
A sociologist studying freshmen carried out a survey, asking (among other questions) how often students went out per week, how many hours they studied per day, and how many hours they slept at night. The tables below provide the answers on the time slept and the time spent studying by whether or not students went out. 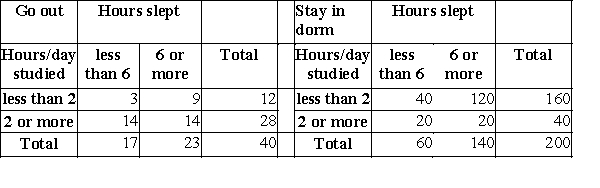 For both groups of students, those who go out and those who stay in the dorm, students who study more:
A)sleep less.
B)sleep more.
C)sleep the same.
D)Sleeping and studying are unrelated.
For both groups of students, those who go out and those who stay in the dorm, students who study more:A)sleep less.
B)sleep more.
C)sleep the same.
D)Sleeping and studying are unrelated.
سؤال
A sociologist studying freshmen carried out a survey, asking (among other questions) how often students went out per week, how many hours they studied per day, and how many hours they slept at night. The table below provides the answers on the time slept and the time spent studying.  Among the students who slept at most 8 hours, what proportion studied at least 3 hours?
A)0.67
B)0.36
C)0.73
D)0.44
Among the students who slept at most 8 hours, what proportion studied at least 3 hours?A)0.67
B)0.36
C)0.73
D)0.44
سؤال
Applicants looking for a job at a restaurant chain may apply to be a server or a kitchen worker. The table below summarizes the number of male and female applicants hired for the jobs for which they applied.  The proportion of male applicants for a job as server that were hired is:
A)0.067.
B)0.133.
C)0.2.
D)0.4.
The proportion of male applicants for a job as server that were hired is:A)0.067.
B)0.133.
C)0.2.
D)0.4.
سؤال
A sociologist studying freshmen carried out a survey, asking (among other questions) how often students went out per week, how many hours they studied per day, and how many hours they slept at night. The table below provides the answers on the time slept and the time spent studying. 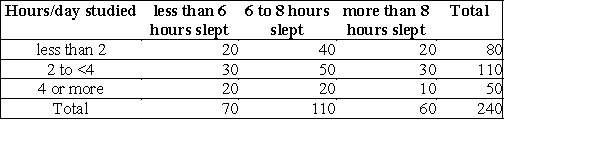 Is there an association between the number of hours studied and the number of hours slept?
A)Yes, because the proportions sleeping less than 6 hours increases as the number of hours studied increases.
B)No, because there is no reason to sleep less if a student studies more.
C)No, because a sleep-deprived student cannot study many hours.
D)Yes, because the more a student studies, the less time there is for sleeping.
Is there an association between the number of hours studied and the number of hours slept?A)Yes, because the proportions sleeping less than 6 hours increases as the number of hours studied increases.
B)No, because there is no reason to sleep less if a student studies more.
C)No, because a sleep-deprived student cannot study many hours.
D)Yes, because the more a student studies, the less time there is for sleeping.
سؤال
A sociologist studying freshmen carried out a survey, asking (among other questions) how often students went out per week, how many hours they studied per day, and how many hours they slept at night. The table below provides the answers on the time slept and the time spent studying.  What proportion of students slept at least 6 hours and studied 4 or more hours?
A)0.6
B)0.4
C)0.78
D)0.125
What proportion of students slept at least 6 hours and studied 4 or more hours?A)0.6
B)0.4
C)0.78
D)0.125

فتح الحزمة
قم بالتسجيل لفتح البطاقات في هذه المجموعة!
Unlock Deck
Unlock Deck
1/40
العب
ملء الشاشة (f)
Deck 6: Two-Way Tables
1
In a recent round of layoffs in a company, the percent of employees 50 and older who were laid off was much higher than the percent younger than 50 who were laid off. However, when the data were analyzed separately in each job category, the percent of employees 50 and older who were laid off was lower than the percent of employees younger than 50 who were laid off in each job category. This reversal of direction of the association between age and being laid off, when job category is taken into account, is called:
A)Simpson's paradox.
B)least-squares regression.
C)negative association.
D)a residual plot.
A)Simpson's paradox.
B)least-squares regression.
C)negative association.
D)a residual plot.
Simpson's paradox.
2
A study was conducted on horses to identify factors that might contribute to the formation of enteroliths-stones that form in the colon of the horse and eventually lead to blockage and death. The table below summarizes disease status by sex (gelding, mare, and stallion). Which of the following statements is not supported by the data?
A)Mares are more likely than geldings to develop enteroliths.
B)Less than half of geldings develop enteroliths.
C)Stallions are the least likely to develop enteroliths.
D)Female horses are slightly more likely to develop enteroliths.
Which of the following statements is not supported by the data?A)Mares are more likely than geldings to develop enteroliths.
B)Less than half of geldings develop enteroliths.
C)Stallions are the least likely to develop enteroliths.
D)Female horses are slightly more likely to develop enteroliths.
Stallions are the least likely to develop enteroliths.
3
The following table describes the opinions of the 570 people that returned a residential life services questionnaire to researchers at a small university. Students were classified by class (freshman, sophomore, junior, or senior) and by their opinion of campus residence quality (high quality, medium quality, or low quality). Which marginal or conditional distribution would you use to determine the percent of all students who responded that are sophomores?
A)the marginal distribution of class
B)the marginal distribution of opinion of residence quality
C)the conditional distribution of opinion of residence quality, given that class is "sophomore"
D)None of the answer options is correct.
Which marginal or conditional distribution would you use to determine the percent of all students who responded that are sophomores?A)the marginal distribution of class
B)the marginal distribution of opinion of residence quality
C)the conditional distribution of opinion of residence quality, given that class is "sophomore"
D)None of the answer options is correct.
the marginal distribution of class
4
A study was conducted on horses to identify factors that might contribute to the formation of enteroliths-stones that form in the colon of the horse and eventually lead to blockage and death. The table below summarizes disease status by sex (gelding, mare, and stallion). The proportion calculated as p = (62/137) = 0.4526 is:
A)the inverse proportion.
B)the marginal proportion of cases.
C)the restricted proportion of cases that are geldings among the cases.
D)None of the answer options is correct.
The proportion calculated as p = (62/137) = 0.4526 is:A)the inverse proportion.
B)the marginal proportion of cases.
C)the restricted proportion of cases that are geldings among the cases.
D)None of the answer options is correct.
فتح الحزمة
افتح القفل للوصول البطاقات البالغ عددها 40 في هذه المجموعة.
فتح الحزمة
k this deck
5
An administrator in charge of residential life services recently conducted a survey of undergraduate college students at a small university. A random sample of 300 students was selected from each class level (freshman, sophomore, junior, or senior). Each student was asked to complete and return a short questionnaire on the quality of campus residences. Some students returned the questionnaire; some did not. This is summarized in the table below. What percent of freshmen returned the questionnaire?
A)50%
B)47.5%
C)36.7%
D)63.3%
What percent of freshmen returned the questionnaire?A)50%
B)47.5%
C)36.7%
D)63.3%
فتح الحزمة
افتح القفل للوصول البطاقات البالغ عددها 40 في هذه المجموعة.
فتح الحزمة
k this deck
6
A study was conducted on horses to identify factors that might contribute to the formation of enteroliths-stones that form in the colon of the horse and eventually lead to blockage and death. The table below summarizes disease status by sex (gelding, mare, and stallion). How many conditional distributions for gender p (being a mare, given disease status) can be calculated for these data?
A)1
B)2
C)3
D)4
How many conditional distributions for gender p (being a mare, given disease status) can be calculated for these data?A)1
B)2
C)3
D)4
فتح الحزمة
افتح القفل للوصول البطاقات البالغ عددها 40 في هذه المجموعة.
فتح الحزمة
k this deck
7
A study was conducted on horses to identify factors that might contribute to the formation of enteroliths-stones that form in the colon of the horse and eventually lead to blockage and death. The table below summarizes disease status by sex (gelding, mare, and stallion). How many conditional distributions for disease status p (being a case, given sex) can be calculated for these data?
A)1
B)2
C)3
D)4
How many conditional distributions for disease status p (being a case, given sex) can be calculated for these data?A)1
B)2
C)3
D)4
فتح الحزمة
افتح القفل للوصول البطاقات البالغ عددها 40 في هذه المجموعة.
فتح الحزمة
k this deck
8
An administrator in charge of residential life services recently conducted a survey of undergraduate college students at a small university. A random sample of 300 students was selected from each class level (freshman, sophomore, junior, or senior). Each student was asked to complete and return a short questionnaire on the quality of campus residences. Some students returned the questionnaire; some did not. This is summarized in the table below. Which of the following conclusions seems to be supported by the data?
A)Juniors and seniors appear to be more likely to return the survey than freshmen and sophomores.
B)Juniors and seniors are happier with the quality of campus residences than freshman and sophomores.
C)Students who did not return the questionnaire are unhappy with the quality of campus residences.
D)The percent of students returning the questionnaire is the same for each class.
Which of the following conclusions seems to be supported by the data?A)Juniors and seniors appear to be more likely to return the survey than freshmen and sophomores.
B)Juniors and seniors are happier with the quality of campus residences than freshman and sophomores.
C)Students who did not return the questionnaire are unhappy with the quality of campus residences.
D)The percent of students returning the questionnaire is the same for each class.
فتح الحزمة
افتح القفل للوصول البطاقات البالغ عددها 40 في هذه المجموعة.
فتح الحزمة
k this deck
9
A study was conducted on horses to identify factors that might contribute to the formation of enteroliths-stones that form in the colon of the horse and eventually lead to blockage and death. The table below summarizes disease status by sex (gelding, mare, and stallion). If you want to check whether there is an association between sex and case status, you should:
A)compare the conditional probabilities of being a case, given sex.
B)make a scatterplot of case status versus sex.
C)compare the marginal probability for case status and sex.
D)All of the answer options are correct.
If you want to check whether there is an association between sex and case status, you should:A)compare the conditional probabilities of being a case, given sex.
B)make a scatterplot of case status versus sex.
C)compare the marginal probability for case status and sex.
D)All of the answer options are correct.
فتح الحزمة
افتح القفل للوصول البطاقات البالغ عددها 40 في هذه المجموعة.
فتح الحزمة
k this deck
10
The following table describes the opinions of the 570 people who returned a residential life services questionnaire to researchers at a small university. Students were classified by class (freshman, sophomore, junior, or senior) and by their opinion of campus residence quality (high quality, medium quality, or low quality). What percent of all students who responded are sophomores?
A)25%
B)19.3%
C)22.8%
D)29.8%
What percent of all students who responded are sophomores?A)25%
B)19.3%
C)22.8%
D)29.8%
فتح الحزمة
افتح القفل للوصول البطاقات البالغ عددها 40 في هذه المجموعة.
فتح الحزمة
k this deck
11
An administrator in charge of residential life services recently conducted a survey of undergraduate college students at a small university. A random sample of 300 students was selected from each class level (freshman, sophomore, junior, or senior). Each student was asked to complete and return a short questionnaire on the quality of campus residences. Some students returned the questionnaire; some did not. This is summarized in the table below. What percent of all students surveyed returned the questionnaire?
A)50%
B)52.5%
C)47.5%
D)None of the answer options is correct.
What percent of all students surveyed returned the questionnaire?A)50%
B)52.5%
C)47.5%
D)None of the answer options is correct.
فتح الحزمة
افتح القفل للوصول البطاقات البالغ عددها 40 في هذه المجموعة.
فتح الحزمة
k this deck
12
In a study of the link between high blood pressure and cardiovascular disease, a group of white men aged 35 to 64 was followed for five years. At the beginning of the study, each man had his blood pressure measured, and it was classified as either low systolic blood pressure (less than 140 mm Hg) or high blood pressure (140 mm Hg or higher). The following table gives the number of men in each blood pressure category and the number of deaths from cardiovascular disease during the five-year period. Based on these data, which of the following statements is correct?
A)These data are consistent with the idea that there is a link between high blood pressure and death from cardiovascular disease.
B)The mortality rate (proportion of deaths)for men with high blood pressure is five times that of men with low blood pressure.
C)These data probably understate the link between high blood pressure and death from cardiovascular disease, because men will tend to understate their true blood pressure.
D)All of the answer options are correct.
Based on these data, which of the following statements is correct?A)These data are consistent with the idea that there is a link between high blood pressure and death from cardiovascular disease.
B)The mortality rate (proportion of deaths)for men with high blood pressure is five times that of men with low blood pressure.
C)These data probably understate the link between high blood pressure and death from cardiovascular disease, because men will tend to understate their true blood pressure.
D)All of the answer options are correct.
فتح الحزمة
افتح القفل للوصول البطاقات البالغ عددها 40 في هذه المجموعة.
فتح الحزمة
k this deck
13
The following table describes the opinions of the 570 people who returned a residential life services questionnaire to researchers at a small university. Students were classified by class (freshman, sophomore, junior, or senior) and by their opinion of campus residence quality (high quality, medium quality, or low quality). Of the students who feel campus residences are of high quality, what percent are seniors?
A)14.3%
B)18.8%
C)28.1%
D)33.3%
Of the students who feel campus residences are of high quality, what percent are seniors?A)14.3%
B)18.8%
C)28.1%
D)33.3%
فتح الحزمة
افتح القفل للوصول البطاقات البالغ عددها 40 في هذه المجموعة.
فتح الحزمة
k this deck
14
If X and Y are categorical variables, one way to identify whether there is a relationship between them is to:
A)calculate the correlation between X and Y.
B)draw a scatterplot of the X and Y values.
C)make a two-way table of the X and Y values.
D)All of the answer options are correct.
A)calculate the correlation between X and Y.
B)draw a scatterplot of the X and Y values.
C)make a two-way table of the X and Y values.
D)All of the answer options are correct.
فتح الحزمة
افتح القفل للوصول البطاقات البالغ عددها 40 في هذه المجموعة.
فتح الحزمة
k this deck
15
Since 2000, the median wage in the United States has risen by 1%, while the median wage for every educational subgroup (high school dropouts, high school graduates, college graduates, and people with advanced degrees) has decreased. This apparent contradiction is an example of:
A)extrapolation.
B)Simpson's paradox.
C)causation.
D)correlation.
A)extrapolation.
B)Simpson's paradox.
C)causation.
D)correlation.
فتح الحزمة
افتح القفل للوصول البطاقات البالغ عددها 40 في هذه المجموعة.
فتح الحزمة
k this deck
16
An administrator in charge of residential life services recently conducted a survey of undergraduate college students at a small university. A random sample of 300 students was selected from each class level (freshman, sophomore, junior, or senior). Each student was asked to complete and return a short questionnaire on the quality of campus residences. Some students returned the questionnaire; some did not. This is summarized in the table below: How many different conditional distributions could be plotted from these data?
A)2
B)4
C)6
D)None of the answer options is correct.
How many different conditional distributions could be plotted from these data?A)2
B)4
C)6
D)None of the answer options is correct.
فتح الحزمة
افتح القفل للوصول البطاقات البالغ عددها 40 في هذه المجموعة.
فتح الحزمة
k this deck
17
The following table describes the opinions of the 570 people who returned a residential life services questionnaire to researchers at a small university. Students were classified by class (freshman, sophomore, junior, or senior) and by their opinion of campus residence quality (high quality, medium quality, or low quality). Which marginal or conditional distribution would you use to determine the percent of the students who feel campus residences are of high quality that are seniors?
A)the marginal distribution of class
B)the marginal distribution of opinion of residence quality
C)the conditional distribution of class, given that opinion of residence quality is high
D)None of the answer options is correct.
Which marginal or conditional distribution would you use to determine the percent of the students who feel campus residences are of high quality that are seniors?A)the marginal distribution of class
B)the marginal distribution of opinion of residence quality
C)the conditional distribution of class, given that opinion of residence quality is high
D)None of the answer options is correct.
فتح الحزمة
افتح القفل للوصول البطاقات البالغ عددها 40 في هذه المجموعة.
فتح الحزمة
k this deck
18
A study was conducted on horses to identify factors that might contribute to the formation of enteroliths-stones that form in the colon of the horse and eventually lead to blockage and death. The table below summarizes disease status by sex (gelding, mare, and stallion). What percent of geldings had enteroliths?
A)41%
B)47%
C)21%
D)56%
What percent of geldings had enteroliths?A)41%
B)47%
C)21%
D)56%
فتح الحزمة
افتح القفل للوصول البطاقات البالغ عددها 40 في هذه المجموعة.
فتح الحزمة
k this deck
19
An administrator in charge of residential life services recently conducted a survey of undergraduate college students at a small university. A random sample of 300 students was selected from each class level (freshman, sophomore, junior, or senior). Each student was asked to complete and return a short questionnaire on the quality of campus residences. Some students returned the questionnaire; some did not. This is summarized in the table below. How many different marginal distributions could be plotted from these data?
A)0
B)1
C)2
D)None of the answer options is correct.
How many different marginal distributions could be plotted from these data?A)0
B)1
C)2
D)None of the answer options is correct.
فتح الحزمة
افتح القفل للوصول البطاقات البالغ عددها 40 في هذه المجموعة.
فتح الحزمة
k this deck
20
The following table describes the opinions of the 570 people who returned a residential life services questionnaire to researchers at a small university. Students were classified by class (freshman, sophomore, junior, or senior) and by their opinion of campus residence quality (high quality, medium quality, or low quality). What percent of seniors feel that the quality of campus residences is not high?
A)37.5%
B)43.8%
C)81.3%
D)63.2%
What percent of seniors feel that the quality of campus residences is not high?A)37.5%
B)43.8%
C)81.3%
D)63.2%
فتح الحزمة
افتح القفل للوصول البطاقات البالغ عددها 40 في هذه المجموعة.
فتح الحزمة
k this deck
21
A study was conducted on horses to identify factors that might contribute to the formation of enteroliths-stones that form in the colon of the horse and eventually lead to blockage and death. The table below summarizes disease status, cases that have enteroliths by whether a horse has been altered (geldings have been castrated, mares and stallions have not been altered) and by whether the horse gets the majority of its feed as alfalfa. In the above table, when we look at the conditional probabilities of being a case, given being altered or not, we find that among those not fed alfalfa, horses that are not altered have a probability of being a case 3.3 times that of geldings. We find a similar ratio for the probabilities of horses fed alfalfa. When we calculate the ratio of those probabilities, combining the two tables when data are broken down by alfalfa feeding status, we find the probability of being a case, given a horse is not altered, is 6.4 times that of an altered horse. This is an example of:
A)a lurking variable.
B)Simpson's paradox.
C)Options (a)and (b)are correct.
D)None of the answer options is correct.
In the above table, when we look at the conditional probabilities of being a case, given being altered or not, we find that among those not fed alfalfa, horses that are not altered have a probability of being a case 3.3 times that of geldings. We find a similar ratio for the probabilities of horses fed alfalfa. When we calculate the ratio of those probabilities, combining the two tables when data are broken down by alfalfa feeding status, we find the probability of being a case, given a horse is not altered, is 6.4 times that of an altered horse. This is an example of:A)a lurking variable.
B)Simpson's paradox.
C)Options (a)and (b)are correct.
D)None of the answer options is correct.
فتح الحزمة
افتح القفل للوصول البطاقات البالغ عددها 40 في هذه المجموعة.
فتح الحزمة
k this deck
22
A sociologist studying freshmen carried out a survey, asking (among other questions) how often students went out per week, how many hours they studied per day, and how many hours they slept at night. The table below provides the answers on the time slept and the time spent studying. What proportion of freshman slept at least 6 hours?
A)1
B)0.46
C)0.71
D)0.25
What proportion of freshman slept at least 6 hours?A)1
B)0.46
C)0.71
D)0.25
فتح الحزمة
افتح القفل للوصول البطاقات البالغ عددها 40 في هذه المجموعة.
فتح الحزمة
k this deck
23
Applicants looking for a job at a restaurant chain may apply to be a server or a kitchen worker. The table below summarizes the number of male and female applicants hired for the jobs for which they applied. The proportion of female hires who are servers is:
A)0.2.
B)0.333.
C)0.667.
D)0.8.
The proportion of female hires who are servers is:A)0.2.
B)0.333.
C)0.667.
D)0.8.
فتح الحزمة
افتح القفل للوصول البطاقات البالغ عددها 40 في هذه المجموعة.
فتح الحزمة
k this deck
24
A sociologist studying freshmen carried out a survey, asking (among other questions) how often students went out per week, how many hours they studied per day, and how many hours they slept at night. The table below provides the answers on the time slept and the time spent studying. Did students who studied 3 or more hours sleep less?
A)Yes, because if someone studies more they have less time to sleep.
B)No, because students who study more party less.
C)Yes, because the proportion of students who slept at most 8 hours among those studying 3 hours or more is 0.73, while the proportion who slept at most 8 hours among those studying less than 3 hours is 0.769.
D)There is not enough information to answer this question.
Did students who studied 3 or more hours sleep less?A)Yes, because if someone studies more they have less time to sleep.
B)No, because students who study more party less.
C)Yes, because the proportion of students who slept at most 8 hours among those studying 3 hours or more is 0.73, while the proportion who slept at most 8 hours among those studying less than 3 hours is 0.769.
D)There is not enough information to answer this question.
فتح الحزمة
افتح القفل للوصول البطاقات البالغ عددها 40 في هذه المجموعة.
فتح الحزمة
k this deck
25
A sociologist studying freshmen carried out a survey, asking (among other questions) how often students went out per week, how many hours they studied per day, and how many hours they slept at night. The table below provides the answers on the time slept and the time spent studying. What proportion of students slept less than 6 hours per night?
A)0.286
B)0.292
C)0.25
D)0.333
What proportion of students slept less than 6 hours per night?A)0.286
B)0.292
C)0.25
D)0.333
فتح الحزمة
افتح القفل للوصول البطاقات البالغ عددها 40 في هذه المجموعة.
فتح الحزمة
k this deck
26
A study was conducted on horses to identify factors that might contribute to the formation of enteroliths-stones that form in the colon of the horse and eventually lead to blockage and death. The table below summarizes disease status, cases that have enteroliths by whether a horse has been altered (geldings have been castrated, mares and stallions have not been altered) and by whether the horse gets the majority of its feed as alfalfa. To study whether being fed alfalfa has any effect on the relationship between case status and having been altered, we should:
A)calculate the conditional probabilities of having been altered for those who are fed alfalfa and for those who are not fed alfalfa.
B)calculate the conditional probabilities of being a case for those fed alfalfa and for those not fed alfalfa.
C)calculate the conditional probabilities of being a case, given being fed alfalfa or not and being altered or not.
D)All of the answer options are correct.
To study whether being fed alfalfa has any effect on the relationship between case status and having been altered, we should:A)calculate the conditional probabilities of having been altered for those who are fed alfalfa and for those who are not fed alfalfa.
B)calculate the conditional probabilities of being a case for those fed alfalfa and for those not fed alfalfa.
C)calculate the conditional probabilities of being a case, given being fed alfalfa or not and being altered or not.
D)All of the answer options are correct.
فتح الحزمة
افتح القفل للوصول البطاقات البالغ عددها 40 في هذه المجموعة.
فتح الحزمة
k this deck
27
Applicants looking for a job at a restaurant chain may apply to be a server or a kitchen worker. The table below summarizes the number of male and female applicants hired for the jobs for which they applied. The proportion of female applicants for a job as kitchen worker that were hired is:
A)0.1.
B)0.375.
C)0.4.
D)0.625.
The proportion of female applicants for a job as kitchen worker that were hired is:A)0.1.
B)0.375.
C)0.4.
D)0.625.
فتح الحزمة
افتح القفل للوصول البطاقات البالغ عددها 40 في هذه المجموعة.
فتح الحزمة
k this deck
28
A sociologist studying freshmen carried out a survey, asking (among other questions) how often students went out per week, how many hours they studied per day, and how many hours they slept at night. The table below provides the answers on the time slept and the time spent studying. What proportion of students studied 3 hours or more?
A)0.25
B)0.46
C)0.21
D)0.67
What proportion of students studied 3 hours or more?A)0.25
B)0.46
C)0.21
D)0.67
فتح الحزمة
افتح القفل للوصول البطاقات البالغ عددها 40 في هذه المجموعة.
فتح الحزمة
k this deck
29
Applicants looking for a job at a restaurant chain may apply to be a server or a kitchen worker. The table below summarizes the number of male and female applicants hired for the jobs for which they applied. From these data, we may conclude that:
A)men are advantaged in applying for kitchen jobs, whereas women are advantaged in applying to be servers.
B)overall, the proportion of male applicants hired is greater than that for women overall.
C)the restaurant hires more servers than kitchen workers.
D)All of the answer options are correct.
From these data, we may conclude that:A)men are advantaged in applying for kitchen jobs, whereas women are advantaged in applying to be servers.
B)overall, the proportion of male applicants hired is greater than that for women overall.
C)the restaurant hires more servers than kitchen workers.
D)All of the answer options are correct.
فتح الحزمة
افتح القفل للوصول البطاقات البالغ عددها 40 في هذه المجموعة.
فتح الحزمة
k this deck
30
A sociologist studying freshmen carried out a survey, asking (among other questions) how often students went out per week, how many hours they studied per day, and how many hours they slept at night. The tables below provide the answers on the time slept and the time spent studying by whether or not students went out. When we examine the data, we find that students who studied more slept less, both among those who go out and among those who stay in the dorm. When we combine both groups of students, we find that those who studied more also slept more. This is an example of:
A)the Probability Paradox.
B)Andersen's Paradox.
C)the Gaussian Paradox.
D)Simpson's paradox.
When we examine the data, we find that students who studied more slept less, both among those who go out and among those who stay in the dorm. When we combine both groups of students, we find that those who studied more also slept more. This is an example of:A)the Probability Paradox.
B)Andersen's Paradox.
C)the Gaussian Paradox.
D)Simpson's paradox.
فتح الحزمة
افتح القفل للوصول البطاقات البالغ عددها 40 في هذه المجموعة.
فتح الحزمة
k this deck
31
A company exploring ways to help its employees improve work/life balance conducted a survey of 360 of its workers that asked (among other things) about the number of hours typically spent on Facebook each day and about their stress level. Of the employees who spend the most time on Facebook, what percent have a high stress level?
A)21.1%
B)23.8%
C)30.2%
D)59.2%
Of the employees who spend the most time on Facebook, what percent have a high stress level?A)21.1%
B)23.8%
C)30.2%
D)59.2%
فتح الحزمة
افتح القفل للوصول البطاقات البالغ عددها 40 في هذه المجموعة.
فتح الحزمة
k this deck
32
A company exploring ways to help its employees improve work/life balance conducted a survey of 360 of its workers that asked (among other things) about the number of hours typically spent on Facebook each day and about their stress level. What percent of all employees who responded have a high stress level?
A)15.7%
B)21.1%
C)22.8%
D)25.0%
What percent of all employees who responded have a high stress level?A)15.7%
B)21.1%
C)22.8%
D)25.0%
فتح الحزمة
افتح القفل للوصول البطاقات البالغ عددها 40 في هذه المجموعة.
فتح الحزمة
k this deck
33
A sociologist studying freshmen carried out a survey, asking (among other questions) how often students went out per week, how many hours they studied per day, and how many hours they slept at night. The table below provides the answers on the time slept and the time spent studying. Among the students who studied 4 or more hours, what proportion slept less than 6 hours a night?
A)0.29
B)0.08
C)0.4
D)0.2
Among the students who studied 4 or more hours, what proportion slept less than 6 hours a night?A)0.29
B)0.08
C)0.4
D)0.2
فتح الحزمة
افتح القفل للوصول البطاقات البالغ عددها 40 في هذه المجموعة.
فتح الحزمة
k this deck
34
Applicants looking for a job at a restaurant chain may apply to be a server or a kitchen worker. The table below summarizes the number of male and female applicants hired for the jobs for which they applied. The proportion of all male applicants hired is:
A)0.091.
B)0.476.
C)0.523.
D)0.909.
The proportion of all male applicants hired is:A)0.091.
B)0.476.
C)0.523.
D)0.909.
فتح الحزمة
افتح القفل للوصول البطاقات البالغ عددها 40 في هذه المجموعة.
فتح الحزمة
k this deck
35
A sociologist studying freshmen carried out a survey, asking (among other questions) how often students went out per week, how many hours they studied per day, and how many hours they slept at night. The table below provides the answers on the time slept and the time spent studying. What proportion, among the students who slept more than 8 hours, studied 4 hours or more?
A)0.2
B)0.1
C)0.17
D)0.25
What proportion, among the students who slept more than 8 hours, studied 4 hours or more?A)0.2
B)0.1
C)0.17
D)0.25
فتح الحزمة
افتح القفل للوصول البطاقات البالغ عددها 40 في هذه المجموعة.
فتح الحزمة
k this deck
36
A sociologist studying freshmen carried out a survey, asking (among other questions) how often students went out per week, how many hours they studied per day, and how many hours they slept at night. The tables below provide the answers on the time slept and the time spent studying by whether or not students went out. For both groups of students, those who go out and those who stay in the dorm, students who study more:
A)sleep less.
B)sleep more.
C)sleep the same.
D)Sleeping and studying are unrelated.
For both groups of students, those who go out and those who stay in the dorm, students who study more:A)sleep less.
B)sleep more.
C)sleep the same.
D)Sleeping and studying are unrelated.
فتح الحزمة
افتح القفل للوصول البطاقات البالغ عددها 40 في هذه المجموعة.
فتح الحزمة
k this deck
37
A sociologist studying freshmen carried out a survey, asking (among other questions) how often students went out per week, how many hours they studied per day, and how many hours they slept at night. The table below provides the answers on the time slept and the time spent studying. Among the students who slept at most 8 hours, what proportion studied at least 3 hours?
A)0.67
B)0.36
C)0.73
D)0.44
Among the students who slept at most 8 hours, what proportion studied at least 3 hours?A)0.67
B)0.36
C)0.73
D)0.44
فتح الحزمة
افتح القفل للوصول البطاقات البالغ عددها 40 في هذه المجموعة.
فتح الحزمة
k this deck
38
Applicants looking for a job at a restaurant chain may apply to be a server or a kitchen worker. The table below summarizes the number of male and female applicants hired for the jobs for which they applied. The proportion of male applicants for a job as server that were hired is:
A)0.067.
B)0.133.
C)0.2.
D)0.4.
The proportion of male applicants for a job as server that were hired is:A)0.067.
B)0.133.
C)0.2.
D)0.4.
فتح الحزمة
افتح القفل للوصول البطاقات البالغ عددها 40 في هذه المجموعة.
فتح الحزمة
k this deck
39
A sociologist studying freshmen carried out a survey, asking (among other questions) how often students went out per week, how many hours they studied per day, and how many hours they slept at night. The table below provides the answers on the time slept and the time spent studying. Is there an association between the number of hours studied and the number of hours slept?
A)Yes, because the proportions sleeping less than 6 hours increases as the number of hours studied increases.
B)No, because there is no reason to sleep less if a student studies more.
C)No, because a sleep-deprived student cannot study many hours.
D)Yes, because the more a student studies, the less time there is for sleeping.
Is there an association between the number of hours studied and the number of hours slept?A)Yes, because the proportions sleeping less than 6 hours increases as the number of hours studied increases.
B)No, because there is no reason to sleep less if a student studies more.
C)No, because a sleep-deprived student cannot study many hours.
D)Yes, because the more a student studies, the less time there is for sleeping.
فتح الحزمة
افتح القفل للوصول البطاقات البالغ عددها 40 في هذه المجموعة.
فتح الحزمة
k this deck
40
A sociologist studying freshmen carried out a survey, asking (among other questions) how often students went out per week, how many hours they studied per day, and how many hours they slept at night. The table below provides the answers on the time slept and the time spent studying. What proportion of students slept at least 6 hours and studied 4 or more hours?
A)0.6
B)0.4
C)0.78
D)0.125
What proportion of students slept at least 6 hours and studied 4 or more hours?A)0.6
B)0.4
C)0.78
D)0.125
فتح الحزمة
افتح القفل للوصول البطاقات البالغ عددها 40 في هذه المجموعة.
فتح الحزمة
k this deck
فتح الحزمة
افتح القفل للوصول البطاقات البالغ عددها 40 في هذه المجموعة.


