Deck 4: Section 6: Applications of Differentiation
ملء الشاشة (f)
سؤال
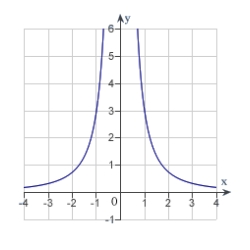
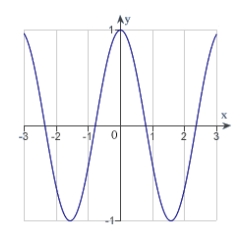
The graph of a function f is is shown below. 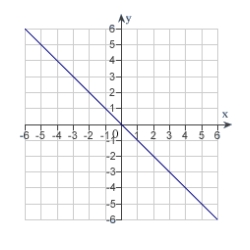 Sketch the graph of the derivative
  .
.
A)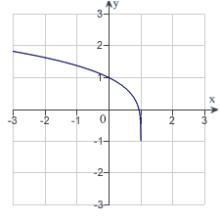
B)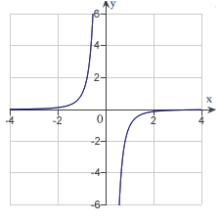
C)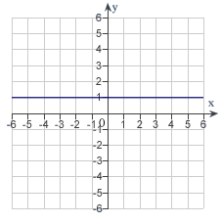
D)
E)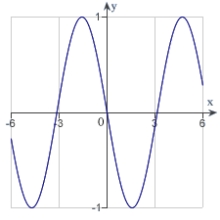
Sketch the graph of the derivative .A)
B)
C)
D)
E)
سؤال
The graph of f is shown below. For which values of x is  zero?
zero? 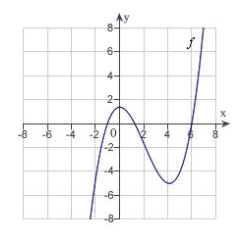
A)
B)
C)
D)
E)
zero? A)
B)
C)
D)
E)
سؤال
The graph of a function f is is shown below. Sketch the graph of the derivative  .
. 
A)
B)
C)
D)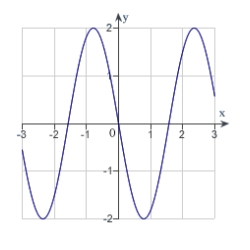
E)
. A)
B)
C)
D)
E)
سؤال
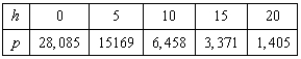
A meteorologist measures the atmospheric pressure P (in kilograms per square meter) at altitude h (in kilometers). The data are shown below. Use the regression capabilities of the graphing utility to find a linear model for the revised data points obtained by plotting the points 
A)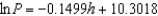
B)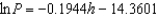
C)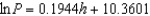
D)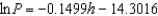
E)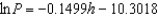
A)
B)
C)
D)
E)
سؤال
The graph of a function f is is shown below. Sketch the graph of the derivative  .
. 
A)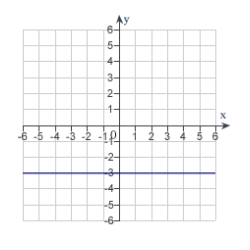
B)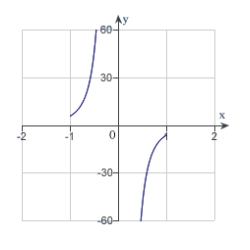
C)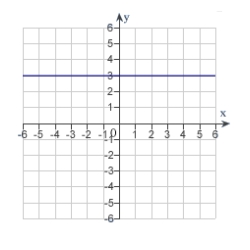
D)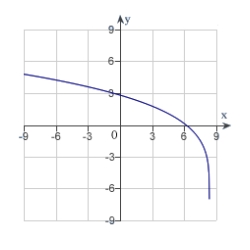
E)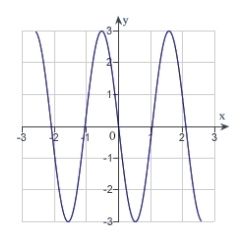
. A)
B)
C)
D)
E)
سؤال
Sketch a graph of the function  over the interval
  .
.
A)
B)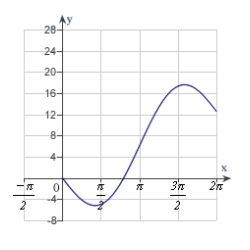
C)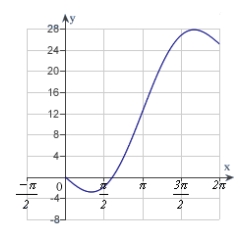
D)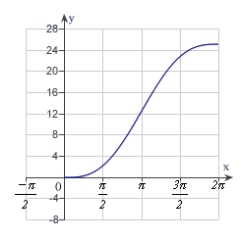
E)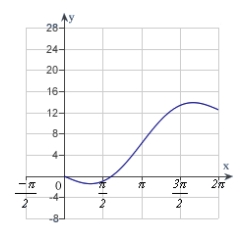
over the interval .A)
B)
C)
D)
E)
سؤال
Analyze and sketch a graph of the function  .
.
A)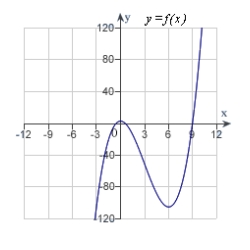
B)
C)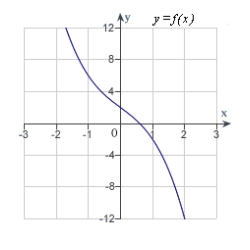
D)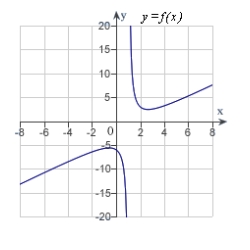
E)
.A)
B)
C)
D)
E)
سؤال
Analyze and sketch a graph of the function  .
.
A)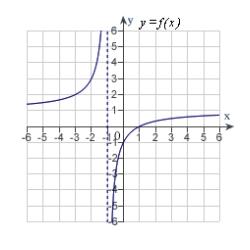
B)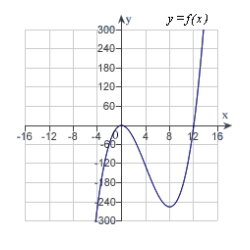
C)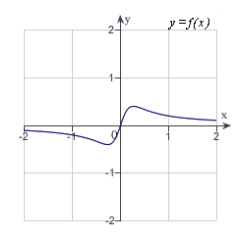
D)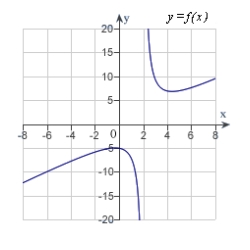
E)
.A)
B)
C)
D)
E)
سؤال
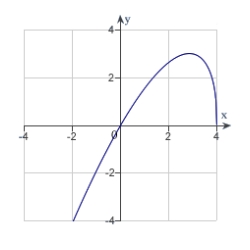
The graph of f is shown below. For which value of x is  minimum?
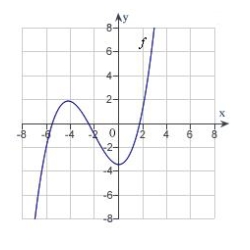
A)
B)
C)
D)
E)
minimum? A)
B)
C)
D)
E)
سؤال
Determine the slant asymptote of the graph of 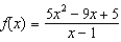 .
.
A)
B)
C)
D)
E) no slant asymptotes
.A)
B)
C)
D)
E) no slant asymptotes
سؤال
Analyze and sketch a graph of the function  .
.
A)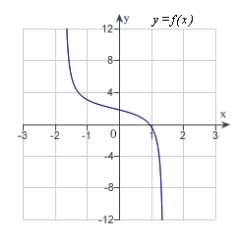
B)
C)
D)
E)
.A)
B)
C)
D)
E)
سؤال
The graph of f is shown below. For which value of x is  zero?
zero? 
A)
B)
C)
D)
E)
zero? A)
B)
C)
D)
E)
سؤال
The graph of f is shown below. On what interval is  an increasing function?
A)
B)
C)
D)
E)
an increasing function? A)
B)
C)
D)
E)
سؤال
Analyze and sketch a graph of the function 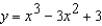 .
.
A)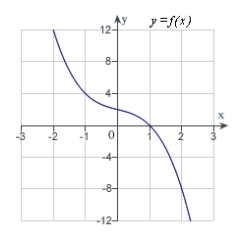
B)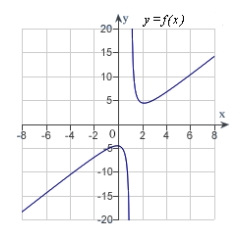
C)
D)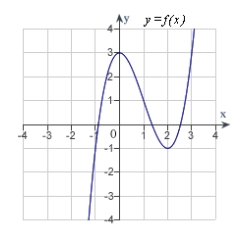
E)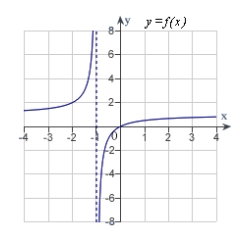
.A)
B)
C)
D)
E)
سؤال
Analyze and sketch a graph of the function  .
.
A)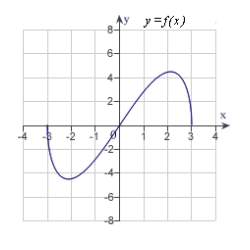
B)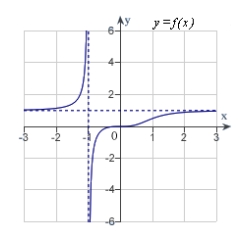
C)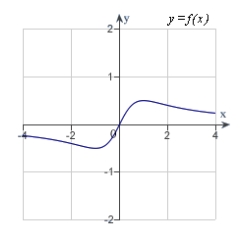
D)
E)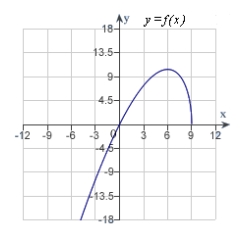
.A)
B)
C)
D)
E)
سؤال
Analyze and sketch a graph of the function  .
.
A)
B)
C)
D)
E) none of the above
.A)
B)
C)
D)
E) none of the above
سؤال
Analyze the graph of the function  . Determine any intercepts, relative extrema, points of inflection and asymptotes. Also determine where the graph is increasing or decreasing and concave up or concave down. Then identify the graph from the choices below.
A)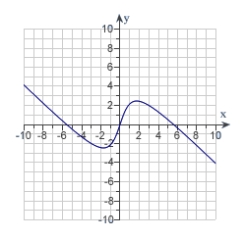
B)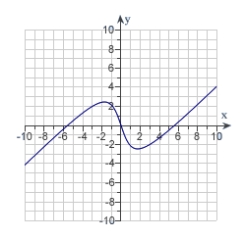
C)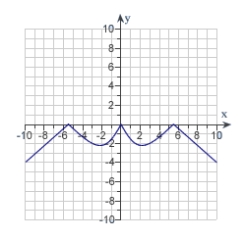
D)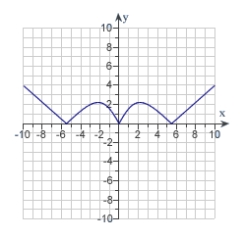
E)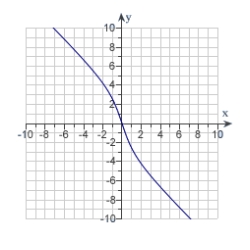
. Determine any intercepts, relative extrema, points of inflection and asymptotes. Also determine where the graph is increasing or decreasing and concave up or concave down. Then identify the graph from the choices below.A)
B)
C)
D)
E)
سؤال
Sketch a graph of the function  over the interval
  .
.
A)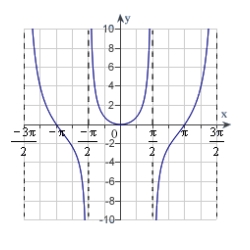
B)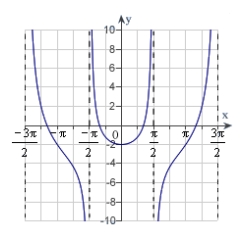
C)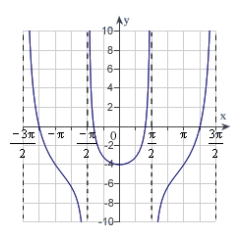
D)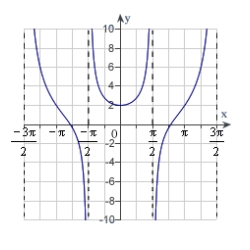
E)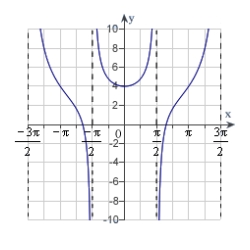
over the interval .A)
B)
C)
D)
E)
سؤال
Analyze and sketch a graph of the function  .
.
A)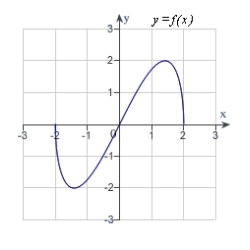
B)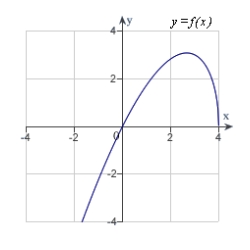
C)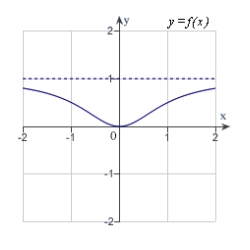
D)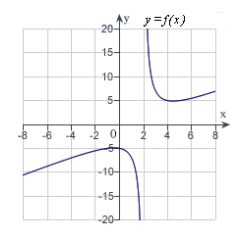
E)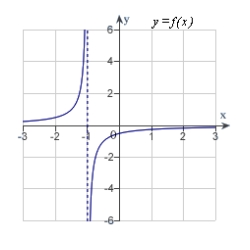
.A)
B)
C)
D)
E)
سؤال
The graph of a function f is is shown below. Sketch the graph of the derivative  .
. 
A)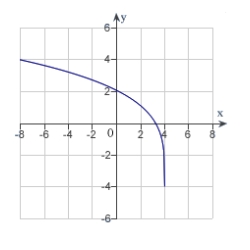
B)
C)
D)
E)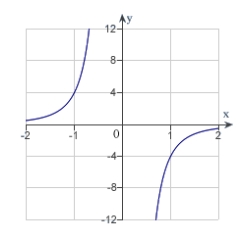
. A)
B)
C)
D)
E)
سؤال
A valve on a storage tank is opened for 4 hours to release a chemical in a manufacturing process. The flow rate R (in liters per hour) at time t (in hours) is given by the linear model 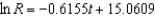 Write the linear model in exponential form.
A)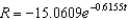
B)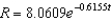
C)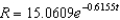
D)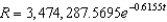
E)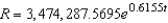
Write the linear model in exponential form.A)
B)
C)
D)
E)
سؤال
A meteorologist measures the atmospheric pressure P (in kilograms per square meter) at altitude h (in kilometers). The data are shown below. Find the rate of change of the pressure with respect to altitude when  using the relation
 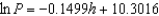 . Round your answer to one decimal place.
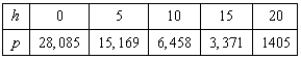
A)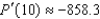
B)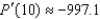
C)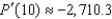
D)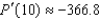
E)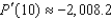
using the relation . Round your answer to one decimal place. A)
B)
C)
D)
E)

فتح الحزمة
قم بالتسجيل لفتح البطاقات في هذه المجموعة!
Unlock Deck
Unlock Deck
1/22
العب
ملء الشاشة (f)
Deck 4: Section 6: Applications of Differentiation
1
The graph of a function f is is shown below. Sketch the graph of the derivative .
A)
B)
C)
D)
E)
Sketch the graph of the derivative .A)
B)
C)
D)
E)
2
The graph of f is shown below. For which values of x is zero?
A)
B)
C)
D)
E)
zero? A)
B)
C)
D)
E)
3
The graph of a function f is is shown below. Sketch the graph of the derivative .
A)
B)
C)
D)
E)
. A)
B)
C)
D)
E)
4
A meteorologist measures the atmospheric pressure P (in kilograms per square meter) at altitude h (in kilometers). The data are shown below. Use the regression capabilities of the graphing utility to find a linear model for the revised data points obtained by plotting the points
A)
B)
C)
D)
E)
A)
B)
C)
D)
E)
فتح الحزمة
افتح القفل للوصول البطاقات البالغ عددها 22 في هذه المجموعة.
فتح الحزمة
k this deck
5
The graph of a function f is is shown below. Sketch the graph of the derivative .
A)
B)
C)
D)
E)
. A)
B)
C)
D)
E)
فتح الحزمة
افتح القفل للوصول البطاقات البالغ عددها 22 في هذه المجموعة.
فتح الحزمة
k this deck
6
Sketch a graph of the function over the interval .
A)
B)
C)
D)
E)
over the interval .A)
B)
C)
D)
E)
فتح الحزمة
افتح القفل للوصول البطاقات البالغ عددها 22 في هذه المجموعة.
فتح الحزمة
k this deck
7
Analyze and sketch a graph of the function .
A)
B)
C)
D)
E)
.A)
B)
C)
D)
E)
فتح الحزمة
افتح القفل للوصول البطاقات البالغ عددها 22 في هذه المجموعة.
فتح الحزمة
k this deck
8
Analyze and sketch a graph of the function .
A)
B)
C)
D)
E)
.A)
B)
C)
D)
E)
فتح الحزمة
افتح القفل للوصول البطاقات البالغ عددها 22 في هذه المجموعة.
فتح الحزمة
k this deck
9
The graph of f is shown below. For which value of x is minimum?
A)
B)
C)
D)
E)
minimum? A)
B)
C)
D)
E)
فتح الحزمة
افتح القفل للوصول البطاقات البالغ عددها 22 في هذه المجموعة.
فتح الحزمة
k this deck
10
Determine the slant asymptote of the graph of .
A)
B)
C)
D)
E) no slant asymptotes
.A)
B)
C)
D)
E) no slant asymptotes
فتح الحزمة
افتح القفل للوصول البطاقات البالغ عددها 22 في هذه المجموعة.
فتح الحزمة
k this deck
11
Analyze and sketch a graph of the function .
A)
B)
C)
D)
E)
.A)
B)
C)
D)
E)
فتح الحزمة
افتح القفل للوصول البطاقات البالغ عددها 22 في هذه المجموعة.
فتح الحزمة
k this deck
12
The graph of f is shown below. For which value of x is zero?
A)
B)
C)
D)
E)
zero? A)
B)
C)
D)
E)
فتح الحزمة
افتح القفل للوصول البطاقات البالغ عددها 22 في هذه المجموعة.
فتح الحزمة
k this deck
13
The graph of f is shown below. On what interval is an increasing function?
A)
B)
C)
D)
E)
an increasing function? A)
B)
C)
D)
E)
فتح الحزمة
افتح القفل للوصول البطاقات البالغ عددها 22 في هذه المجموعة.
فتح الحزمة
k this deck
14
Analyze and sketch a graph of the function .
A)
B)
C)
D)
E)
.A)
B)
C)
D)
E)
فتح الحزمة
افتح القفل للوصول البطاقات البالغ عددها 22 في هذه المجموعة.
فتح الحزمة
k this deck
15
Analyze and sketch a graph of the function .
A)
B)
C)
D)
E)
.A)
B)
C)
D)
E)
فتح الحزمة
افتح القفل للوصول البطاقات البالغ عددها 22 في هذه المجموعة.
فتح الحزمة
k this deck
16
Analyze and sketch a graph of the function .
A)
B)
C)
D)
E) none of the above
.A)
B)
C)
D)
E) none of the above
فتح الحزمة
افتح القفل للوصول البطاقات البالغ عددها 22 في هذه المجموعة.
فتح الحزمة
k this deck
17
Analyze the graph of the function . Determine any intercepts, relative extrema, points of inflection and asymptotes. Also determine where the graph is increasing or decreasing and concave up or concave down. Then identify the graph from the choices below.
A)
B)
C)
D)
E)
. Determine any intercepts, relative extrema, points of inflection and asymptotes. Also determine where the graph is increasing or decreasing and concave up or concave down. Then identify the graph from the choices below.A)
B)
C)
D)
E)
فتح الحزمة
افتح القفل للوصول البطاقات البالغ عددها 22 في هذه المجموعة.
فتح الحزمة
k this deck
18
Sketch a graph of the function over the interval .
A)
B)
C)
D)
E)
over the interval .A)
B)
C)
D)
E)
فتح الحزمة
افتح القفل للوصول البطاقات البالغ عددها 22 في هذه المجموعة.
فتح الحزمة
k this deck
19
Analyze and sketch a graph of the function .
A)
B)
C)
D)
E)
.A)
B)
C)
D)
E)
فتح الحزمة
افتح القفل للوصول البطاقات البالغ عددها 22 في هذه المجموعة.
فتح الحزمة
k this deck
20
The graph of a function f is is shown below. Sketch the graph of the derivative .
A)
B)
C)
D)
E)
. A)
B)
C)
D)
E)
فتح الحزمة
افتح القفل للوصول البطاقات البالغ عددها 22 في هذه المجموعة.
فتح الحزمة
k this deck
21
A valve on a storage tank is opened for 4 hours to release a chemical in a manufacturing process. The flow rate R (in liters per hour) at time t (in hours) is given by the linear model Write the linear model in exponential form.
A)
B)
C)
D)
E)
Write the linear model in exponential form.A)
B)
C)
D)
E)
فتح الحزمة
افتح القفل للوصول البطاقات البالغ عددها 22 في هذه المجموعة.
فتح الحزمة
k this deck
22
A meteorologist measures the atmospheric pressure P (in kilograms per square meter) at altitude h (in kilometers). The data are shown below. Find the rate of change of the pressure with respect to altitude when using the relation . Round your answer to one decimal place.
A)
B)
C)
D)
E)
using the relation . Round your answer to one decimal place. A)
B)
C)
D)
E)
فتح الحزمة
افتح القفل للوصول البطاقات البالغ عددها 22 في هذه المجموعة.
فتح الحزمة
k this deck
فتح الحزمة
افتح القفل للوصول البطاقات البالغ عددها 22 في هذه المجموعة.


