Deck 17: Nonparametric Methods
ملء الشاشة (f)
سؤال
سؤال
سؤال
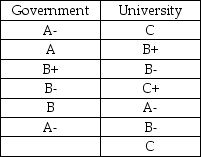
Suppose that 6 economists who work for the federal government and 7 university economists were asked to grade the effectiveness of the federal government's stimulus bill in terms of its ability to increase jobs over the next two years. The grades are shown below. Do the two groups differ in terms of their opinion?
 a. What nonparametric method is appropriate for analyzing these data?
b. Are the assumptions satisfied for applying this method? Explain.
c. State the null and alternative hypotheses.
d. Perform the test and state your conclusion at α = 0.10.
a. What nonparametric method is appropriate for analyzing these data?b. Are the assumptions satisfied for applying this method? Explain.
c. State the null and alternative hypotheses.
d. Perform the test and state your conclusion at α = 0.10.
سؤال
Consumers were asked to "rate" the taste of three popular brands of yogurt that have been modified to include fibre. The data are shown in the table below. Are there differences in the results among the three brands?
 a. What nonparametric method is appropriate for analyzing these data?
b. State the null and alternative hypotheses.
c. Perform the test and state your conclusion at α = 0.05.
d. If these data did satisfy the assumptions for performing ANOVA, what are the disadvantages of using this nonparametric method instead?
a. What nonparametric method is appropriate for analyzing these data?b. State the null and alternative hypotheses.
c. Perform the test and state your conclusion at α = 0.05.
d. If these data did satisfy the assumptions for performing ANOVA, what are the disadvantages of using this nonparametric method instead?
سؤال
سؤال
سؤال
سؤال
Consumer ratings for three popular brands of yogurt are shown below. Using the Kruskal-Wallis test to compare ratings among brands, the calculated value for the test statistic is 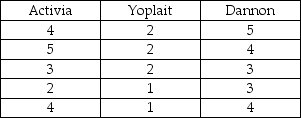
A) 8.345.
B) 12.315.
C) 4.995.
D) 2.635.
E) 402.760.
A) 8.345.
B) 12.315.
C) 4.995.
D) 2.635.
E) 402.760.
سؤال
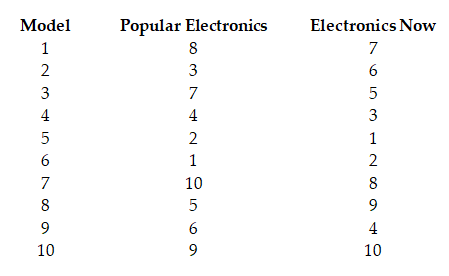
Suppose that ten new smart phone models were evaluated by two consumer electronics magazines (Popular Electronics and Electronics Now) from 1 (best) to 10 (worst) as follows. How strong is the agreement between the two magazines?
a. Why can't the Pearson correlation be used for these data?
b. The Spearman's rho is 0.745. What does this tell us about the association?
a. Why can't the Pearson correlation be used for these data?
b. The Spearman's rho is 0.745. What does this tell us about the association?
سؤال
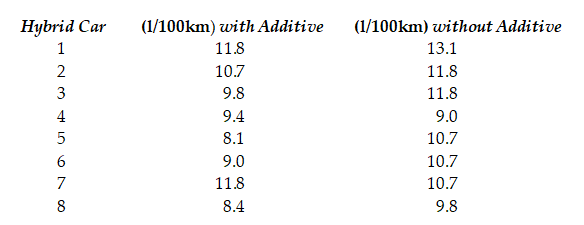
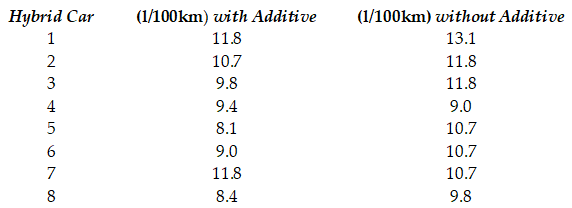
Eight hybrid cars are used to determine if there is a difference in fuel consumption (l/100 km) with and without a particular additive. The data are shown below.
a. What nonparametric method is appropriate for analyzing these data?
b. Are the assumptions satisfied for applying this method? Explain.
c. State the null and alternative hypotheses.
d. Perform the test and state your conclusion at α = 0.10.
a. What nonparametric method is appropriate for analyzing these data?
b. Are the assumptions satisfied for applying this method? Explain.
c. State the null and alternative hypotheses.
d. Perform the test and state your conclusion at α = 0.10.
سؤال
For the scatterplots shown below, indicate what about the data make nonparametric
methods appropriate for measuring the association between x and y.
a.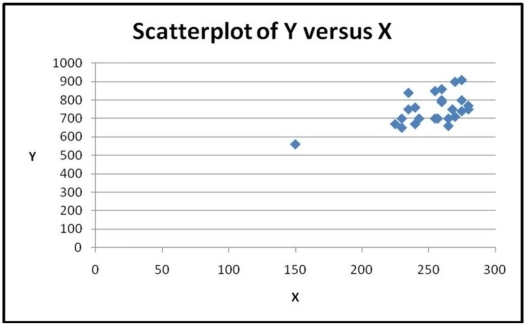 b.
b. 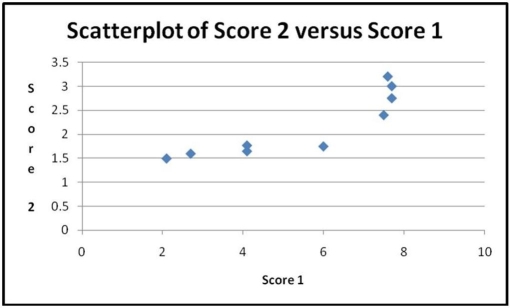
methods appropriate for measuring the association between x and y.
a.
b. سؤال
سؤال
سؤال
سؤال
سؤال
Eight hybrid cars are used to determine if there is a difference in fuel efficiency (l/100km) with and without a particular additive. Using the appropriate nonparametric method, the value of the calculated test statistic for the data shown below is
A) 3.5.
B) 5.
C) 8.
D) 30.
E) 32.5.
A) 3.5.
B) 5.
C) 8.
D) 30.
E) 32.5.
سؤال
سؤال
سؤال
The best tasting ice creams are generally high in fat content, which gives them a creamy texture. Four brands of ice cream were tested by consumers who graded their level of creaminess (A = very creamy to F = not creamy). Each brand was rated by a different group of consumers (the data are shown below). Are there differences in perceived creaminess among the four brands?
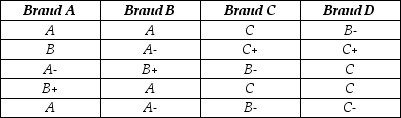 a. What nonparametric method is appropriate for analyzing these data?
b. State the null and alternative hypotheses.
c. Perform the test and state your conclusion at α = 0.10.
d. If these data did satisfy the assumptions for performing ANOVA, what are the disadvantages of using this nonparametric method instead?
a. What nonparametric method is appropriate for analyzing these data?b. State the null and alternative hypotheses.
c. Perform the test and state your conclusion at α = 0.10.
d. If these data did satisfy the assumptions for performing ANOVA, what are the disadvantages of using this nonparametric method instead?
سؤال
سؤال
Consider the following to answer the question(s) below:
Assume that a Kruskal-Wallis test is being conducted to determine whether or not all groups come from the same distribution.
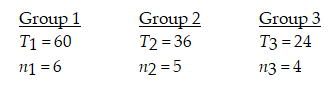
What is the correct value of the test statistic?
A) 2.16
B) 7.81
C) 48.68
D) 12.59
E) 15.69
Assume that a Kruskal-Wallis test is being conducted to determine whether or not all groups come from the same distribution.
What is the correct value of the test statistic?
A) 2.16
B) 7.81
C) 48.68
D) 12.59
E) 15.69
سؤال
سؤال
Consider the following to answer the question(s) below:
Assume that a Kruskal-Wallis test is being conducted to determine whether or not all groups come from the same distribution.
What is the critical value for α = 0.05?
A) 5.991
B) 7.815
C) 7.378
D) 12.838
E) 9.348
Assume that a Kruskal-Wallis test is being conducted to determine whether or not all groups come from the same distribution.
What is the critical value for α = 0.05?
A) 5.991
B) 7.815
C) 7.378
D) 12.838
E) 9.348
سؤال
Consider the following to answer the question(s) below:
A paint manufacturer is interested in determining whether there is a difference in time it takes for two different brands of paint to dry once they have been applied to a wall surface. To test this, the company has selected a random sample of 5 walls and applied Brand 1, and another 5 walls and applied Brand 2. The following data reflect the actual drying time in hours:
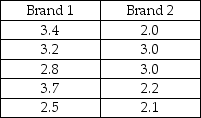
The appropriate nonparametric method to use for these data is the
A) Wilcoxon rank-sum test.
B) Kruskal-Wallis test.
C) Kendall's tau test.
D) Spearman's rho test.
E) Wilcoxon signed-rank test.
A paint manufacturer is interested in determining whether there is a difference in time it takes for two different brands of paint to dry once they have been applied to a wall surface. To test this, the company has selected a random sample of 5 walls and applied Brand 1, and another 5 walls and applied Brand 2. The following data reflect the actual drying time in hours:
The appropriate nonparametric method to use for these data is the
A) Wilcoxon rank-sum test.
B) Kruskal-Wallis test.
C) Kendall's tau test.
D) Spearman's rho test.
E) Wilcoxon signed-rank test.
سؤال
Consider the following to answer the question(s) below:
A paint manufacturer is interested in determining whether there is a difference in time it takes for two different brands of paint to dry once they have been applied to a wall surface. To test this, the company has selected a random sample of 5 walls and applied Brand 1, and another 5 walls and applied Brand 2. The following data reflect the actual drying time in hours:
The sum of all the ranks for this test is
A) 55.
B) 10.
C) 25.
D) 90.
E) 45.
سؤال
Consider the following to answer the question(s) below:
Assume that a Kruskal-Wallis test is being conducted to determine whether or not all groups come from the same distribution.
At α = 0.05,
A) we fail to reject the null hypothesis and conclude the groups come from the same distribution.
B) we reject the null hypothesis and conclude that at least one group has the different distribution from the others.
C) we support the alternative hypothesis.
D) as H = 2.16 < χcrt2 = 5.991, we fail to reject the alternative hypothesis.
E) as H = 2.16 < χcrt2 = 5.991, we reject the null hypothesis and conclude the groups do not come from the same distribution.

فتح الحزمة
قم بالتسجيل لفتح البطاقات في هذه المجموعة!
Unlock Deck
Unlock Deck
1/26
العب
ملء الشاشة (f)
Deck 17: Nonparametric Methods
1
The best tasting ice creams are generally high in fat content, which gives them a creamy texture. Four brands of ice cream (two national and two local) were tested by consumers who rated how "creamy" they tasted on a 5-point Likert type scale (1 = not creamy to 5 = very creamy). Each brand was rated by a different group of consumers. The appropriate nonparametric method to use for these data is the
A) Kruskal-Wallis test.
B) Kendall's tau test.
C) Wilcoxon signed-rank test.
D) Wilcoxon rank-sum test.
E) Spearman's rho test.
A) Kruskal-Wallis test.
B) Kendall's tau test.
C) Wilcoxon signed-rank test.
D) Wilcoxon rank-sum test.
E) Spearman's rho test.
Kruskal-Wallis test.
2
We use Spearman's Rank Correlation to find whether there is a strong association between two variables. We find that the Spearman's rho is equal to 0.18 for the sample size n = 7. The correct value of the test statistic to determine whether two variables are dependent on each other is
A) 0.409.
B) 0.754.
C) 0.875.
D) 0.771.
E) 2.42.
A) 0.409.
B) 0.754.
C) 0.875.
D) 0.771.
E) 2.42.
0.409.
3
Suppose that 6 economists who work for the federal government and 7 university economists were asked to grade the effectiveness of the federal government's stimulus bill in terms of its ability to increase jobs over the next two years. The grades are shown below. Do the two groups differ in terms of their opinion?
a. What nonparametric method is appropriate for analyzing these data?
b. Are the assumptions satisfied for applying this method? Explain.
c. State the null and alternative hypotheses.
d. Perform the test and state your conclusion at α = 0.10.
a. What nonparametric method is appropriate for analyzing these data?b. Are the assumptions satisfied for applying this method? Explain.
c. State the null and alternative hypotheses.
d. Perform the test and state your conclusion at α = 0.10.
a. Wilcoxon rank-sum / Mann-Whitney test.
b. Yes. We can assume that the sampled observations are independent (Independence Assumption) and the two groups are independent of each other (Independent Groups Assumption).
c. H0: The government and university economists have the same typical opinion.
HA: The government and university economists have different typical opinions.
d.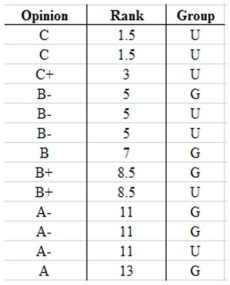 The ranks in the table above order all the opinions from the worst (Cs assigned rank1.5) to the best (A assigned rank 13). We get T1 = TGovernment = 55.5 and T2 = TUniversity = 35.5. The test statistic is T = min (55.5 , 35.5) = 35.5. The critical values from the table W1 are TL = 30 and
TU = 54. Therefore, we fail to reject the null hypothesis. At α = 0.10, there is no evidence that the government and university economists have different typical opinions about the economic stimulus bill.
b. Yes. We can assume that the sampled observations are independent (Independence Assumption) and the two groups are independent of each other (Independent Groups Assumption).
c. H0: The government and university economists have the same typical opinion.
HA: The government and university economists have different typical opinions.
d.
The ranks in the table above order all the opinions from the worst (Cs assigned rank1.5) to the best (A assigned rank 13). We get T1 = TGovernment = 55.5 and T2 = TUniversity = 35.5. The test statistic is T = min (55.5 , 35.5) = 35.5. The critical values from the table W1 are TL = 30 andTU = 54. Therefore, we fail to reject the null hypothesis. At α = 0.10, there is no evidence that the government and university economists have different typical opinions about the economic stimulus bill.
4
Consumers were asked to "rate" the taste of three popular brands of yogurt that have been modified to include fibre. The data are shown in the table below. Are there differences in the results among the three brands?
a. What nonparametric method is appropriate for analyzing these data?
b. State the null and alternative hypotheses.
c. Perform the test and state your conclusion at α = 0.05.
d. If these data did satisfy the assumptions for performing ANOVA, what are the disadvantages of using this nonparametric method instead?
a. What nonparametric method is appropriate for analyzing these data?b. State the null and alternative hypotheses.
c. Perform the test and state your conclusion at α = 0.05.
d. If these data did satisfy the assumptions for performing ANOVA, what are the disadvantages of using this nonparametric method instead?
فتح الحزمة
افتح القفل للوصول البطاقات البالغ عددها 26 في هذه المجموعة.
فتح الحزمة
k this deck
5
Suppose the Wilcoxon signed-rank test was used on ten pairs of data. If the calculated test statistic for a two-tailed test was found to be 6, at α = 0.05 we can conclude that
A) the null hypothesis should be rejected and the median of the differences is not zero.
B) the null hypothesis should not be rejected and the median of the differences is zero.
C) we know that the groups are the same.
D) the alternative hypothesis should be rejected and there is no difference between the pairs.
E) all groups are the same, as T = 6 < Tcrt = 8.
فتح الحزمة
افتح القفل للوصول البطاقات البالغ عددها 26 في هذه المجموعة.
فتح الحزمة
k this deck
6
Which of the following is not true about the Spearman's rho compared with the correlation coefficient r?
A) Spearman's rho is not sensitive to violations of the Linearity condition.
B) Spearman's rho is not significantly affected by outliers.
C) Spearman's rho can be smaller than - 1 and greater than 1.
D) Spearman's rho can be used for data with bends and outliers.
E) It can be used when only ranks are known.
فتح الحزمة
افتح القفل للوصول البطاقات البالغ عددها 26 في هذه المجموعة.
فتح الحزمة
k this deck
7
Suppose the Wilcoxon signed-rank test was used on seven pairs of data. If the calculated test statistic for a two-tailed test was found to be 5, at α = 0.05 we can conclude that
A) the null hypothesis should not be rejected and there is no evidence that the median of the differences differs from zero.
B) the null hypothesis should be rejected and that the groups are not all the same.
C) the alternative hypothesis should not be rejected and the median of the differences is not zero.
D) as T = 5 > Tcr = 2, we support the alternative hypothesis.
E) the groups are different, as T = 5 > Tcr = 2.
فتح الحزمة
افتح القفل للوصول البطاقات البالغ عددها 26 في هذه المجموعة.
فتح الحزمة
k this deck
8
Consumer ratings for three popular brands of yogurt are shown below. Using the Kruskal-Wallis test to compare ratings among brands, the calculated value for the test statistic is
A) 8.345.
B) 12.315.
C) 4.995.
D) 2.635.
E) 402.760.
A) 8.345.
B) 12.315.
C) 4.995.
D) 2.635.
E) 402.760.
فتح الحزمة
افتح القفل للوصول البطاقات البالغ عددها 26 في هذه المجموعة.
فتح الحزمة
k this deck
9
Suppose that ten new smart phone models were evaluated by two consumer electronics magazines (Popular Electronics and Electronics Now) from 1 (best) to 10 (worst) as follows. How strong is the agreement between the two magazines?
a. Why can't the Pearson correlation be used for these data?
b. The Spearman's rho is 0.745. What does this tell us about the association?
a. Why can't the Pearson correlation be used for these data?
b. The Spearman's rho is 0.745. What does this tell us about the association?
فتح الحزمة
افتح القفل للوصول البطاقات البالغ عددها 26 في هذه المجموعة.
فتح الحزمة
k this deck
10
Eight hybrid cars are used to determine if there is a difference in fuel consumption (l/100 km) with and without a particular additive. The data are shown below.
a. What nonparametric method is appropriate for analyzing these data?
b. Are the assumptions satisfied for applying this method? Explain.
c. State the null and alternative hypotheses.
d. Perform the test and state your conclusion at α = 0.10.
a. What nonparametric method is appropriate for analyzing these data?
b. Are the assumptions satisfied for applying this method? Explain.
c. State the null and alternative hypotheses.
d. Perform the test and state your conclusion at α = 0.10.
فتح الحزمة
افتح القفل للوصول البطاقات البالغ عددها 26 في هذه المجموعة.
فتح الحزمة
k this deck
11
For the scatterplots shown below, indicate what about the data make nonparametric
methods appropriate for measuring the association between x and y.
a. b.
methods appropriate for measuring the association between x and y.
a.
b. فتح الحزمة
افتح القفل للوصول البطاقات البالغ عددها 26 في هذه المجموعة.
فتح الحزمة
k this deck
12
A particular additive is claimed to increase the fuel efficiency of hybrid vehicles. Eight hybrid cars are used to determine if there is a difference in fuel efficiency (l/100km) with and without the additive. The appropriate nonparametric method to use for these data is the
A) Kruskal-Wallis test.
B) Kendall's tau test.
C) Wilcoxon signed-rank test.
D) Wilcoxon rank-sum test.
E) Spearman's rho test.
A) Kruskal-Wallis test.
B) Kendall's tau test.
C) Wilcoxon signed-rank test.
D) Wilcoxon rank-sum test.
E) Spearman's rho test.
فتح الحزمة
افتح القفل للوصول البطاقات البالغ عددها 26 في هذه المجموعة.
فتح الحزمة
k this deck
13
Which of the following statements is false regarding nonparametric methods?
A) Nonparametric methods are appropriate when we want to treat the data as ordinal.
B) Compared to the correlation coefficient r, Spearman's rho is less affected by outliers in the data.
C) The Wilcoxon rank-sum test is the nonparametric alternative to the paired t-test.
D) Spearman's rho is always between -1 and 1.
E) The Friedman test is appropriate for a randomized block design.
فتح الحزمة
افتح القفل للوصول البطاقات البالغ عددها 26 في هذه المجموعة.
فتح الحزمة
k this deck
14
Suppose that 6 economists who work for the federal government and 7 university economists were asked to predict the percentage change in the Canada's GDP over the three year period from January 2013 to January 2016. The Wilcoxon rank-sum test was used to determine if the two groups differ in their predictions. The value of the test statistic was calculated to be 29.5. At α = 0.05, we can conclude that
A) the null hypothesis should be rejected.
B) the alternative hypothesis should not be rejected.
C) there is a difference in predictions provided by the two groups of economists.
D) since TL= 28 < 29.5 < TU = 56, we can conclude that two groups of economists have different predictions.
E) the null hypothesis should not be rejected; there is no significant difference in predictions provided by the two groups of economists.
فتح الحزمة
افتح القفل للوصول البطاقات البالغ عددها 26 في هذه المجموعة.
فتح الحزمة
k this deck
15
A management professor was teaching a course in business leadership as part of an executive MBA program. She divided her class of 10 executives into two equal sized groups and used a different approach (case study and online interactive) to teach about various leadership styles. To compare the effectiveness of the two approaches, the appropriate nonparametric procedure is the
A) Kruskal-Wallis test.
B) Spearman's rho test.
C) Wilcoxon signed-rank test.
D) Wilcoxon rank-sum test.
E) Friedman test.
A) Kruskal-Wallis test.
B) Spearman's rho test.
C) Wilcoxon signed-rank test.
D) Wilcoxon rank-sum test.
E) Friedman test.
فتح الحزمة
افتح القفل للوصول البطاقات البالغ عددها 26 في هذه المجموعة.
فتح الحزمة
k this deck
16
Eight hybrid cars are used to determine if there is a difference in fuel efficiency (l/100km) with and without a particular additive. Using the appropriate nonparametric method, the value of the calculated test statistic for the data shown below is
A) 3.5.
B) 5.
C) 8.
D) 30.
E) 32.5.
A) 3.5.
B) 5.
C) 8.
D) 30.
E) 32.5.
فتح الحزمة
افتح القفل للوصول البطاقات البالغ عددها 26 في هذه المجموعة.
فتح الحزمة
k this deck
17
Suppose the Kruskal-Wallis test was used to compare four groups. If the test statistic value was found to be 9.545, using α = 0.05 we should
A) reject the alternative hypothesis.
B) not reject the null hypothesis.
C) conclude that the groups are all the same.
D) reject the null hypothesis and conclude that at least one of the groups has a different distribution from the others.
E) compare test static with the critical value χ2 = 7.815 and conclude that all four groups have the same distribution.
فتح الحزمة
افتح القفل للوصول البطاقات البالغ عددها 26 في هذه المجموعة.
فتح الحزمة
k this deck
18
The Wilcoxon signed-rank test is used to test which of the following types of hypotheses?
A) It is used to test hypotheses involving the median of paired samples.
B) It is used to test hypotheses involving three or more population medians.
C) It is used to test hypotheses involving the variances of two or more populations.
D) It is used to test hypotheses involving the variances of paired samples.
E) It is used to test hypotheses involving two or more population proportions.
فتح الحزمة
افتح القفل للوصول البطاقات البالغ عددها 26 في هذه المجموعة.
فتح الحزمة
k this deck
19
The best tasting ice creams are generally high in fat content, which gives them a creamy texture. Four brands of ice cream were tested by consumers who graded their level of creaminess (A = very creamy to F = not creamy). Each brand was rated by a different group of consumers (the data are shown below). Are there differences in perceived creaminess among the four brands?
a. What nonparametric method is appropriate for analyzing these data?
b. State the null and alternative hypotheses.
c. Perform the test and state your conclusion at α = 0.10.
d. If these data did satisfy the assumptions for performing ANOVA, what are the disadvantages of using this nonparametric method instead?
a. What nonparametric method is appropriate for analyzing these data?b. State the null and alternative hypotheses.
c. Perform the test and state your conclusion at α = 0.10.
d. If these data did satisfy the assumptions for performing ANOVA, what are the disadvantages of using this nonparametric method instead?
فتح الحزمة
افتح القفل للوصول البطاقات البالغ عددها 26 في هذه المجموعة.
فتح الحزمة
k this deck
20
Suppose that ten new smart phone models were evaluated by two consumer electronics magazines from 1 (best) to 10 (worst). Spearman's rho was calculated to be - 0.45. We can say that
A) there is a high level of agreement between the two magazine rankings.
B) the association between the two magazine rankings is strong and positive.
C) we use the Spearman's test as the Quantitative Variables Condition is satisfied.
D) the association between the two magazine rankings is moderate and negative.
E) as - 0.45 is roughly close to zero, there is very strong association between the two magazine ratings.
فتح الحزمة
افتح القفل للوصول البطاقات البالغ عددها 26 في هذه المجموعة.
فتح الحزمة
k this deck
21
Consider the following to answer the question(s) below:
Assume that a Kruskal-Wallis test is being conducted to determine whether or not all groups come from the same distribution.
What is the correct value of the test statistic?
A) 2.16
B) 7.81
C) 48.68
D) 12.59
E) 15.69
Assume that a Kruskal-Wallis test is being conducted to determine whether or not all groups come from the same distribution.
What is the correct value of the test statistic?
A) 2.16
B) 7.81
C) 48.68
D) 12.59
E) 15.69
فتح الحزمة
افتح القفل للوصول البطاقات البالغ عددها 26 في هذه المجموعة.
فتح الحزمة
k this deck
22
Using Tukey's quick test to determine whether there is a difference in the two brands we can say that
A) the total of the values is 6 and we conclude there is no significant difference.
B) the total of the values is 6 and we conclude there is a significant difference.
C) the total of the values is 4 and we conclude there is no significant difference.
D) the total of the values is 4 and we conclude there is a significant difference.
E) the total of the values is 9 and we conclude there is a significant difference.
فتح الحزمة
افتح القفل للوصول البطاقات البالغ عددها 26 في هذه المجموعة.
فتح الحزمة
k this deck
23
Consider the following to answer the question(s) below:
Assume that a Kruskal-Wallis test is being conducted to determine whether or not all groups come from the same distribution.
What is the critical value for α = 0.05?
A) 5.991
B) 7.815
C) 7.378
D) 12.838
E) 9.348
Assume that a Kruskal-Wallis test is being conducted to determine whether or not all groups come from the same distribution.
What is the critical value for α = 0.05?
A) 5.991
B) 7.815
C) 7.378
D) 12.838
E) 9.348
فتح الحزمة
افتح القفل للوصول البطاقات البالغ عددها 26 في هذه المجموعة.
فتح الحزمة
k this deck
24
Consider the following to answer the question(s) below:
A paint manufacturer is interested in determining whether there is a difference in time it takes for two different brands of paint to dry once they have been applied to a wall surface. To test this, the company has selected a random sample of 5 walls and applied Brand 1, and another 5 walls and applied Brand 2. The following data reflect the actual drying time in hours:
The appropriate nonparametric method to use for these data is the
A) Wilcoxon rank-sum test.
B) Kruskal-Wallis test.
C) Kendall's tau test.
D) Spearman's rho test.
E) Wilcoxon signed-rank test.
فتح الحزمة
افتح القفل للوصول البطاقات البالغ عددها 26 في هذه المجموعة.
فتح الحزمة
k this deck
25
Consider the following to answer the question(s) below:
A paint manufacturer is interested in determining whether there is a difference in time it takes for two different brands of paint to dry once they have been applied to a wall surface. To test this, the company has selected a random sample of 5 walls and applied Brand 1, and another 5 walls and applied Brand 2. The following data reflect the actual drying time in hours:
The sum of all the ranks for this test is
A) 55.
B) 10.
C) 25.
D) 90.
E) 45.
فتح الحزمة
افتح القفل للوصول البطاقات البالغ عددها 26 في هذه المجموعة.
فتح الحزمة
k this deck
26
Consider the following to answer the question(s) below:
Assume that a Kruskal-Wallis test is being conducted to determine whether or not all groups come from the same distribution.
At α = 0.05,
A) we fail to reject the null hypothesis and conclude the groups come from the same distribution.
B) we reject the null hypothesis and conclude that at least one group has the different distribution from the others.
C) we support the alternative hypothesis.
D) as H = 2.16 < χcrt2 = 5.991, we fail to reject the alternative hypothesis.
E) as H = 2.16 < χcrt2 = 5.991, we reject the null hypothesis and conclude the groups do not come from the same distribution.
فتح الحزمة
افتح القفل للوصول البطاقات البالغ عددها 26 في هذه المجموعة.
فتح الحزمة
k this deck
فتح الحزمة
افتح القفل للوصول البطاقات البالغ عددها 26 في هذه المجموعة.


