Deck 4: Analyzing Change: Applications of Derivatives
ملء الشاشة (f)
سؤال
Find the derivative. 
A)
B)
C)
D)
E)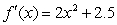
A)
B)
C)
D)
E)
سؤال
The humidity is currently 32% and falling at a rate of 4 percentage points per hour. Estimate the change in humidity over the next 20 minutes.
A) percentage points
B) percentage points
C) percentage points
D) percentage points
E) percentage points
A)
percentage pointsB)
percentage pointsC)
percentage pointsD)
percentage pointsE)
percentage points سؤال
If  and
and  , estimate
  .
.
A) -81.20
B) 17.20
C) 25.00
D) -61.20
E) 20.00
and , estimate .A) -81.20
B) 17.20
C) 25.00
D) -61.20
E) 20.00
سؤال
For the given function, find the relative minima. 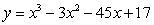
A)
B)
C)
D)
E) no relative minima
A)
B)
C)
D)
E) no relative minima
سؤال
The population of a certain region between 1790 and 2000 can be modeled by 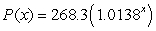 thousand people x years after 1790. Find the rate of change of the population of the region in 2000 to the nearest thousand people per year.
A) 4,771 thousand people per year
B) 21 thousand people per year
C) 988 thousand people per year
D) 30 thousand people per year
E) 65 thousand people per year
thousand people x years after 1790. Find the rate of change of the population of the region in 2000 to the nearest thousand people per year.A) 4,771 thousand people per year
B) 21 thousand people per year
C) 988 thousand people per year
D) 30 thousand people per year
E) 65 thousand people per year
سؤال
The population of a certain region between 1790 and 2000 can be modeled by 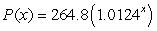 thousand people x years after 1790. Use the rate of change of the population of the region in 2000 to estimate, to the nearest thousand, the population in 2003.
A) 3,655,000 people
B) 4,000 people
C) 5,326,000 people
D) 3,797,000 people
E) 3,653,000 people
thousand people x years after 1790. Use the rate of change of the population of the region in 2000 to estimate, to the nearest thousand, the population in 2003.A) 3,655,000 people
B) 4,000 people
C) 5,326,000 people
D) 3,797,000 people
E) 3,653,000 people
سؤال
Find all relative maxima of the given function. 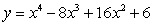
A)
B)
C)
D) ,
, 
E) no relative maxima
A)
B)
C)
D)
, E) no relative maxima
سؤال
The percentage of southern Australian grasshopper eggs that hatch as a function of temperature (for temperatures between 7°C and 25°C) can be modeled as  where t is the temperature in °C, data from
  What temperature between 7°C and 25°C corresponds to the greatest percentage of eggs hatching? What is the percentage at this input?
A) 9.4°C, 94.8%
B) 13°C, 12.9%
C) 7°C, 70.3%
D) 2.5°C, 25%
E) 14°C, 14.17%
where t is the temperature in °C, data from What temperature between 7°C and 25°C corresponds to the greatest percentage of eggs hatching? What is the percentage at this input?A) 9.4°C, 94.8%
B) 13°C, 12.9%
C) 7°C, 70.3%
D) 2.5°C, 25%
E) 14°C, 14.17%
سؤال
Suppose the revenue from new car sales between 1980 and 2000 can be modeled as a function of advertising expenditures, by  billion dollars of revenue, when x billion dollars is spent on advertising, for
  . What does the model estimate as the revenue when $5.8 billion is spent on advertising? Round your answer to the nearest billion dollars.
A) 1,360 billion dollars
B) 892 billion dollars
C) 1,527 billion dollars
D) 103,777 billion dollars
E) 1,770 billion dollars
billion dollars of revenue, when x billion dollars is spent on advertising, for . What does the model estimate as the revenue when $5.8 billion is spent on advertising? Round your answer to the nearest billion dollars.A) 1,360 billion dollars
B) 892 billion dollars
C) 1,527 billion dollars
D) 103,777 billion dollars
E) 1,770 billion dollars
سؤال
Find the derivative. 
A)
B)
C)
D)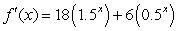
E)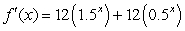
A)
B)
C)
D)
E)
سؤال
Find the relative minima, and use a graphing utility to check your results. 
A)
B)
C)
D)
E) does not exist
A)
B)
C)
D)
E) does not exist
سؤال
The figure shows the annual cost for a one-million-dollar term life insurance policy as a function of the age of the insured person. 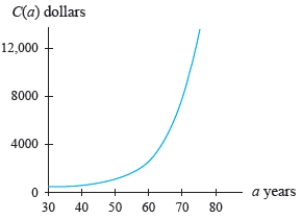 Write the linearization of C at 60.
A)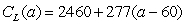
B)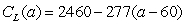
C)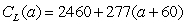
D)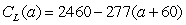
E)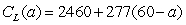
Write the linearization of C at 60.A)
B)
C)
D)
E)
سؤال
The amount in an investment after t years is given by  thousand dollars Find the rate of change for the amount after 13 years and interpret the answer.
A) The rate of change is $64.62 thousand per year, which means the investment has increased by approximately $65 thousand every year for 13 years.
B) The rate of change is $64.62 thousand per year, which means the investment is increasing by approximately $65 thousand that year.
C) The rate of change is $32.51 thousand per year, which means the investment has increased by approximately $33 thousand every year for 13 years.
D) The rate of change is $32.51 thousand per year, which means the investment has increased by approximately $33 thousand that year.
E) The rate of change is $6.13 thousand per year, which means the investment has increased by approximately $6 thousand every year for 13 years.
thousand dollars Find the rate of change for the amount after 13 years and interpret the answer.A) The rate of change is $64.62 thousand per year, which means the investment has increased by approximately $65 thousand every year for 13 years.
B) The rate of change is $64.62 thousand per year, which means the investment is increasing by approximately $65 thousand that year.
C) The rate of change is $32.51 thousand per year, which means the investment has increased by approximately $33 thousand every year for 13 years.
D) The rate of change is $32.51 thousand per year, which means the investment has increased by approximately $33 thousand that year.
E) The rate of change is $6.13 thousand per year, which means the investment has increased by approximately $6 thousand every year for 13 years.
سؤال
Suppose the flow rate (in cubic feet per second, cfs) of a river in the first 11 hours after the beginning of a severe thunderstorm can be modeled as  cfs where h is the number of hours after the storm began. What are the flow rates for
  and
and  ?
?
A)
B)
C)
D)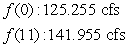
E)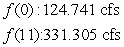
cfs where h is the number of hours after the storm began. What are the flow rates for and ?A)
B)
C)
D)
E)
سؤال
For the given function, find the relative maxima. 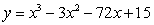
A)
B)
C)
D)
E) no relative maxima
A)
B)
C)
D)
E) no relative maxima
سؤال
The percentage of southern Australian grasshopper eggs that hatch as a function of temperature (for temperatures between 7°C and 25°C) can be modeled as  where t is the temperature in °C, data from
  What temperature between 7°C and 25°C corresponds to the least percentage of eggs hatching? What is the percentage at this input?
A) 25°C, 5.7%
B) 24°C, 5%
C) 7°C, 7.3%
D) 2.5°C, 25%
E) 14°C, 4.17%
where t is the temperature in °C, data from What temperature between 7°C and 25°C corresponds to the least percentage of eggs hatching? What is the percentage at this input?A) 25°C, 5.7%
B) 24°C, 5%
C) 7°C, 7.3%
D) 2.5°C, 25%
E) 14°C, 4.17%
سؤال
For fiddler crabs, the weight of the claw can be modeled as 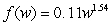 pounds when the weight of the body is w pounds. Describe the direction and concavity of
  for positive values of w.
A) The function f is increasing, concave up for .
.
B) The function f is decreasing, concave up for .
.
C) The function f is increasing, convex up for .
.
D) The function f is decreasing, convex up for .
.
E) The function f is decreasing, convex up for .
.
pounds when the weight of the body is w pounds. Describe the direction and concavity of for positive values of w.A) The function f is increasing, concave up for
.B) The function f is decreasing, concave up for
.C) The function f is increasing, convex up for
.D) The function f is decreasing, convex up for
.E) The function f is decreasing, convex up for
. سؤال
The future value of an investment after t years is given by 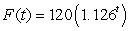 thousand dollars. Use the linearization to estimate the future value after 10.5 years.
A) $ 416.484 thousand dollars
B) $ 49.508 thousand dollars
C) $ 32.419 thousand dollars
D) $ 21.501 thousand dollars
E) $ 216.734 thousand dollars
thousand dollars. Use the linearization to estimate the future value after 10.5 years.A) $ 416.484 thousand dollars
B) $ 49.508 thousand dollars
C) $ 32.419 thousand dollars
D) $ 21.501 thousand dollars
E) $ 216.734 thousand dollars
سؤال
Estimate the input value(s) where the function has a relative extreme point. Identify each relative extreme as a maximum or minimum, and indicate whether the derivative of the function at that point is zero or does not exist. 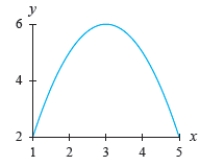
A) relative maximum, 0
B) relative maximum, does not exist
C) relative minimum, 0
D) relative minimum, does not exist
E) relative maximum, 0
A)
relative maximum, 0B)
relative maximum, does not existC)
relative minimum, 0D)
relative minimum, does not existE)
relative maximum, 0 سؤال
A street vendor constructs the table below on the basis of sales data. Construct a model for consumer expenditure (revenue for the vendor). Sales of Roses, Given the Price per Dozen 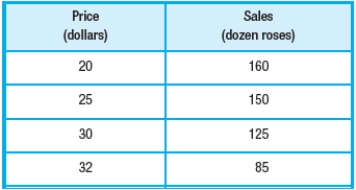
A)
B)
C)
D)
E)
A)
B)
C)
D)
E)
سؤال
During the summer, an art student makes and sells necklaces at the beach. Last summer she sold the necklaces for $10 each and her sales averaged 20 necklaces per day. When she increased the price by $1, she found that she lost 2 sales per day. Assume that this pattern would continue if she kept increasing the price; that is, for every dollar she raised the price, she would sell 2 fewer necklaces per day. Write a model for the student's daily revenue from the sale of x necklaces.
A)
B)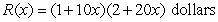
C)
D)
E)
A)
B)
C)
D)
E)
سؤال
Given the units of measure for production and the units of measure for cost or revenue. Write the units of measure for the indicated marginal. Total cost is given by  million dollars when q million units are produced;
  .
.
A) dollars per unit
B) units
C) units per million dollars
D) million dollars
E) dollars
million dollars when q million units are produced; .A) dollars per unit
B) units
C) units per million dollars
D) million dollars
E) dollars
سؤال
Find the second derivative. 
A)
B)
C)
D)
E)
A)
B)
C)
D)
E)
سؤال
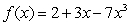
Find the second derivative of the function  .
.
A)
B)
C)
D)
E)
.A)
B)
C)
D)
E)
سؤال
The yearly amount of garbage (in million tons) taken to a landfill outside a city during selected years from 1980 through 2010 is given below. Write a model for the data. 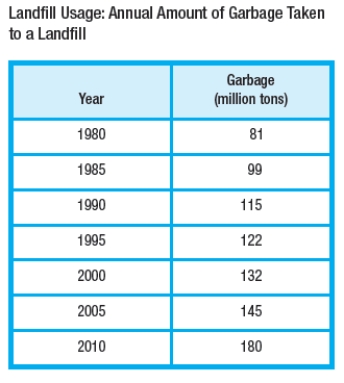
A)
B)
C)
D)
E)
A)
B)
C)
D)
E)
سؤال
A portion of the shoreline of an island is in the shape of the curve  . A hut is located at point C, as shown below. Supplies are delivered by boat to the shoreline. It costs $10 per mile to hire someone to transport the supplies from the shore to the hut. How much does the overland transportation cost?
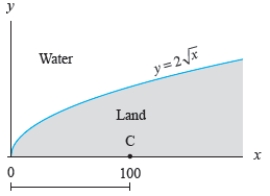
A) $199
B) $632
C) $196
D) $205
E) $193
. A hut is located at point C, as shown below. Supplies are delivered by boat to the shoreline. It costs $10 per mile to hire someone to transport the supplies from the shore to the hut. How much does the overland transportation cost? A) $199
B) $632
C) $196
D) $205
E) $193
سؤال
Find 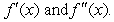
A)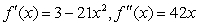
B)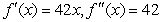
C)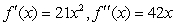
D)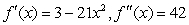
E)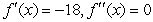
A)
B)
C)
D)
E)
سؤال
سؤال
Find 
A)
B)
C)
D)
E)
A)
B)
C)
D)
E)
سؤال
Find the second derivative. 
A)
B)
C)
D)
E)
A)
B)
C)
D)
E)
سؤال
The table lists the time in seconds that an average athlete takes to swim 100 meters freestyle at age x years. Find a model for the data. Time That an Average Athlete Takes to Swim 100 Meters
Freestyle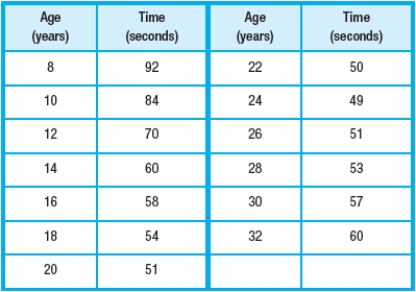
A)
B)
C)
D)
E)
Freestyle
A)
B)
C)
D)
E)
سؤال
A pizza parlor has been experimenting with lowering the price of their large one-topping pizza to promote sales. The average revenues from the sale of large one-topping pizzas on a Friday night (5 P.M. to midnight) at various prices are given below. Find a model for the data. 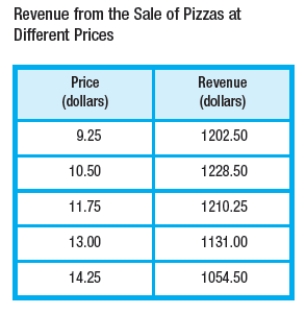
A)
B)
C)
D)
E)
A)
B)
C)
D)
E)
سؤال
A function and its first and second derivatives are given. Use these to find any points of inflection. 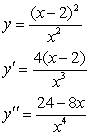
A)
B)
C)
D)
E) no points of inflection
A)
B)
C)
D)
E) no points of inflection
سؤال
سؤال
Find the first and second derivatives of the function. 
A)
B)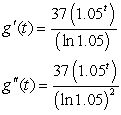
C)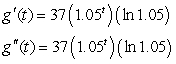
D)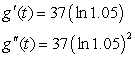
E)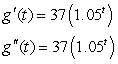
A)
B)
C)
D)
E)
سؤال
Write a model for the output variable in terms of one input variable. A rectangular-shaped garden has one side along the side of a house. The other three sides are to be enclosed with 60 feet of fencing. What is the largest possible area of such a garden?
A)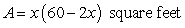
B)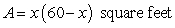
C)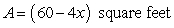
D)
E)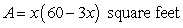
A)
B)
C)
D)
E)
سؤال
Find the first and second derivatives of the function. 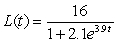
A)
B)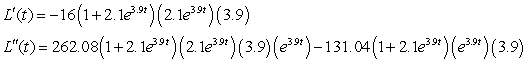
C)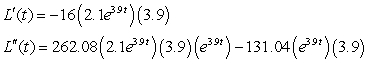
D)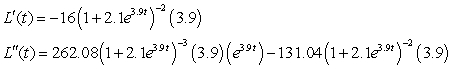
E)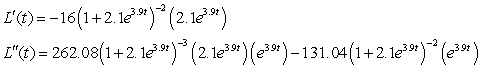
A)
B)
C)
D)
E)
سؤال
The figure shows an estimate of the ultimate crude oil production recoverable from Earth. Estimate the two inflection points on the graph. 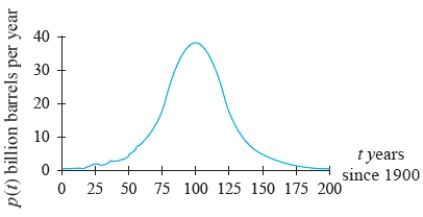
A) (79, 23), (120, 23)
B) (55, 10), (130, 10)
C) (22, 3), (165, 3)
D) (90, 30), (110, 30)
E) (0, 0), (200, 0)
A) (79, 23), (120, 23)
B) (55, 10), (130, 10)
C) (22, 3), (165, 3)
D) (90, 30), (110, 30)
E) (0, 0), (200, 0)
سؤال
Given the units of measure for production and the units of measure for cost or revenue. Write a sentence interpreting the marginal as an increase. Revenue is given by  hundred dollars when q thousand units are sold;
  .
.
A) When 16 thousand units are sold, revenue is increasing by $0.30 per unit.
B) When 16 thousand units are sold, revenue is decreasing by $0.30 per unit.
C) When 16 thousand units are sold, revenue is increasing by $30 per unit.
D) When 16 thousand units are sold, revenue is decreasing by $30 per unit.
E) When 16 thousand units are sold, revenue is increasing by $3 per unit.
hundred dollars when q thousand units are sold; .A) When 16 thousand units are sold, revenue is increasing by $0.30 per unit.
B) When 16 thousand units are sold, revenue is decreasing by $0.30 per unit.
C) When 16 thousand units are sold, revenue is increasing by $30 per unit.
D) When 16 thousand units are sold, revenue is decreasing by $30 per unit.
E) When 16 thousand units are sold, revenue is increasing by $3 per unit.
سؤال
A function and its first and second derivatives are given. Use these to find all critical values. 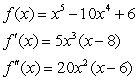
A)
B)
C)
D)
E)
A)
B)
C)
D)
E)
سؤال
Find the derivative of the function. 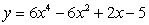
A)
B)
C)
D)
E)
A)
B)
C)
D)
E)
سؤال
Find  .
. 
A)
B)
C)
D)
E)
. A)
B)
C)
D)
E)
سؤال
Assume that s, r, and h are differentiable functions of t. If  , find
  when
when 
A) -0.20
B) 1.08
C) 2.33
D) -0.33
E) 1.40
, find when A) -0.20
B) 1.08
C) 2.33
D) -0.33
E) 1.40
سؤال
Find the derivative of the function. 
A)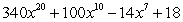
B)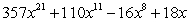
C)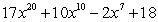
D)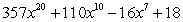
E)
A)
B)
C)
D)
E)
سؤال
The amount of water an oak tree can remove from the ground is related to the tree's size. Suppose that an oak tree transpires  where g is the girth in feet of the tree trunk, measured 5 feet above the ground. A tree is currently 5 feet in girth and is gaining 2 inches of girth per year. If t is time measured in years, evaluate
A) 0.432 gallons/day per year
B) 0.995 gallons/day per year
C) 2.312 gallons/day per year
D) 7.586 gallons/day per year
E) 90.027 gallons/day per year
where g is the girth in feet of the tree trunk, measured 5 feet above the ground. A tree is currently 5 feet in girth and is gaining 2 inches of girth per year. If t is time measured in years, evaluate A) 0.432 gallons/day per year
B) 0.995 gallons/day per year
C) 2.312 gallons/day per year
D) 7.586 gallons/day per year
E) 90.027 gallons/day per year
سؤال
سؤال
Differentiate the given function with respect to t where r is the radius, and A is the area of the circle. Then, evaluate  with
with 

A) 49
B) 56
C) 16
D) 14
E) 112
with A) 49
B) 56
C) 16
D) 14
E) 112
سؤال
Find  .
. 
A)
B)
C)
D)
E)
. A)
B)
C)
D)
E)
سؤال
Boyle's law for enclosed gases states that at a constant temperature, the pressure is related to the volume by the equation  , where k is a constant. If the volume is increasing at a rate of 8 cubic inches per hour, at what rate is the pressure changing when the volume is 40 cubic inches and
  inch-pounds?
A) 0.003 lb/in2/hr
B) -0.003 lb/in2/hr
C) -12.800 lb/in2/hr
D) 1.000 lb/in2/hr
E) -0.025 lb/in2/hr
, where k is a constant. If the volume is increasing at a rate of 8 cubic inches per hour, at what rate is the pressure changing when the volume is 40 cubic inches and inch-pounds?A) 0.003 lb/in2/hr
B) -0.003 lb/in2/hr
C) -12.800 lb/in2/hr
D) 1.000 lb/in2/hr
E) -0.025 lb/in2/hr
سؤال
Calculate the derivative of the function with the appropriate formula. 
A)
B)
C)
D)
E)
A)
B)
C)
D)
E)

فتح الحزمة
قم بالتسجيل لفتح البطاقات في هذه المجموعة!
Unlock Deck
Unlock Deck
1/50
العب
ملء الشاشة (f)
Deck 4: Analyzing Change: Applications of Derivatives
1
Find the derivative.
A)
B)
C)
D)
E)
A)
B)
C)
D)
E)
2
The humidity is currently 32% and falling at a rate of 4 percentage points per hour. Estimate the change in humidity over the next 20 minutes.
A) percentage points
B) percentage points
C) percentage points
D) percentage points
E) percentage points
A)
percentage pointsB)
percentage pointsC)
percentage pointsD)
percentage pointsE)
percentage points percentage points 3
If and , estimate .
A) -81.20
B) 17.20
C) 25.00
D) -61.20
E) 20.00
and , estimate .A) -81.20
B) 17.20
C) 25.00
D) -61.20
E) 20.00
17.20
4
For the given function, find the relative minima.
A)
B)
C)
D)
E) no relative minima
A)
B)
C)
D)
E) no relative minima
فتح الحزمة
افتح القفل للوصول البطاقات البالغ عددها 50 في هذه المجموعة.
فتح الحزمة
k this deck
5
The population of a certain region between 1790 and 2000 can be modeled by thousand people x years after 1790. Find the rate of change of the population of the region in 2000 to the nearest thousand people per year.
A) 4,771 thousand people per year
B) 21 thousand people per year
C) 988 thousand people per year
D) 30 thousand people per year
E) 65 thousand people per year
thousand people x years after 1790. Find the rate of change of the population of the region in 2000 to the nearest thousand people per year.A) 4,771 thousand people per year
B) 21 thousand people per year
C) 988 thousand people per year
D) 30 thousand people per year
E) 65 thousand people per year
فتح الحزمة
افتح القفل للوصول البطاقات البالغ عددها 50 في هذه المجموعة.
فتح الحزمة
k this deck
6
The population of a certain region between 1790 and 2000 can be modeled by thousand people x years after 1790. Use the rate of change of the population of the region in 2000 to estimate, to the nearest thousand, the population in 2003.
A) 3,655,000 people
B) 4,000 people
C) 5,326,000 people
D) 3,797,000 people
E) 3,653,000 people
thousand people x years after 1790. Use the rate of change of the population of the region in 2000 to estimate, to the nearest thousand, the population in 2003.A) 3,655,000 people
B) 4,000 people
C) 5,326,000 people
D) 3,797,000 people
E) 3,653,000 people
فتح الحزمة
افتح القفل للوصول البطاقات البالغ عددها 50 في هذه المجموعة.
فتح الحزمة
k this deck
7
Find all relative maxima of the given function.
A)
B)
C)
D) ,
E) no relative maxima
A)
B)
C)
D)
, E) no relative maxima
فتح الحزمة
افتح القفل للوصول البطاقات البالغ عددها 50 في هذه المجموعة.
فتح الحزمة
k this deck
8
The percentage of southern Australian grasshopper eggs that hatch as a function of temperature (for temperatures between 7°C and 25°C) can be modeled as where t is the temperature in °C, data from What temperature between 7°C and 25°C corresponds to the greatest percentage of eggs hatching? What is the percentage at this input?
A) 9.4°C, 94.8%
B) 13°C, 12.9%
C) 7°C, 70.3%
D) 2.5°C, 25%
E) 14°C, 14.17%
where t is the temperature in °C, data from What temperature between 7°C and 25°C corresponds to the greatest percentage of eggs hatching? What is the percentage at this input?A) 9.4°C, 94.8%
B) 13°C, 12.9%
C) 7°C, 70.3%
D) 2.5°C, 25%
E) 14°C, 14.17%
فتح الحزمة
افتح القفل للوصول البطاقات البالغ عددها 50 في هذه المجموعة.
فتح الحزمة
k this deck
9
Suppose the revenue from new car sales between 1980 and 2000 can be modeled as a function of advertising expenditures, by billion dollars of revenue, when x billion dollars is spent on advertising, for . What does the model estimate as the revenue when $5.8 billion is spent on advertising? Round your answer to the nearest billion dollars.
A) 1,360 billion dollars
B) 892 billion dollars
C) 1,527 billion dollars
D) 103,777 billion dollars
E) 1,770 billion dollars
billion dollars of revenue, when x billion dollars is spent on advertising, for . What does the model estimate as the revenue when $5.8 billion is spent on advertising? Round your answer to the nearest billion dollars.A) 1,360 billion dollars
B) 892 billion dollars
C) 1,527 billion dollars
D) 103,777 billion dollars
E) 1,770 billion dollars
فتح الحزمة
افتح القفل للوصول البطاقات البالغ عددها 50 في هذه المجموعة.
فتح الحزمة
k this deck
10
Find the derivative.
A)
B)
C)
D)
E)
A)
B)
C)
D)
E)
فتح الحزمة
افتح القفل للوصول البطاقات البالغ عددها 50 في هذه المجموعة.
فتح الحزمة
k this deck
11
Find the relative minima, and use a graphing utility to check your results.
A)
B)
C)
D)
E) does not exist
A)
B)
C)
D)
E) does not exist
فتح الحزمة
افتح القفل للوصول البطاقات البالغ عددها 50 في هذه المجموعة.
فتح الحزمة
k this deck
12
The figure shows the annual cost for a one-million-dollar term life insurance policy as a function of the age of the insured person. Write the linearization of C at 60.
A)
B)
C)
D)
E)
Write the linearization of C at 60.A)
B)
C)
D)
E)
فتح الحزمة
افتح القفل للوصول البطاقات البالغ عددها 50 في هذه المجموعة.
فتح الحزمة
k this deck
13
The amount in an investment after t years is given by thousand dollars Find the rate of change for the amount after 13 years and interpret the answer.
A) The rate of change is $64.62 thousand per year, which means the investment has increased by approximately $65 thousand every year for 13 years.
B) The rate of change is $64.62 thousand per year, which means the investment is increasing by approximately $65 thousand that year.
C) The rate of change is $32.51 thousand per year, which means the investment has increased by approximately $33 thousand every year for 13 years.
D) The rate of change is $32.51 thousand per year, which means the investment has increased by approximately $33 thousand that year.
E) The rate of change is $6.13 thousand per year, which means the investment has increased by approximately $6 thousand every year for 13 years.
thousand dollars Find the rate of change for the amount after 13 years and interpret the answer.A) The rate of change is $64.62 thousand per year, which means the investment has increased by approximately $65 thousand every year for 13 years.
B) The rate of change is $64.62 thousand per year, which means the investment is increasing by approximately $65 thousand that year.
C) The rate of change is $32.51 thousand per year, which means the investment has increased by approximately $33 thousand every year for 13 years.
D) The rate of change is $32.51 thousand per year, which means the investment has increased by approximately $33 thousand that year.
E) The rate of change is $6.13 thousand per year, which means the investment has increased by approximately $6 thousand every year for 13 years.
فتح الحزمة
افتح القفل للوصول البطاقات البالغ عددها 50 في هذه المجموعة.
فتح الحزمة
k this deck
14
Suppose the flow rate (in cubic feet per second, cfs) of a river in the first 11 hours after the beginning of a severe thunderstorm can be modeled as cfs where h is the number of hours after the storm began. What are the flow rates for and ?
A)
B)
C)
D)
E)
cfs where h is the number of hours after the storm began. What are the flow rates for and ?A)
B)
C)
D)
E)
فتح الحزمة
افتح القفل للوصول البطاقات البالغ عددها 50 في هذه المجموعة.
فتح الحزمة
k this deck
15
For the given function, find the relative maxima.
A)
B)
C)
D)
E) no relative maxima
A)
B)
C)
D)
E) no relative maxima
فتح الحزمة
افتح القفل للوصول البطاقات البالغ عددها 50 في هذه المجموعة.
فتح الحزمة
k this deck
16
The percentage of southern Australian grasshopper eggs that hatch as a function of temperature (for temperatures between 7°C and 25°C) can be modeled as where t is the temperature in °C, data from What temperature between 7°C and 25°C corresponds to the least percentage of eggs hatching? What is the percentage at this input?
A) 25°C, 5.7%
B) 24°C, 5%
C) 7°C, 7.3%
D) 2.5°C, 25%
E) 14°C, 4.17%
where t is the temperature in °C, data from What temperature between 7°C and 25°C corresponds to the least percentage of eggs hatching? What is the percentage at this input?A) 25°C, 5.7%
B) 24°C, 5%
C) 7°C, 7.3%
D) 2.5°C, 25%
E) 14°C, 4.17%
فتح الحزمة
افتح القفل للوصول البطاقات البالغ عددها 50 في هذه المجموعة.
فتح الحزمة
k this deck
17
For fiddler crabs, the weight of the claw can be modeled as pounds when the weight of the body is w pounds. Describe the direction and concavity of for positive values of w.
A) The function f is increasing, concave up for .
B) The function f is decreasing, concave up for .
C) The function f is increasing, convex up for .
D) The function f is decreasing, convex up for .
E) The function f is decreasing, convex up for .
pounds when the weight of the body is w pounds. Describe the direction and concavity of for positive values of w.A) The function f is increasing, concave up for
.B) The function f is decreasing, concave up for
.C) The function f is increasing, convex up for
.D) The function f is decreasing, convex up for
.E) The function f is decreasing, convex up for
. فتح الحزمة
افتح القفل للوصول البطاقات البالغ عددها 50 في هذه المجموعة.
فتح الحزمة
k this deck
18
The future value of an investment after t years is given by thousand dollars. Use the linearization to estimate the future value after 10.5 years.
A) $ 416.484 thousand dollars
B) $ 49.508 thousand dollars
C) $ 32.419 thousand dollars
D) $ 21.501 thousand dollars
E) $ 216.734 thousand dollars
thousand dollars. Use the linearization to estimate the future value after 10.5 years.A) $ 416.484 thousand dollars
B) $ 49.508 thousand dollars
C) $ 32.419 thousand dollars
D) $ 21.501 thousand dollars
E) $ 216.734 thousand dollars
فتح الحزمة
افتح القفل للوصول البطاقات البالغ عددها 50 في هذه المجموعة.
فتح الحزمة
k this deck
19
Estimate the input value(s) where the function has a relative extreme point. Identify each relative extreme as a maximum or minimum, and indicate whether the derivative of the function at that point is zero or does not exist.
A) relative maximum, 0
B) relative maximum, does not exist
C) relative minimum, 0
D) relative minimum, does not exist
E) relative maximum, 0
A)
relative maximum, 0B)
relative maximum, does not existC)
relative minimum, 0D)
relative minimum, does not existE)
relative maximum, 0 فتح الحزمة
افتح القفل للوصول البطاقات البالغ عددها 50 في هذه المجموعة.
فتح الحزمة
k this deck
20
A street vendor constructs the table below on the basis of sales data. Construct a model for consumer expenditure (revenue for the vendor). Sales of Roses, Given the Price per Dozen
A)
B)
C)
D)
E)
A)
B)
C)
D)
E)
فتح الحزمة
افتح القفل للوصول البطاقات البالغ عددها 50 في هذه المجموعة.
فتح الحزمة
k this deck
21
During the summer, an art student makes and sells necklaces at the beach. Last summer she sold the necklaces for $10 each and her sales averaged 20 necklaces per day. When she increased the price by $1, she found that she lost 2 sales per day. Assume that this pattern would continue if she kept increasing the price; that is, for every dollar she raised the price, she would sell 2 fewer necklaces per day. Write a model for the student's daily revenue from the sale of x necklaces.
A)
B)
C)
D)
E)
A)
B)
C)
D)
E)
فتح الحزمة
افتح القفل للوصول البطاقات البالغ عددها 50 في هذه المجموعة.
فتح الحزمة
k this deck
22
Given the units of measure for production and the units of measure for cost or revenue. Write the units of measure for the indicated marginal. Total cost is given by million dollars when q million units are produced; .
A) dollars per unit
B) units
C) units per million dollars
D) million dollars
E) dollars
million dollars when q million units are produced; .A) dollars per unit
B) units
C) units per million dollars
D) million dollars
E) dollars
فتح الحزمة
افتح القفل للوصول البطاقات البالغ عددها 50 في هذه المجموعة.
فتح الحزمة
k this deck
23
Find the second derivative.
A)
B)
C)
D)
E)
A)
B)
C)
D)
E)
فتح الحزمة
افتح القفل للوصول البطاقات البالغ عددها 50 في هذه المجموعة.
فتح الحزمة
k this deck
24
Find the second derivative of the function .
A)
B)
C)
D)
E)
.A)
B)
C)
D)
E)
فتح الحزمة
افتح القفل للوصول البطاقات البالغ عددها 50 في هذه المجموعة.
فتح الحزمة
k this deck
25
The yearly amount of garbage (in million tons) taken to a landfill outside a city during selected years from 1980 through 2010 is given below. Write a model for the data.
A)
B)
C)
D)
E)
A)
B)
C)
D)
E)
فتح الحزمة
افتح القفل للوصول البطاقات البالغ عددها 50 في هذه المجموعة.
فتح الحزمة
k this deck
26
A portion of the shoreline of an island is in the shape of the curve . A hut is located at point C, as shown below. Supplies are delivered by boat to the shoreline. It costs $10 per mile to hire someone to transport the supplies from the shore to the hut. How much does the overland transportation cost?
A) $199
B) $632
C) $196
D) $205
E) $193
. A hut is located at point C, as shown below. Supplies are delivered by boat to the shoreline. It costs $10 per mile to hire someone to transport the supplies from the shore to the hut. How much does the overland transportation cost? A) $199
B) $632
C) $196
D) $205
E) $193
فتح الحزمة
افتح القفل للوصول البطاقات البالغ عددها 50 في هذه المجموعة.
فتح الحزمة
k this deck
27
Find
A)
B)
C)
D)
E)
A)
B)
C)
D)
E)
فتح الحزمة
افتح القفل للوصول البطاقات البالغ عددها 50 في هذه المجموعة.
فتح الحزمة
k this deck
28
A tin-container manufacturing company uses the same machine to produce different items such as popcorn tins and 30-gallon storage drums. The machine is set up to produce a quantity of one item and then is reconfigured to produce a quantity of another item. The plant produces a run and then ships the tins out at a constant rate so that the warehouse is empty for storing the next run. Assume that the number of tins stored on average during 1 year is half of the number of tins produced in each run. A plant manager must take into account the cost to reset the machine and the cost to store inventory. Although it might otherwise make sense to produce an entire year's inventory of popcorn tins at once, the cost of storing all the tins over a year's time would be prohibitive. Suppose the company needs to produce 1.7 million popcorn tins over the course of a year. The cost to set up the machine for production is $1300, and the cost to store one tin for a year is approximately $1. What size production run will minimize setup and storage costs?
A) 66,483 cans
B) 53,403 cans
C) 76,453 cans
D) 46,473 cans
E) 56,423 cans
A) 66,483 cans
B) 53,403 cans
C) 76,453 cans
D) 46,473 cans
E) 56,423 cans
فتح الحزمة
افتح القفل للوصول البطاقات البالغ عددها 50 في هذه المجموعة.
فتح الحزمة
k this deck
29
Find
A)
B)
C)
D)
E)
A)
B)
C)
D)
E)
فتح الحزمة
افتح القفل للوصول البطاقات البالغ عددها 50 في هذه المجموعة.
فتح الحزمة
k this deck
30
Find the second derivative.
A)
B)
C)
D)
E)
A)
B)
C)
D)
E)
فتح الحزمة
افتح القفل للوصول البطاقات البالغ عددها 50 في هذه المجموعة.
فتح الحزمة
k this deck
31
The table lists the time in seconds that an average athlete takes to swim 100 meters freestyle at age x years. Find a model for the data. Time That an Average Athlete Takes to Swim 100 Meters
Freestyle
A)
B)
C)
D)
E)
Freestyle
A)
B)
C)
D)
E)
فتح الحزمة
افتح القفل للوصول البطاقات البالغ عددها 50 في هذه المجموعة.
فتح الحزمة
k this deck
32
A pizza parlor has been experimenting with lowering the price of their large one-topping pizza to promote sales. The average revenues from the sale of large one-topping pizzas on a Friday night (5 P.M. to midnight) at various prices are given below. Find a model for the data.
A)
B)
C)
D)
E)
A)
B)
C)
D)
E)
فتح الحزمة
افتح القفل للوصول البطاقات البالغ عددها 50 في هذه المجموعة.
فتح الحزمة
k this deck
33
A function and its first and second derivatives are given. Use these to find any points of inflection.
A)
B)
C)
D)
E) no points of inflection
A)
B)
C)
D)
E) no points of inflection
فتح الحزمة
افتح القفل للوصول البطاقات البالغ عددها 50 في هذه المجموعة.
فتح الحزمة
k this deck
34
Rewrite the statement into equivalent statement without using the term marginal. At a production level of 500 units, marginal cost is $17 per unit.
A) At a production level of 500 units, cost is increasing by $17 per unit.
B) At a production level of 500 units, cost is decreasing by $17 per unit.
C) At a production level of 500 units, cost is $17 per unit.
D) At a production level of 500 units, cost is increasing by $17 units.
E) At a production level of 500 units, cost is decreasing by $17 units.
فتح الحزمة
افتح القفل للوصول البطاقات البالغ عددها 50 في هذه المجموعة.
فتح الحزمة
k this deck
35
Find the first and second derivatives of the function.
A)
B)
C)
D)
E)
A)
B)
C)
D)
E)
فتح الحزمة
افتح القفل للوصول البطاقات البالغ عددها 50 في هذه المجموعة.
فتح الحزمة
k this deck
36
Write a model for the output variable in terms of one input variable. A rectangular-shaped garden has one side along the side of a house. The other three sides are to be enclosed with 60 feet of fencing. What is the largest possible area of such a garden?
A)
B)
C)
D)
E)
A)
B)
C)
D)
E)
فتح الحزمة
افتح القفل للوصول البطاقات البالغ عددها 50 في هذه المجموعة.
فتح الحزمة
k this deck
37
Find the first and second derivatives of the function.
A)
B)
C)
D)
E)
A)
B)
C)
D)
E)
فتح الحزمة
افتح القفل للوصول البطاقات البالغ عددها 50 في هذه المجموعة.
فتح الحزمة
k this deck
38
The figure shows an estimate of the ultimate crude oil production recoverable from Earth. Estimate the two inflection points on the graph.
A) (79, 23), (120, 23)
B) (55, 10), (130, 10)
C) (22, 3), (165, 3)
D) (90, 30), (110, 30)
E) (0, 0), (200, 0)
A) (79, 23), (120, 23)
B) (55, 10), (130, 10)
C) (22, 3), (165, 3)
D) (90, 30), (110, 30)
E) (0, 0), (200, 0)
فتح الحزمة
افتح القفل للوصول البطاقات البالغ عددها 50 في هذه المجموعة.
فتح الحزمة
k this deck
39
Given the units of measure for production and the units of measure for cost or revenue. Write a sentence interpreting the marginal as an increase. Revenue is given by hundred dollars when q thousand units are sold; .
A) When 16 thousand units are sold, revenue is increasing by $0.30 per unit.
B) When 16 thousand units are sold, revenue is decreasing by $0.30 per unit.
C) When 16 thousand units are sold, revenue is increasing by $30 per unit.
D) When 16 thousand units are sold, revenue is decreasing by $30 per unit.
E) When 16 thousand units are sold, revenue is increasing by $3 per unit.
hundred dollars when q thousand units are sold; .A) When 16 thousand units are sold, revenue is increasing by $0.30 per unit.
B) When 16 thousand units are sold, revenue is decreasing by $0.30 per unit.
C) When 16 thousand units are sold, revenue is increasing by $30 per unit.
D) When 16 thousand units are sold, revenue is decreasing by $30 per unit.
E) When 16 thousand units are sold, revenue is increasing by $3 per unit.
فتح الحزمة
افتح القفل للوصول البطاقات البالغ عددها 50 في هذه المجموعة.
فتح الحزمة
k this deck
40
A function and its first and second derivatives are given. Use these to find all critical values.
A)
B)
C)
D)
E)
A)
B)
C)
D)
E)
فتح الحزمة
افتح القفل للوصول البطاقات البالغ عددها 50 في هذه المجموعة.
فتح الحزمة
k this deck
41
Find the derivative of the function.
A)
B)
C)
D)
E)
A)
B)
C)
D)
E)
فتح الحزمة
افتح القفل للوصول البطاقات البالغ عددها 50 في هذه المجموعة.
فتح الحزمة
k this deck
42
Find .
A)
B)
C)
D)
E)
. A)
B)
C)
D)
E)
فتح الحزمة
افتح القفل للوصول البطاقات البالغ عددها 50 في هذه المجموعة.
فتح الحزمة
k this deck
43
Assume that s, r, and h are differentiable functions of t. If , find when
A) -0.20
B) 1.08
C) 2.33
D) -0.33
E) 1.40
, find when A) -0.20
B) 1.08
C) 2.33
D) -0.33
E) 1.40
فتح الحزمة
افتح القفل للوصول البطاقات البالغ عددها 50 في هذه المجموعة.
فتح الحزمة
k this deck
44
Find the derivative of the function.
A)
B)
C)
D)
E)
A)
B)
C)
D)
E)
فتح الحزمة
افتح القفل للوصول البطاقات البالغ عددها 50 في هذه المجموعة.
فتح الحزمة
k this deck
45
The amount of water an oak tree can remove from the ground is related to the tree's size. Suppose that an oak tree transpires where g is the girth in feet of the tree trunk, measured 5 feet above the ground. A tree is currently 5 feet in girth and is gaining 2 inches of girth per year. If t is time measured in years, evaluate
A) 0.432 gallons/day per year
B) 0.995 gallons/day per year
C) 2.312 gallons/day per year
D) 7.586 gallons/day per year
E) 90.027 gallons/day per year
where g is the girth in feet of the tree trunk, measured 5 feet above the ground. A tree is currently 5 feet in girth and is gaining 2 inches of girth per year. If t is time measured in years, evaluate A) 0.432 gallons/day per year
B) 0.995 gallons/day per year
C) 2.312 gallons/day per year
D) 7.586 gallons/day per year
E) 90.027 gallons/day per year
فتح الحزمة
افتح القفل للوصول البطاقات البالغ عددها 50 في هذه المجموعة.
فتح الحزمة
k this deck
46
A softball diamond is a square with each side measuring 60 feet. Suppose a player is running from second base to third base at a rate of 22 feet per second. At what rate is the distance between the runner and home plate changing when the runner is halfway to third base?
A) 9.84 feet per second
B) 4.84 feet per second
C) 6.84 feet per second
D) 12.84 feet per second
E) 10 feet per second
A) 9.84 feet per second
B) 4.84 feet per second
C) 6.84 feet per second
D) 12.84 feet per second
E) 10 feet per second
فتح الحزمة
افتح القفل للوصول البطاقات البالغ عددها 50 في هذه المجموعة.
فتح الحزمة
k this deck
47
Differentiate the given function with respect to t where r is the radius, and A is the area of the circle. Then, evaluate with
A) 49
B) 56
C) 16
D) 14
E) 112
with A) 49
B) 56
C) 16
D) 14
E) 112
فتح الحزمة
افتح القفل للوصول البطاقات البالغ عددها 50 في هذه المجموعة.
فتح الحزمة
k this deck
48
Find .
A)
B)
C)
D)
E)
. A)
B)
C)
D)
E)
فتح الحزمة
افتح القفل للوصول البطاقات البالغ عددها 50 في هذه المجموعة.
فتح الحزمة
k this deck
49
Boyle's law for enclosed gases states that at a constant temperature, the pressure is related to the volume by the equation , where k is a constant. If the volume is increasing at a rate of 8 cubic inches per hour, at what rate is the pressure changing when the volume is 40 cubic inches and inch-pounds?
A) 0.003 lb/in2/hr
B) -0.003 lb/in2/hr
C) -12.800 lb/in2/hr
D) 1.000 lb/in2/hr
E) -0.025 lb/in2/hr
, where k is a constant. If the volume is increasing at a rate of 8 cubic inches per hour, at what rate is the pressure changing when the volume is 40 cubic inches and inch-pounds?A) 0.003 lb/in2/hr
B) -0.003 lb/in2/hr
C) -12.800 lb/in2/hr
D) 1.000 lb/in2/hr
E) -0.025 lb/in2/hr
فتح الحزمة
افتح القفل للوصول البطاقات البالغ عددها 50 في هذه المجموعة.
فتح الحزمة
k this deck
50
Calculate the derivative of the function with the appropriate formula.
A)
B)
C)
D)
E)
A)
B)
C)
D)
E)
فتح الحزمة
افتح القفل للوصول البطاقات البالغ عددها 50 في هذه المجموعة.
فتح الحزمة
k this deck
فتح الحزمة
افتح القفل للوصول البطاقات البالغ عددها 50 في هذه المجموعة.


